Meet the AMD Radeon™ GPU Profiler (RGP), a ground-breaking low-level optimization tool that provides detailed information on AMD Radeon™ GPUs.
Download the latest version - v2.7
Download AMD RGP (Windows® 11)Download AMD RGP (Linux®)View AMD RGP on GitHubAMD RGP documentation
This release adds the following features:
- Support for additional AMD RDNA™ 4 architecture hardware (AMD Radeon™ AI PRO R9600 Series Graphics).
- Support for additional AMD RDNA 3.5 architecture-based APUs (AMD Ryzen™ AI 400 Series Processors with AMD Radeon 800M Series Graphics).
- Support for displaying DirectX® 12 shader source code via PDB/debug info.
- Support for displaying data on thread divergence for non-ray tracing workloads in the Instruction timing pane.
- Support for Extended PIX Markers in DirectX 12 profiles (requires the Microsoft® AgilitySDK 1.721-preview and AMD Software: AgilitySDK Developer Preview Edition 26.10.07.02 driver).
- Support for filtering events by shader hash values in the UI.
- Launch and Callable shaders are now shown in the Indirect ray tracing pipeline flow chart, including filtering support.
- Driver information is now displayed in the System information page for profiles from HIP and OpenCL™ applications.
- Improved “Color by user marker” mode in the Event timeline and Event timing panes so that events are assigned the same color as their correlated user marker.
- Improved the AMD Radeon GPU Analyzer (RGA) interop window with support for multi-selection, search filtering, and a streamlined list view for events with a large number of binaries.
- Bug, stability, and usability fixes.
Features
Unlike the black box approach of the past, PC game developers now have unprecedented, in-depth access to a GPU and can easily analyze graphics, async compute usage, event timing, pipeline stalls, barriers, bottlenecks, and other performance inefficiencies.
This unique tool generates easy to understand visualizations of how your DirectX® 12, Vulkan®, OpenCL™, and HIP applications interact with the GPU at the hardware level. Profiling a game is both a quick and simple process using the AMD Radeon™ Developer Panel and our AMD Software: Adrenalin Edition™ driver.
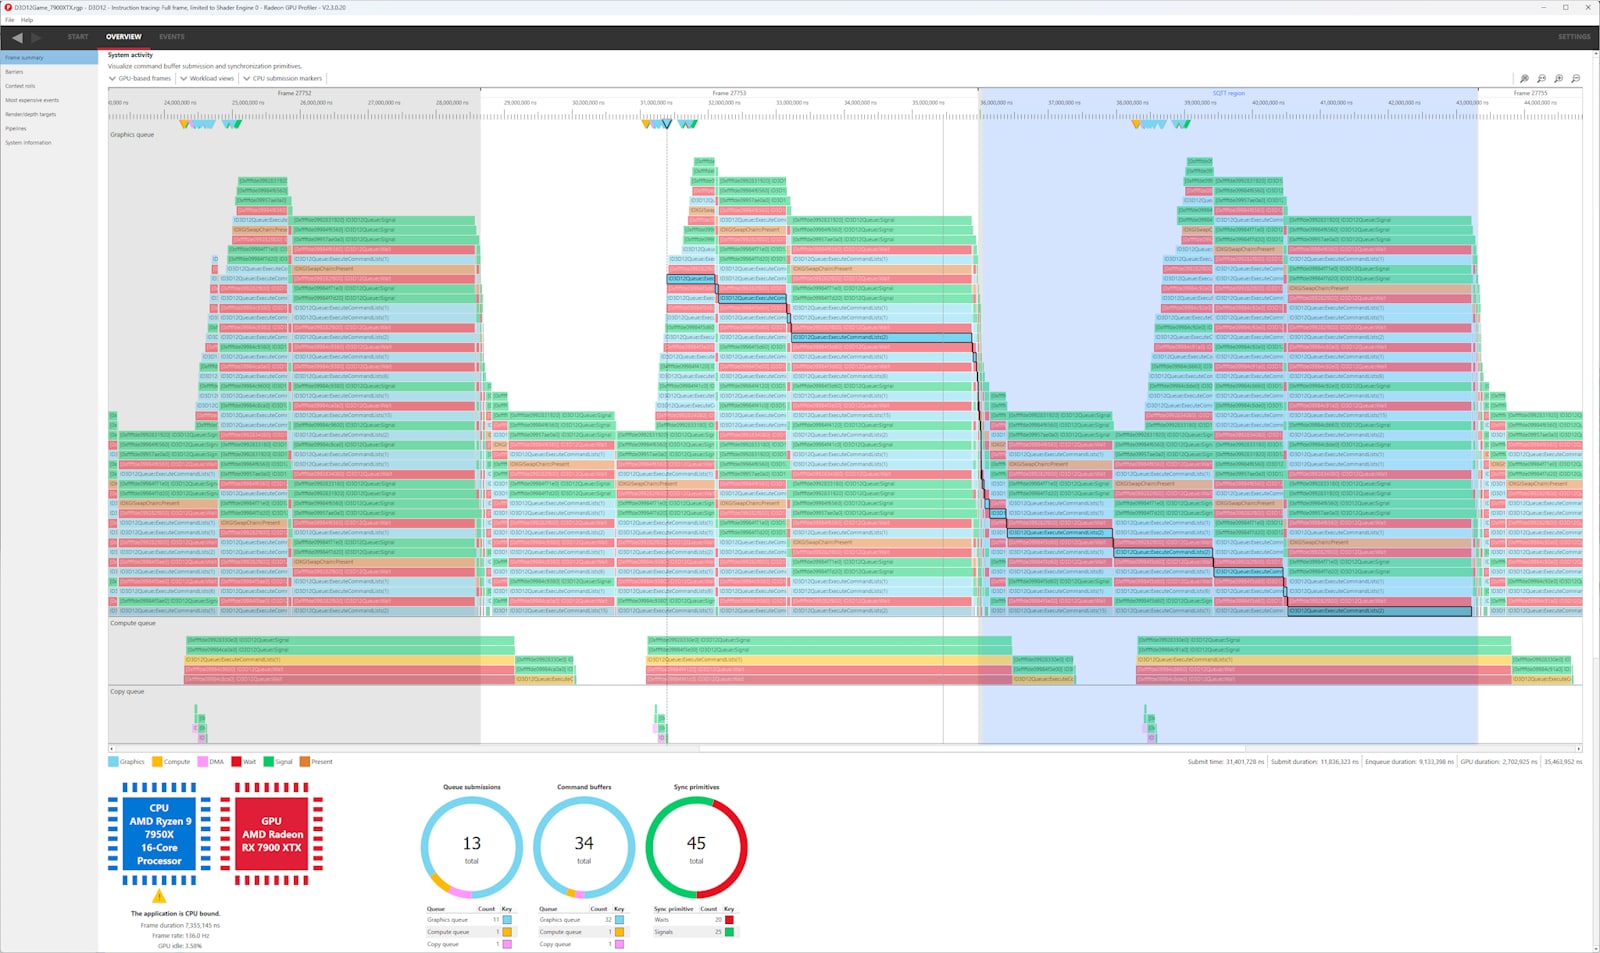
Figure out your frame
Get a bird’s eye view of how your command buffers got submitted to each GPU queue.
Understand how your graphics, async compute, and copy workloads interact and synchronize.
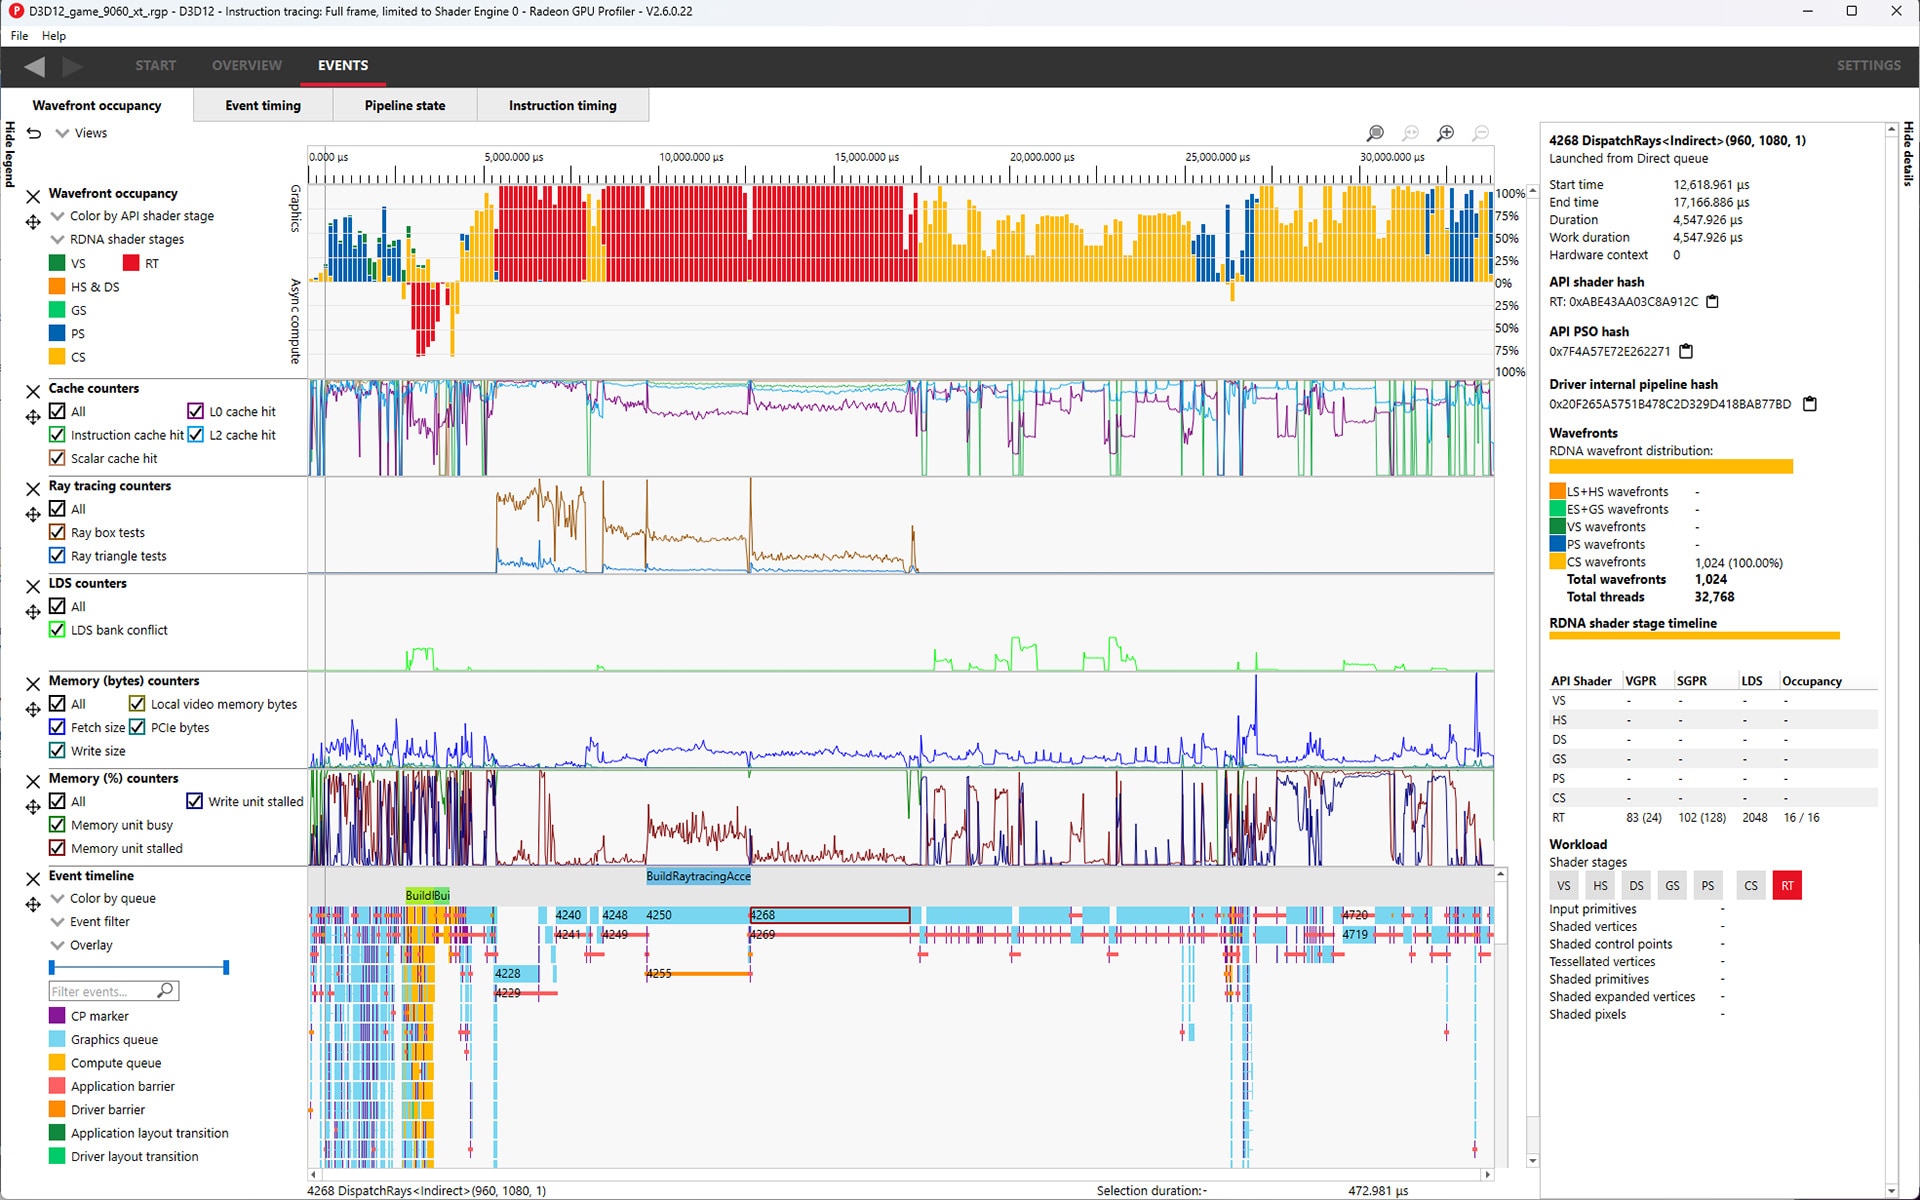
Wade through your wavefronts
Understand how your wavefronts were pushed through the GPU. We can also correlate between wavefronts and the GPU events which launched them and provide insight into how your frame utilizes the various GPU memory caches.
The data displayed in this view is highly filterable, groupable, and includes a side panel with added detail about user selections.
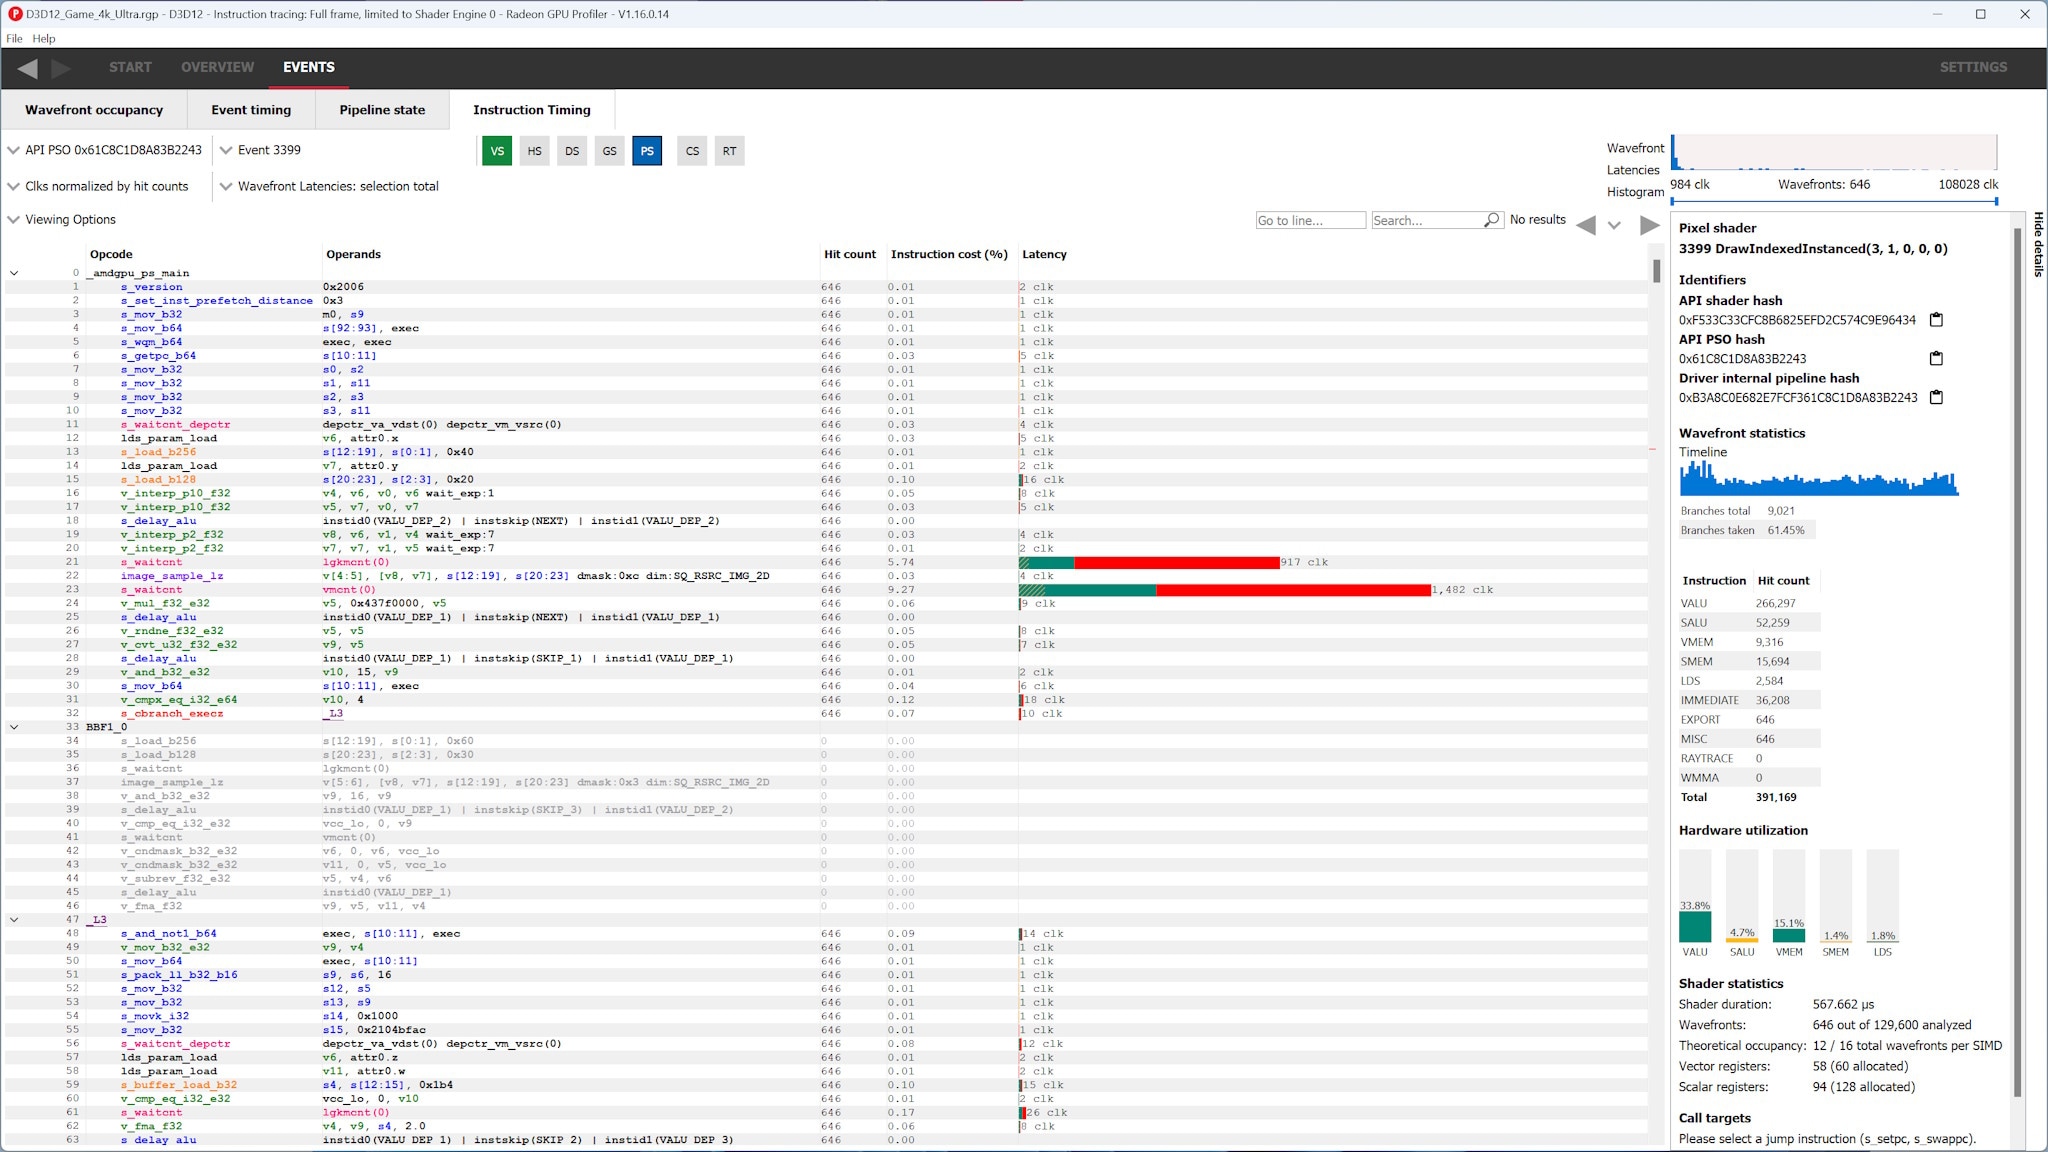
Speed up your shaders
Quickly and easily find hotspots in your shaders using the instruction timing view.
Each instruction in your AMD RDNA™ arcitecture ISA has a bar showing its average latency, allowing you find the right things to optimize.
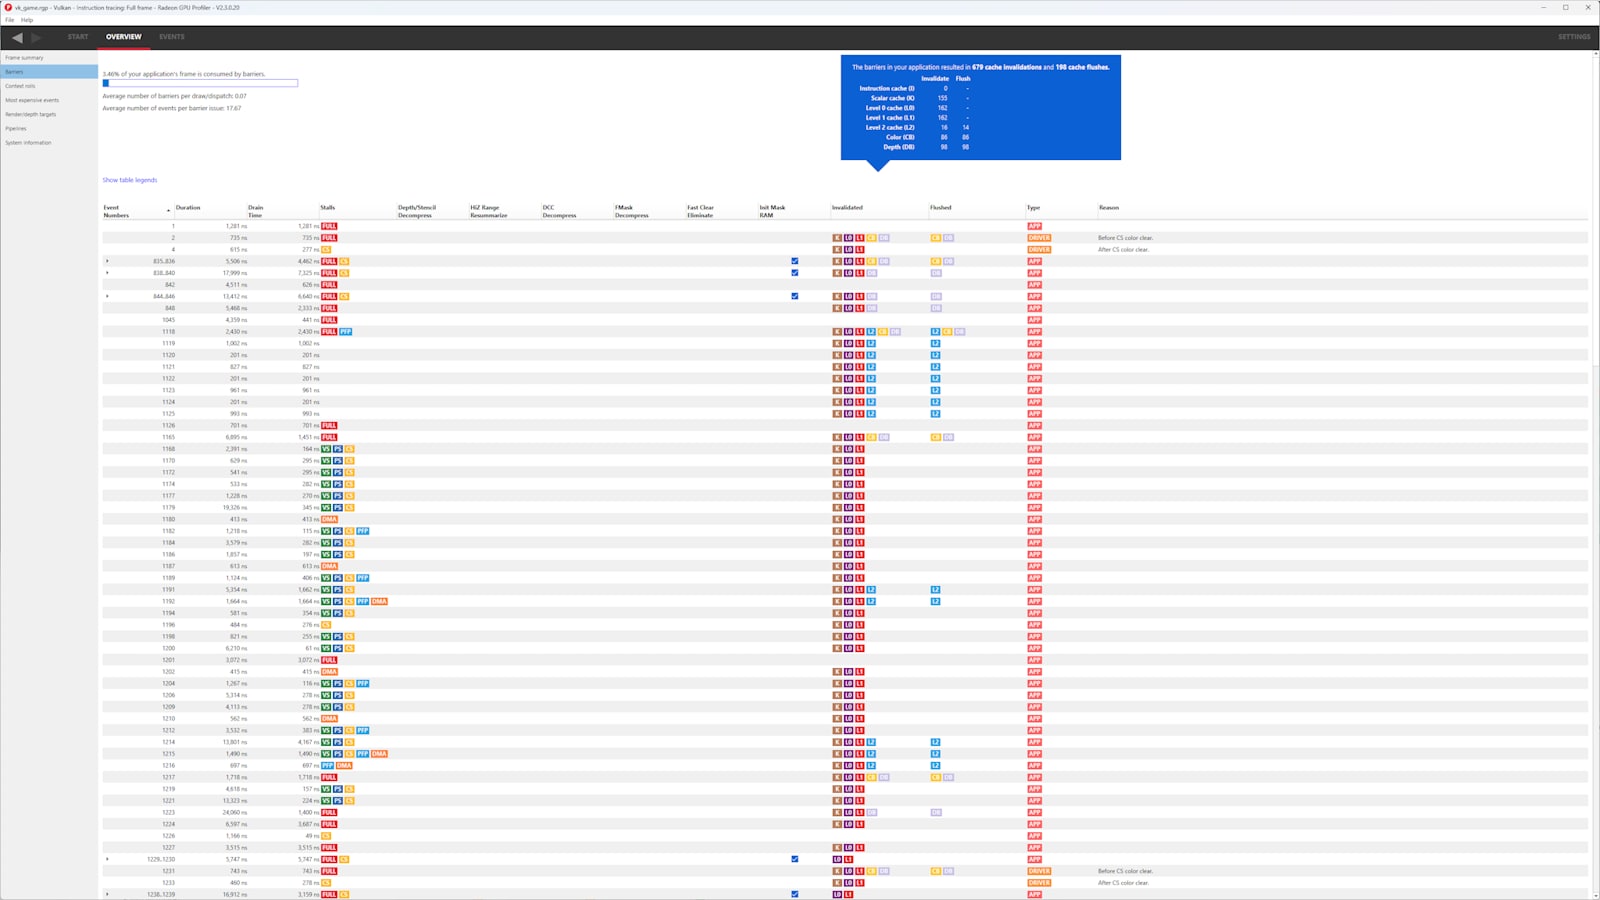
Banish those barriers!
Find out which barriers flushed caches, caused a synchronization point or even ran their own, internal shaders.
Burst those pipeline bubbles and claim back your performance.
Requirements
Supported GPUs
- AMD Radeon™ RX 9000 Series Graphics
- AMD Radeon™ RX 7000 Series Graphics
- AMD Radeon™ RX 6000 Series Graphics
- AMD Radeon™ RX 5000 Series Graphics
- AMD Radeon™ AI PRO R9700 Series Graphics
- AMD Radeon™ AI PRO R9600 Series Graphics
- AMD Ryzen™ Processors with AMD Radeon™ Graphics based on AMD RDNA™ architecture or newer
- ROG Xbox Ally X (AMD Ryzen™ AI Z2 Extreme)
Supported graphics APIs
- DirectX® 12
- Vulkan®
Supported compute APIs
- OpenCL™
- HIP
Supported OSs
- Windows® 11
- Linux® – Ubuntu 24.04 LTS (Vulkan® only)
Version history
- Support for additional AMD RDNA™ 4 architecture hardware (AMD Radeon™ AI PRO R9600 Series Graphics).
- Support for additional AMD RDNA 3.5 architecture-based APUs (AMD Ryzen™ AI 400 Series Processors with AMD Radeon 800M Series Graphics).
- Support for displaying DirectX® 12 shader source code via PDB/debug info.
- Support for displaying data on thread divergence for non-ray tracing workloads in the Instruction timing pane.
- Support for Extended PIX Markers in DirectX 12 profiles (requires the Microsoft® AgilitySDK 1.721-preview and AMD Software: AgilitySDK Developer Preview Edition 26.10.07.02 driver).
- Support for filtering events by shader hash values in the UI.
- Launch and Callable shaders are now shown in the Indirect ray tracing pipeline flow chart, including filtering support.
- Driver information is now displayed in the System information page for profiles from HIP and OpenCL™ applications.
- Improved "Color by user marker" mode in the Event timeline and Event timing panes so that events are assigned the same color as their correlated user marker.
- Improved the AMD Radeon GPU Analyzer (RGA) interop window with support for multi-selection, search filtering, and a streamlined list view for events with a large number of binaries.
- Bug, stability, and usability fixes.
Related news and technical articles
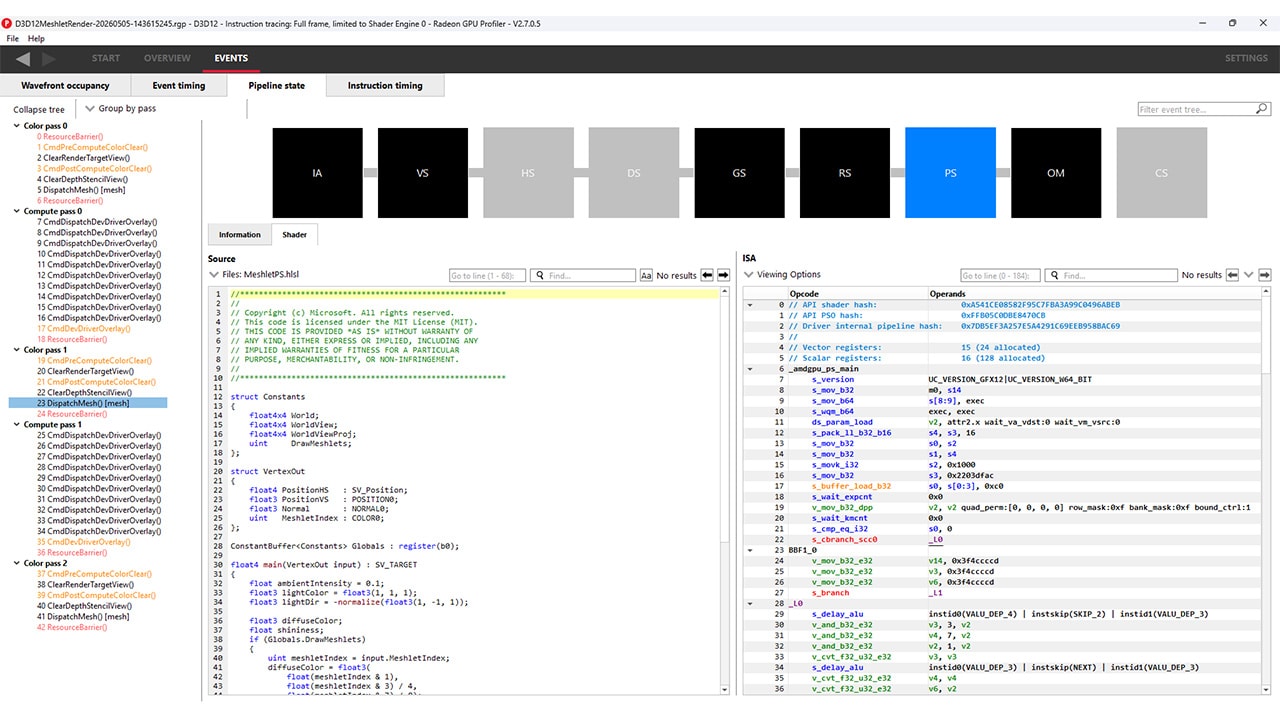
New AMD Radeon Developer Tool Suite update brings shader source code, Extended PIX Markers, and command-line capture
The new AMD Radeon Developer Tool Suite release delivers RGP 2.7 with shader source code viewing, instruction‑level divergence metrics, and Extended PIX Marker support, expanded hardware compatibility, and updates across RGD, RRA, RMV, RGA, and RDP.
AMD and Microsoft partner on DirectX ML, DirectStorage, and developer tools at GDC 2026
Microsoft and AMD partnered at GDC to announce powerful new developer technologies for Windows, including DirectStorage 1.4, PIX tools updates, DirectX ML integration, Advanced Shader Delivery, and support for the latest Agility SDK update.
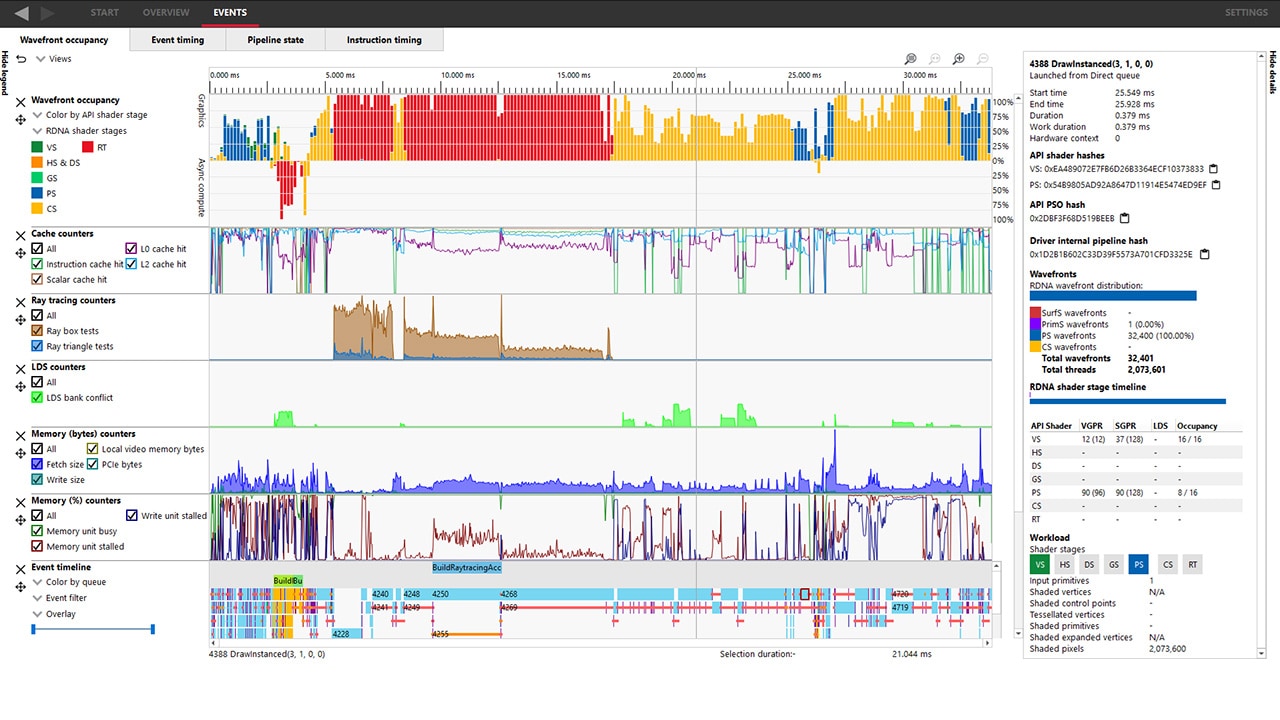
AMD Radeon Developer Tool Suite updated with new GPU support and significant RGP enhancements
The latest version of the RDTS is designed to empower developers with enhanced capabilities for profiling, analyzing, and optimizing their GPU applications.
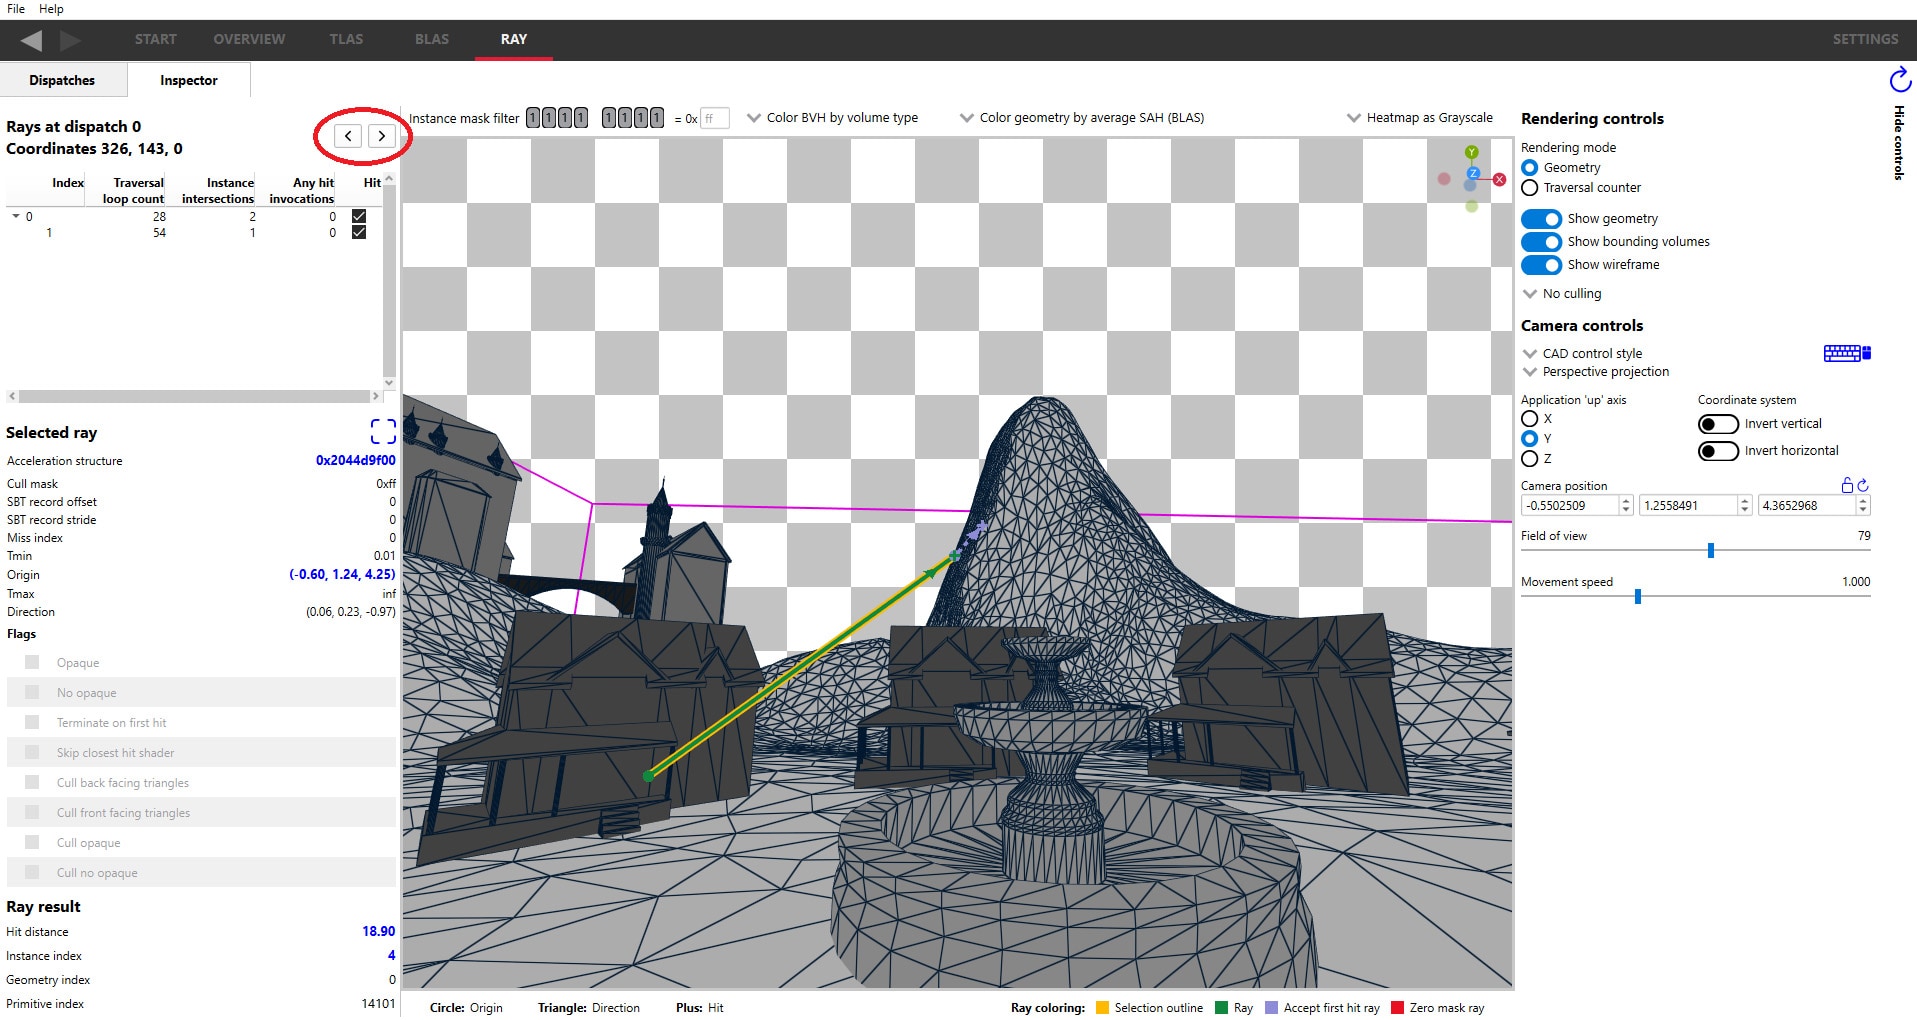
Introducing the Latest AMD Radeon Developer Tool Suite with Support for AMD Radeon RX 9060 XT
We've released an updated AMD Radeon™ Developer Tool Suite, including enhanced versions of tools such as the Radeon GPU Detective, Profiler, Raytracing Analyzer, Memory Visualizer, GPU Analyzer, and Developer Panel, now with expanded GPU support.
Major AMD Radeon Developer Tool Suite updates for AMD RDNA 4 architecture
Read the highlights of our updates to the AMD Radeon Developer Tool Suite to support the launch of AMD RDNA 4 architecture!
AMD Radeon™ GPU Profiler 2.4 adds support for AMD Radeon™ RX 9000 Series, pure-compute applications, DirectML applications (and more!)
Discover the latest Radeon GPU Profiler v2.4, now supporting Radeon RX 9000 Series GPUs and profiling for pure compute and DirectML applications. Enhance your optimization with improved ISA views and Work Graphs support.
New Radeon™ Developer Tool Suite brings Driver Experiments, Dark Mode to Tools
Find out more about our latest tools release, including driver experiments, updates to RRA, RGP, and more!
New Radeon™ Developer Tool Suite Release migrates to Qt® version 6.
The latest version of the Radeon Developer Tool Suite is now available! This release features a number of updates including all GUI-based tools upgrading to Qt® v6.7.0.
Related videos
GDC 2024 - Game Optimization With The Radeon™ Developer Tool Suite - YouTube link
This session presents the latest enhancements in the RDTS, a rich set of GPU profilers and analyzers and a new GPU crash analysis tool.
Optimizing Game Performance with the Radeon Developer Tool Suite (GDC 2023 - YouTube link)
This talk gives an overview of RGP, RMV, RRA, and RGA, introducing new features and improvements, and reveal the current work in progress.
Game Optimization: Radeon™ Developer Tools on RADV and Steam Deck™ (Vulkanised 2023 - YouTube link)
This talk at Vulkanised 2023 covers how to use the Radeon Developer Tool Suite (RDTS) to optimize games using RADV and Steam Deck.
Introduction to raytracing with Radeon Developer Tool Suite
In this video, Can Alper introduces RRA V1.0. He explains how to capture games using RDP and evaluate when to use RRA.
Raytracing Performance Revealed - How to Optimize your Game with the Radeon™ Developer Tool Suite - YouTube link
In this presentation, we demonstrate how to use Radeon™ GPU Profiler and Radeon™ Raytracing Analyzer, to illuminate performance issues.
AMD RDNA™ 2 – Radeon™ GPU Profiler 1.10 - YouTube link
RGP 1.9 and 1.10 introduce support for AMD Radeon™ RX6000 series GPUs, a new memory cache counter feature, and support for DirectX® and Vulkan® ray tracing.
AMD RDNA™ 2 – Radeon™ Developer Tool Suite - YouTube link
This video describes the benefits of bundling the Radeon™ GPU Profiler, Radeon™ Memory Visualizer, Radeon™ GPU Analyzer, and the Radeon™ Developer Panel into a single downloadable suite.
Curing Amnesia and Other GPU Maladies With AMD Developer Tools - YouTube link
This video introduces the new Radeon™ Memory Visualizer to help answer questions about memory allocations, resource bindings, page mappings, and more. Includes updates on RGP and RGA.