
gpuviewer
— the GPU flight recorder —
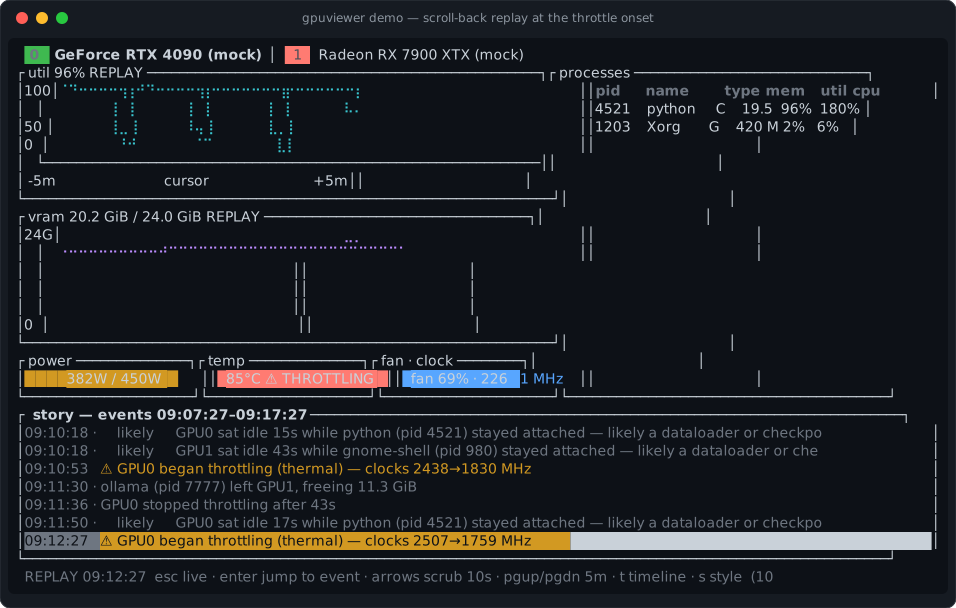
The built-in demo (gpuviewer demo, simulated data and labeled as such)
opens already scrolled back to the night's last throttle onset — the first thing you see is the answer, not a gauge.
It was already recording. Scroll back to 02:14 — it'll tell you why. Your training run
flatlined while you slept. Every other GPU monitor would show you a beautiful live gauge —
of a moment that no longer exists. gpuviewer keeps persistent per-process history and a
narrated event log just by being open, so the next morning you scroll back to the moment
it happened and read the story in plain English.

Scrub an example night in your browser →
Install · Quick start · How it compares · Honesty contract · Status · Architecture · Keybinds
Status —
v0.1.0is out. Prebuilt binaries for Linux (tar.gz/.deb/.rpm/ AppImage), Windows (zip) and macOS Apple Silicon (tar.gz), each with checksums and build-provenance attestations. Linux covers NVIDIA, AMD and Intel; Windows covers all three through NVML and the WDDM performance counters; macOS covers Apple Silicon at the device level. Install · Releases
How gpuviewer is different
GPU monitoring is a well-served space — and this section is here to be honest about
that. nvtop, nvitop, btop, all-smi and qmassa are all good at showing you right
now, and several are more mature than this. What almost none of them do is remember:
close the terminal and the evidence is gone, so the incident you actually care about is the
one nobody was watching.
- 🎞️ Always-on recording, no setup — history and events are written by virtue of the
binary being open. No daemon to install, no
recordsubcommand you had to run before the incident. (all-smi and qmassa ship real replay — of recordings you started in advance.) - 🕰️ Scroll-back replay — jump to any recorded moment and get the full picture back:
charts, process table, gauges, story feed.
Enteron any event lands you exactly there. - 🗣️ Narrated causes, not thresholds — throttle onset with clock deltas, VRAM climb with an ETA, the process that exited and what it freed — in sentences, with the raw evidence attached. (Alert rules tell you a number crossed a line; they don't tell you why.)
- ⚖️ Facts and inferences are different things — every event carries
confidence: fact | likely. Observed state transitions are asserted plainly; anything derived says "likely" in the sentence and expands to the numbers behind it. - 🔍 Per-process across all three Linux vendors — NVIDIA, AMD, and Intel in both the i915 and xe dialects, with CPU% and container identity where the kernel exposes them.
- 📦 One unprivileged binary — no root, no kernel module, no daemon, no Python environment. It degrades instead of failing when a driver won't answer.
Three altitudes on one recording
| view | question it answers | |
|---|---|---|
| 🔭 | Timeline (t) |
"What did the whole night look like?" — hours of history as solid strips, event markers underneath |
| 🎞️ | Replay (r, or Enter on anything) |
"What exactly happened at 02:14?" — full charts, processes, gauges, story feed at any recorded moment |
| 📡 | Live | "What is it doing right now?" — and it's recording the other two views while you watch |
You move between them with single keys: spot the anomaly on the timeline, Enter to drill
into replay at that exact column, Esc back to live. The cursor line always shows the
nearest recorded event.
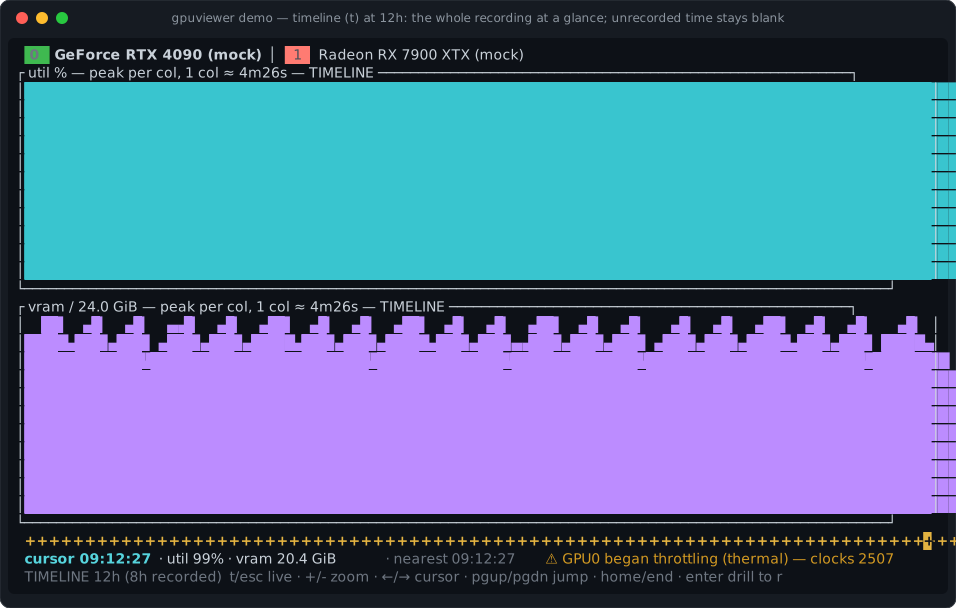
The timeline zooms from 1h to 7d (+/-). Each column is the recorded peak —
and time that wasn't recorded stays blank, never painted as zero. The footer says exactly how much is real: "12h (8h recorded)".
What it tells you
Example narrations, in the exact shape the event engine emits them. The tag is the confidence tier: facts are observed state transitions; inferences always say "likely" in the sentence itself and carry the raw numbers in an auditable evidence field.
[fact]GPU0 began throttling (thermal) — clocks 2520→1815 MHz[fact]GPU0 stopped throttling after 1m 31s[likely]GPU0 VRAM 92% and climbing ~270 MiB/min — likely full in ~8 min (largest holder: python pid 4521)[likely]GPU0 sat idle 47s while python (pid 4521) stayed attached — likely a dataloader or checkpoint stall[likely]GPU0: python (pid 4521) likely hung — held 20.1 GiB for 10m 12s with zero GPU activity, process still alive[likely]ollama (pid 7777) loaded 11.3 GiB but GPU1 is ~idle while its CPU runs hot — likely partial CPU offload (model may not fit in VRAM)[fact]collection stalled 4.2s — a backend probe blocked; the data gap is recorded, last good frame at 02:14:31[fact]python (pid 4521) left GPU0, freeing 21.3 GiB
Inference thresholds are deliberately conservative — a hang is only narrated after ten unbroken minutes of held VRAM with zero engine activity, and any break in the premise drops the claim silently. A confidently-wrong narration is worse than no narration.
The morning-after digest
Plain text, no ANSI, paste-able into Slack or a bug report:
$ gpuviewer report --since 22:00
gpuviewer report — 2026-06-06 22:00 .. 2026-06-07 08:41 (23 events: 17 facts, 6 inferences)
GPU0 (GeForce RTX 4090): util avg 81% / max 99%, temp max 88°C, mem max 23.3 GiB, throttle buckets 14
GPU1 (Radeon RX 7900 XTX): util avg 12% / max 87%, temp max 71°C, mem max 12.4 GiB, throttle buckets 0
23:41:07  INFO  [fact]    ollama (pid 7777) attached to GPU1, using 11.3 GiB
02:14:31  WARN  [fact]    GPU0 began throttling (thermal) — clocks 2520→1815 MHz
02:14:48  INFO  [likely]  GPU0 sat idle 17s while python (pid 4521) stayed attached — likely a dataloader or checkpoint stall
02:16:02  INFO  [fact]    GPU0 stopped throttling after 1m 31s
03:02:11  WARN  [likely]  GPU0 VRAM 92% and climbing ~270 MiB/min — likely full in ~8 min (largest holder: python pid 4521)
06:58:40  INFO  [fact]    python (pid 4521) left GPU0, freeing 21.3 GiB
Install
# Linux / macOS
curl -fsSL https://raw.githubusercontent.com/singhpratech/gpuviewer/main/install.sh | sh
# Windows (PowerShell)
irm https://raw.githubusercontent.com/singhpratech/gpuviewer/main/install.ps1 | iex
The scripts verify the download's SHA256 against the release's checksum file before installing, drop a single binary in your user bin dir, and never need root/admin.
From crates.io, or from source:
cargo install gpuviewer-tui          # the `gpuviewer` binary
cargo build --release                # or straight from a clone
Packaged builds (Linux tar.gz/.deb/.rpm/AppImage, Windows zip, macOS tar.gz —
with checksums and build-provenance attestations) are produced per release tag. Every
install path, platform note (Windows SmartScreen, macOS quarantine), and verification step
lives in docs/packaging/installing.md.
Quick start
gpuviewer                            # live TUI — already recording
gpuviewer demo                       # 8h simulated incident, opens at the throttle onset
gpuviewer report --since 12h         # the digest above, from your real history
gpuviewer export --since 2h oom.gpvr # shareable incident slice
gpuviewer view oom.gpvr              # replays anywhere — no GPU required
No GPU? No problem — --mock (also the automatic fallback) runs the full TUI on simulated
GPUs. Mock data is always labeled "(mock data)" and records to a separate database, never
your real history.
Boot-time recording. "Always-on" means by virtue of normal use — there is deliberately
no daemon. If you want the recording running from login instead, run the headless stream
under a systemd user unit; a ready-made example with mild, GPU-safe hardening (and a
comment explaining every directive) ships at
docs/packaging/gpuviewer.service —
systemctl --user enable --now gpuviewer.service. The per-database instance lock makes
this safe alongside the interactive TUI: while the unit holds the recording, a TUI you
open by hand runs live-only (and says so), and report/replay/view read the same
history concurrently.
Scripting and agents. One NDJSON frame per tick plus that tick's narrated events, every metric nullable, versioned and conformance-tested:
gpuviewer --json --once # one frame + its events to stdout, then exit 0The stream contract — frames and events in one timestamped stream, JSON Schema, written
compatibility promise — is docs/spec/ndjson-v1.md. Events can
also drive your own plumbing: --on-event 'CMD' runs a command per event with
GPV_EVENT_* in the environment (rate-capped), e.g.
--on-event 'curl -s -d "$GPV_EVENT_TITLE" ntfy.sh/mytopic'.
How it compares
The honest version: several good tools own one half of the flight-recorder sentence. The combination — always-on by virtue of normal use, per-process, scroll-back replay, narrated causes under a facts-vs-"likely" contract, in one unprivileged binary — is the part that's ours.
| gpuviewer | nvtop | all-smi | qmassa | LACT | gpud | netdata | |
|---|---|---|---|---|---|---|---|
| Always-on recording, no setup/daemon | ✓ | — | — ¹ | — ¹ | — | ◐ ⁴ | ◐ ³ |
| Scroll-back replay in-tool | ✓ | — | ✓ ¹ | ✓ ¹ | — | — | ✓ ³ |
| Narrated causes, facts vs "likely" | ✓ | — | — | — | ◐ ² | ◐ ⁴ | — |
| Per-process attribution (NVIDIA + AMD + Intel incl. xe) | ✓ | ✓ | ◐ ⁵ | ◐ ⁵ | — | — | — |
| Single unprivileged binary | ✓ | ✓ | ✓ | — ⁶ | — | ◐ ⁴ | — |
¹ all-smi (record → view --replay) and qmassa (-t → replay) both ship real TUI
replay — of recordings you explicitly started beforehand. Great when you knew the
incident was coming; no help for the one you didn't predict.
² LACT decodes throttle causes on all three vendors and shades them on its charts — in a live GUI with an in-memory window (ephemeral; no persisted event log, no replay).
³ netdata's history is the real thing (per-second, ~14-day default retention, scrub-back dashboards) — device-level, as a daemon with per-collector GPU configuration, no per-process GPU, and threshold alerts rather than causes.
⁴ gpud ships genuine fact-tier events (Xid, kmsg, hw-slowdown) from a single binary — built as a fleet-health daemon, NVIDIA-focused, no scroll-back timeline, no narration.
⁵ all-smi: multi-vendor including Intel i915 + xe, but no AMD. qmassa: AMD + Intel, no NVIDIA.
⁶ qmassa's deeper telemetry is sudo-gated.
If one of those fits your problem better, use it — LACT for fan/OC control, netdata for fleet dashboards, gpud for cluster health verdicts. (Cells reflect our reading of each tool as of June 2026; corrections welcome.)
The honesty contract
A flight recorder you can't trust is decoration. Every design decision below exists because a confidently-wrong number would kill the whole premise:
- Facts vs inferences. Every event carries
confidence: fact | likely. Facts (a throttle bit set, a process gone from the list) are asserted plainly. Inferences (stall, hang, spillover, OOM ETA) always read as hedged and carry anevidencefield with the raw numbers — visible in the TUI, the digest, and the JSON stream. - "Utilization" is duty-cycle, not saturation. It measures the fraction of time at least one kernel was resident — a GPU at "100%" may be nowhere near compute- or bandwidth-bound. It is never presented as capacity used.
- Absence is a normal outcome, not an error. Every metric is nullable. Driver
NOT_SUPPORTED, missing sysfs/hwmon files, MIG mode, and privilege walls render as "unavailable" — never zero, never a crash. Where the reason is knowable it is explained in-UI: on WSL2, per-process GPU attribution is unavailable at the driver level and the process pane says so; without root/CAP_SYS_PTRACE, fdinfo can only attribute your own processes and the pane shows a "your processes only" hint rather than pretending the list is complete. - Unrecorded time renders blank. On the timeline and every chart, a gap in the recording is a visible hole — never interpolated, never painted as zero activity.
- The recorder reports on itself. A blocked driver probe or missed tick becomes a
recorded
[fact]event ("collection stalled … the data gap is recorded") — a hole in the recording never masquerades as the GPU having gone quiet. A quarantined-and-recreated history file is narrated as a history reset, for the same reason. - Polling must not perturb what it measures. Idle GPUs are polled on a stretched cadence
(up to 5× the interval) so monitoring doesn't keep them awake or break GFXOFF; the
effective cadence is shown in the footer rather than hidden;
--no-backoffopts out. - Self-impact is measured, not assumed. On the dev machine (RTX 4090 Laptop + Intel
iGPU, two backends polled at a 1 s interval), 60 s of headless recording costs
1.6 CPU-seconds — ≈2.7% of one core — at ~25 MiB RSS, and the full TUI measures
the same ≈2.8%. Numbers vary with GPU count, driver, and kernel; remeasure yours with
/usr/bin/time -v gpuviewer --json > /dev/null. - Mock data is always labeled. The footer says "(mock data)" exactly when the data is mock — including replays of mock recordings — and mock/demo runs record to separate database files, never your real history.
- No vendor SDK is hard-linked, no vendor CLI is exec'd. NVML is loaded at runtime; AMD and Intel are read straight from the kernel's sysfs/fdinfo interfaces.
The journey
This project was built research-first, and the research is in the repo:
- Study the field before writing code.
docs/research/holds the June-2026 evidence — the market gap, every competitor's actual capabilities (with issue numbers), the vendor API minefield, and the stack decision record (04-synthesis.md). The architecture wasn't guessed; it was argued in writing. - Learn from other people's scars. No vendor SDK is hard-linked because soname churn
broke btop on AMD twice. NVML is loaded by its versioned name (
libnvidia-ml.so.1) because the bare.soonly exists with the CUDA toolkit installed. Polling is adaptive because monitoring tools have kept GPUs awake (bottom #1291) and broken GFXOFF. WSL2's per-process wall is detected and explained because crashing on it is a known trap (nvtop #459). - Mock-first, so everything is testable. The full suite passes on machines with no GPU: a deterministic mock backend implements the same trait as the real ones, sysfs/fdinfo collectors read from committed fixture trees, and the NDJSON contract has a conformance suite that runs the built binary against the spec.
- Ship the recorder, then the narrator, then the time machine. History rollups came
first, then the event engine with the facts-vs-likely contract, then scroll-back replay,
then
.gpvrexport, and most recently the zoomed-out timeline — each layer riding on the one before it.
Status
v0.1.0. Install paths: docs/packaging/installing.md.
| Platform | Backends |
|---|---|
| Linux | NVIDIA (NVML, runtime-loaded) · AMD (sysfs/gpu_metrics/fdinfo) · Intel (i915 + xe) |
| Windows | NVIDIA (NVML device truth + PDH per-process fill, joined by LUID↔PCI match) · cross-vendor WDDM (PDH: NVIDIA/AMD/Intel device + per-process) |
| macOS Apple Silicon | Device-level only — per-process GPU is OS-prohibited and the UI says so, never fakes it |
Missing drivers degrade rather than fail, so the quickest way to see what you get on your
box is to run it — and --mock works with no GPU at all. If something looks wrong,
open an issue; reports from real
hardware are the most useful thing you can send.
In the binary today:
- Backends: NVIDIA (NVML, runtime-loaded — never hard-linked), AMD (sysfs/hwmon +
versioned
gpu_metricsthrottle decoders v1.1–v3.0 + fdinfo), Intel (fdinfo in both the i915 and xe dialects + sysfs), deterministic mock fallback. Devices deduped across backends by PCI address. - Always-on recording: SQLite (WAL) 10s/1m rollups + an append-only event log, with per-process rollups (memory, util, CPU%, container identity when knowable), retention sweeps, and corrupt-database quarantine. Raw 1 Hz samples never touch disk — the live window rides in RAM rings.
- Timeline overview: the whole recording as solid strips, 1h–7d zoom, peak-per-column
(labeled as such), event lane, time cursor with nearest-event readout,
Enterdrills into replay at the cursor. Gaps stay blank. - Scroll-back replay:
rfrom the live view, orEnteron any event in the story feed to jump straight to it; scrub by 10s/5m; works on your real history, the demo, and exported recordings. - Narrated events: throttle onset/recovery with clock deltas, process attach/exit with freed VRAM, VRAM-pressure ETA, idle gap, suspected hang, CPU spillover, collector stall/slow-probe self-reports, history reset.
- Chart styles: braille step-outline (default) or solid fill —
ctoggles, your pick; both break honestly at recording gaps. - Subcommands and sinks:
report(plain-text digest),demo(pre-seeded incident),export/view(shareable.gpvrincident files that replay anywhere, no GPU required),--json(NDJSON contract v1 with JSON Schema and a conformance test that runs the built binary),--on-eventcommand sink, adaptive idle backoff. - Tests: the full suite passes on machines with no GPU — everything runs against the mock backend and committed sysfs/fdinfo fixture trees.
Not in it yet:
- The iced GUI — see the roadmap below.
- Soak across the full driver matrix, which is a manual checklist by design: CI stays GPU-free so the whole suite runs on any machine, including yours.
Architecture
gpuviewer-core      trait GpuBackend (nvtop's vtable, translated to Rust)
                    ├─ nvidia: nvml-wrapper (runtime dlopen, never hard-linked)
                    │          + on Windows: per-process fill from the shared PDH snapshot
                    ├─ amd:    sysfs/hwmon/gpu_metrics(v1.1–v3.0)/fdinfo (zero library deps)
                    ├─ intel:  fdinfo (i915 + xe dialects) + sysfs
                    ├─ wddm:   Windows cross-vendor (DXGI + PDH + D3DKMT — OS surfaces only)
                    ├─ apple:  macOS device-level (Metal; private tiers gated post-WWDC26)
                    └─ mock:   deterministic simulation (CI + demo; no GPU required)
gpuviewer-history   RAM rings (live window) → 10s/1m SQLite rollups + event log
gpuviewer-tui       ratatui — live · timeline · replay, story feed
                    + report · demo · export (.gpvr) · view   (+ --json mode)
Built in Rust, all-Rust dependency tree. Missing drivers degrade gracefully,
NOT_SUPPORTED is a normal per-metric outcome, and the tool never out-consumes what it
monitors (adaptive polling; low-power cadence surfaced in the footer).
Keybinds
Every navigation key has a letter alias — Mac laptops have no PgUp/PgDn/Home/End
and terminals tend to eat the Fn+arrow substitutes. One rule across all modes:
w/a/s/d mirror the arrows, A/D (shifted) mirror PgUp/PgDn, g/G
mirror Home/End.
| Live | |
|---|---|
q / Esc |
quit |
← → / a d / Tab / Shift-Tab |
switch device |
p |
pause/resume collection |
↑ ↓ / w s then Enter |
jump to a story-feed event |
r |
replay at the newest recorded moment |
t |
timeline overview |
c |
chart style: braille ↔ solid |
| Replay | |
|---|---|
Esc / r |
back to live (inert in view — a file has no live mode behind it) |
← → / a d |
scrub 10s |
PgUp / PgDn / A / D |
scrub 5m |
Home / g |
oldest recorded moment |
End / G |
newest recorded moment |
↑ ↓ / w s then Enter |
jump to the selected event |
t / c |
timeline · chart style |
| Timeline | |
|---|---|
t / Esc |
back to live (to the pinned replay in view — a file has no live mode) |
+ / - |
zoom: 1h · 3h · 6h · 12h · 24h · 48h · 7d |
← → / a d |
move the time cursor (footer shows the nearest event) |
PgUp / PgDn / A / D |
jump 10 columns |
Home / End / g / G |
window edges |
Tab / Shift-Tab |
switch device |
Enter |
drill into replay at the cursor |
Retention defaults
| granularity | kept for | |
|---|---|---|
| recent past | 10s rollups | 48 hours |
| long tail | 1m rollups | 30 days |
| event log | every event | 30 days |
History lives in your user data directory, resolved per-OS:
default history.db location |
|
|---|---|
| Linux | $XDG_DATA_HOME/gpuviewer → ~/.local/share/gpuviewer |
| macOS | ~/Library/Application Support/gpuviewer |
| Windows | %LOCALAPPDATA%\gpuviewer |
--db overrides it, --no-persist disables recording (which the replay view and report
need). --mock records to history-mock.db and demo to history-demo.db — your real
history is never polluted by simulations, and recording the wrong flavour into a database
is refused before a single row lands. One recorder owns a database at a time (an exclusive
lock on <db>.lock); a second gpuviewer opened by hand runs live-only and says so.
Roadmap
- Windows reads device truth from NVML and per-process VRAM/util from the Windows GPU performance counters — the numbers NVML architecturally cannot see under WDDM, which is where Task Manager misleads. The cross-vendor WDDM backend covers AMD and Intel (and NVIDIA without NVML) over the same counters plus DXGI and D3DKMT.
- macOS Apple Silicon reads device-level telemetry through Metal. Per-process GPU attribution is prohibited by the OS for third-party tools, so the UI says so and blames the OS rather than going quiet.
- Next: an iced GUI on the same core, a Prometheus exporter, multi-host views, and vendor-depth Windows AMD/Intel beyond what the WDDM counters expose.
Deliberately not chasing: fan/OC control (LACT owns it), a daemon/client split ("always-on"
means by virtue of normal use — for boot-time recording, run gpuviewer --json under your
own systemd user unit; an example ships at
docs/packaging/gpuviewer.service), cluster views, and
eBPF causal tracing (we hand off to profilers: "idle gap at 02:14:31 — if recurring,
capture a trace").
License
Licensed under either of
- Apache License, Version 2.0 (LICENSE-APACHE or http://www.apache.org/licenses/LICENSE-2.0)
- MIT license (LICENSE-MIT or http://opensource.org/licenses/MIT)
at your option.
Unless you explicitly state otherwise, any contribution intentionally submitted for inclusion in the work by you, as defined in the Apache-2.0 license, shall be dual licensed as above, without any additional terms or conditions.