Describe the bug
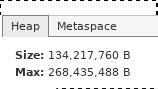
When using G1GC the displayed heap max size is twice as high as it really is.
To Reproduce
echo "public class Memory {
  public static void main(String[] args) throws Exception {
    System.out.println(Runtime.getRuntime().maxMemory());
    Thread.sleep(99999999);
  }
}" > Memory.java
javac Memory.java
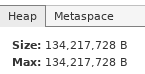
Using the default ParallelGC: run the below, connect with visualvm, numbers are correct:
java -Xmx128m -XX:+UseParallelGC Memory
With G1GC: numbers are twice as high in visualvm (but correct on application stdout):
java -Xmx128m -XX:+UseG1GC Memory
Additional context
Tested with the following jdks:
- oracle 1.8.0_144
- openjdk 1.8.0_202
- openjdk 11.0.1 (zulu11.2.+3 build)