Quick start
- Signup for a Mapbox Account.
- If you already have an account, grab your access token from the account dashboard.

- Install dependencies:
pip install mapboxgl pandas jupyter
- If you are using a hosted jupyter notebook environment, install libraries from Jupyter using the
!command in a cell:!pip install mapboxgl pandas jupyter
- Open a jupyter notebook by calling
jupyter notebookfrom your command prompt or terminal. If your browser does not open automatically, navigate to http://localhost:8888/ in your browser window. - Import
mapboxgl-jupyterinto your notebook:
from mapboxgl.utils import *from mapboxgl.viz import *
- Create a visualization using the examples and documentation below. You'll need your Mapbox token from the first step.
Here is an example workbook
class MapViz
The MapViz class is the parent class of the various mapboxgl-jupyter visualizations. You can use this class to set default values for all visualizations rather than calling them directly from the other visualization objects.
Params
MapViz(data, vector_url=None, vector_layer_name=None, vector_join_property=None, data_join_property=None, disable_data_join=False, access_token=None, center=(0, 0), below_layer='', opacity=1, div_id='map', height='500px', style='mapbox://styles/mapbox/light-v9?optimize=true', label_property=None, label_size=8, label_color='#131516', label_halo_color='white', label_halo_width=1, width='100%', zoom=0, min_zoom=0, max_zoom=24, pitch=0, bearing=0, box_zoom_on=True, double_click_zoom_on=True, scroll_zoom_on=True, touch_zoom_on=True, legend=True, legend_layout='vertical', legend_function='color', legend_gradient=False, legend_style='', legend_fill='white', legend_header_fill='white', legend_text_color='#6e6e6e', legend_text_numeric_precision=None, legend_title_halo_color='white', legend_key_shape='square', legend_key_borders_on=True, scale=False, scale_unit_system='metric', scale_position='bottom-left', scale_border_color='#6e6e6e', scale_background_color='white', scale_text_color='#131516', popup_open_action='hover', add_snapshot_links=False)
| Parameter | Description | Example |
|---|---|---|
| data | GeoJSON Feature Collection or JSON Join-Data | 'points.geojson' |
| vector_url | optional property to define vector data source (supported for basic MapViz, CircleViz, GraduatedCircleViz, HeatmapViz, ChoroplethViz, LinestringViz) | 'mapbox://mapbox.mapbox-terrain-v2' |
| vector_layer_name | property to define target layer of vector source | 'contour' |
| vector_join_property | property of features in vector tile data to use as link to joined json data | 'ele' |
| data_join_property | property of json data to use as link to vector features | 'elevation' |
| disable_data_join | optional property to switch off default data-join technique using vector layer and JSON join-data; also determines if a layer filter based on joined data is applied to features in vector layer | False |
| access_token | Mapbox GL JS access token. | 'pk.abc123' |
| center | map center point | (-95, 40) |
| below_layer | specify the layer under which to put current data layer | 'waterway-label' |
| style | url to mapbox style or stylesheet as a Python dictionary in JSON format | 'mapbox://styles/mapbox/light-v9?optimize=true' |
| div_id | The HTML div id of the map container in the viz | 'map' |
| width | The CSS width of the HTML div id in % or pixels. | '100%' |
| height | The CSS height of the HTML map div in % or pixels. | '300px' |
| zoom | starting zoom level for map | 3 |
| min_zoom | min zoom level for displaying data layer on map | 0 |
| max_zoom | max zoom level for displaying data layer on map | 24 |
| opacity | opacity of map data layer | 0.75 |
| pitch | starting pitch (in degrees) for map | 0 |
| bearing | starting bearing (in degrees) for map | 0 |
| box_zoom_on | boolean indicating if map can be zoomed to a region by dragging a bounding box | True |
| double_click_zoom_on | boolean indicating if map can be zoomed with double-click | True |
| scroll_zoom_on | boolean indicating if map can be zoomed with the scroll wheel | True |
| scroll_wheel_zoom_on | boolean indicating if map can be zoomed with the scroll wheel | True |
| touch_zoom_on | boolean indicating if map can be zoomed with two-finger touch gestures | True |
| label_property | property to use for marker label. No labels will be shown if omitted | None |
| label_size | size of text labels | 8 |
| label_color | color of text labels | '#131516' |
| label_halo_color | color of text halo outline | 'white' |
| label_halo_width | width (in pixels) of text halo outline | 1 |
| legend | controls visibility of map legend | True |
| legend_layout | controls orientation of map legend | 'horizontal' |
| legend_function | controls whether legend is color or radius-based | 'color' |
| legend_style | reserved for future custom CSS loading | '' |
| legend_gradient | boolean to determine appearance of legend keys; takes precedent over legend_key_shape | False |
| legend_fill | string background color for legend | 'white' |
| legend_header_fill | string background color for legend header (in vertical layout) | 'white' |
| legend_text_color | string color for legend text | '#6e6e6e' |
| legend_text_numeric_precision | decimal precision for numeric legend values | 0 |
| legend_title_halo_color | color of legend title text halo | 'white' |
| legend_key_shape | shape of the legend item keys, default varies by viz type; one of square, contiguous_bar, rounded-square, circle, line | 'square' |
| legend_key_borders_on | boolean for whether to show/hide legend key borders | True |
| scale | boolean controlling visibility of map control scale bar | False |
| scale_unit_system | choose units for scale display ( one of 'metric', 'nautical' or 'imperial') | 'metric' |
| scale_position | location of the scale annotation | 'bottom-left' |
| scale_border_color | border color of the scale annotation | '#eee' |
| scale_background_color | fill color of the scale annotation | 'white' |
| scale_text_color | text color the scale annotation | '#6e6e6e' |
| popup_open_action | setting for popup behavior; one of 'hover' or 'click' | 'hover' |
| add_snapshot_links | boolean switch for adding buttons to download screen captures of map or legend | False |
Methods
as_iframe(self, html_data)
Return the MapViz HTML representation in an iframe container using the srcdoc iframe attribute.
show(self, **kwargs)
Display the visual in an iframe result cell of a Jupyter Notebook.
create_html(self)
Build the HTML text representation of the visual. The output of this is a valid HTML document containing the visual object.
class VectorMixin
The VectorMixin class is a parent class of the various mapboxgl-jupyter visualizations supporting vector source data that provides methods for developing the vector color, weight, height, line-width or intensity mapping for use with the data-join technique. CircleViz, GraduatedCircleViz, HeatmapViz, ChoroplethViz, and LinestringViz support using a vector data source.
Methods
generate_vector_color_map(self)
Generate color stops array for use with match expression in mapbox template.
generate_vector_numeric_map(self, numeric_property)
Generate stops array for use with match expression in mapbox template.
check_vector_template(self)
Determines if features are defined as vector source based on MapViz arguments.
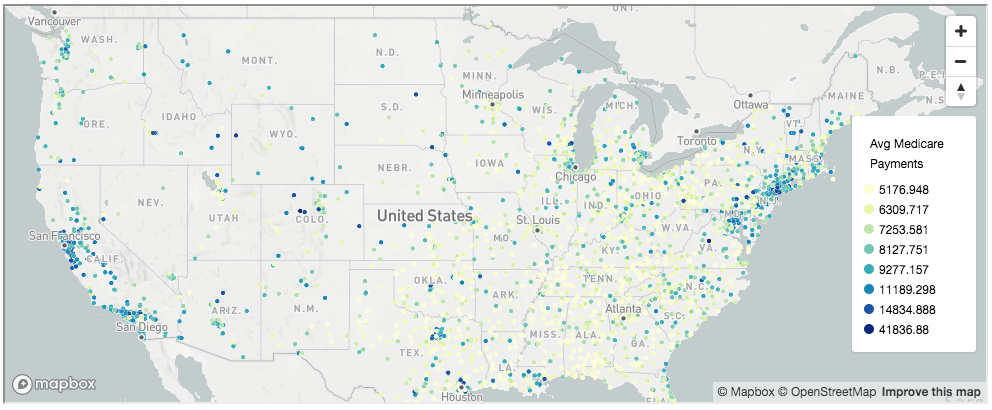
class CircleViz
The CircleViz class handles the creation of a circle map and is built on top of the MapViz class.
Params
CircleViz(data, radius=1, color_property=None, color_stops=None, color_default='grey', color_function_type='interpolate', stroke_color='grey', stroke_width=0.1, *args, **kwargs)
| Parameter | Description |
|---|---|
| data | name of GeoJson file or object or JSON join-data |
| color_property | property to determine circle color |
| color_stops | property to determine circle color |
| color_default | color of circle to use if no lookup value matches the property value. Only used for the match color_function_type. |
| color_function_type | property to determine type used by Mapbox to assign color. One of 'interpolate' or 'match'. Default is interpolate |
| stroke_color | color of circle outline stroke |
| stroke_width | width (in pixels) of circle outline stroke |
Usage
import pandas as pd
import os
from mapboxgl.utils import *
from mapboxgl.viz import *
# Load data from sample csv
data_url = 'https://raw.githubusercontent.com/mapbox/mapboxgl-jupyter/master/examples/points.csv'
df = pd.read_csv(data_url)
# Must be a public token, starting with `pk`
token = os.getenv('MAPBOX_ACCESS_TOKEN')
# Create a geojson Feature Collection export from a Pandas dataframe
points = df_to_geojson(df,
                       properties=['Avg Medicare Payments', 'Avg Covered Charges', 'date'],
                       lat='lat', lon='lon', precision=3)
# Generate data breaks and color stops from colorBrewer
color_breaks = [0,10,100,1000,10000]
color_stops = create_color_stops(color_breaks, colors='YlGnBu')
# Create the viz from the dataframe
viz = CircleViz(points,
                access_token=token,
                height='400px',
                color_property='Avg Medicare Payments',
                color_stops=color_stops,
                label_property='Avg Medicare Payments',
                stroke_color='black',
                center=(-95, 40),
                zoom=3,
                below_layer='waterway-label')
viz.show()
class ClusteredCircleViz
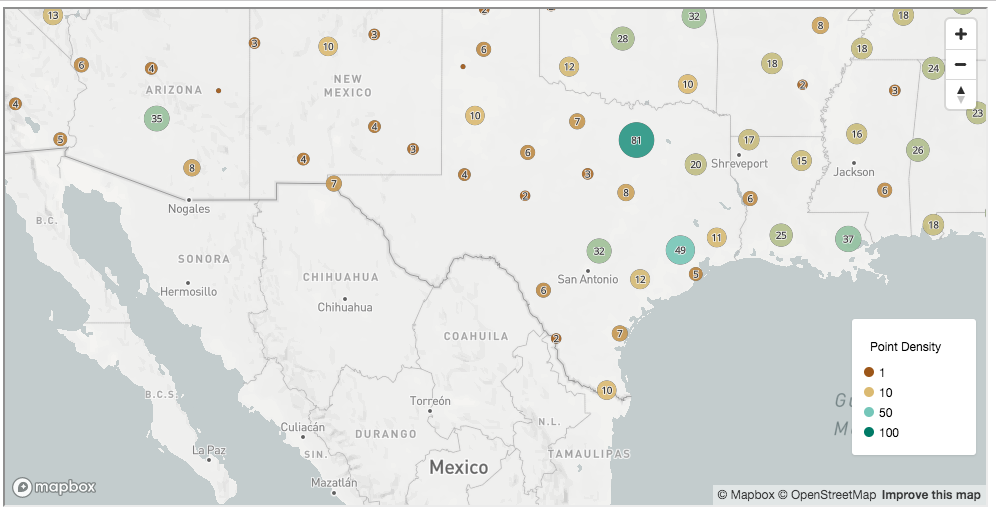
The ClusteredCircleViz object handles the creation of a clustered circle map and is built on top of the MapViz class. Cluster radius and color are keyed on point density. Vector data source is not supported for ClusteredCircleViz.
Params
ClusteredCircleViz(data, color_stops=None, radius_stops=None, cluster_radius=30, cluster_maxzoom=14, radius_default=2, color_default='black', stroke_color='grey', stroke_width=0.1, *args, **kwargs)
| Parameter | Description |
|---|---|
| data | name of GeoJson file or object |
| color_stops | property to determine circle color |
| radius_stops | property to determine circle radius |
| cluster_radius | property to determine radius of each cluster when clustering points |
| cluster_maxzoom | property to determine the max zoom to use for clustering points |
| radius_default | Radius of points not contained in a cluster |
| color_default | Color of points not contained in a cluster |
| stroke_color | Color of stroke outline on circles |
| stroke_width | Width of stroke outline on circles |
Usage
import pandas as pd
import os
from mapboxgl.utils import *
from mapboxgl.viz import *
# Load data from sample csv
data_url = 'https://raw.githubusercontent.com/mapbox/mapboxgl-jupyter/master/examples/points.csv'
df = pd.read_csv(data_url)
# Must be a public token, starting with `pk`
token = os.getenv('MAPBOX_ACCESS_TOKEN')
# Create a geojson Feature Collection export from a Pandas dataframe
points = df_to_geojson(df,
                       properties=['Avg Medicare Payments', 'Avg Covered Charges', 'date'],
                       lat='lat', lon='lon', precision=3)
#Create a clustered circle map
color_stops = create_color_stops([1,10,50,100], colors='BrBG')
viz = ClusteredCircleViz(points,
                         access_token=token,
                         color_stops=color_stops,
                         radius_stops=[[1,5], [10, 10], [50, 15], [100, 20]],
                         radius_default=2,
                         cluster_maxzoom=10,
                         cluster_radius=30,
                         label_size=12,
                         opacity=0.9,
                         center=(-95, 40),
                         zoom=3)
viz.show()
class GraduatedCircleViz
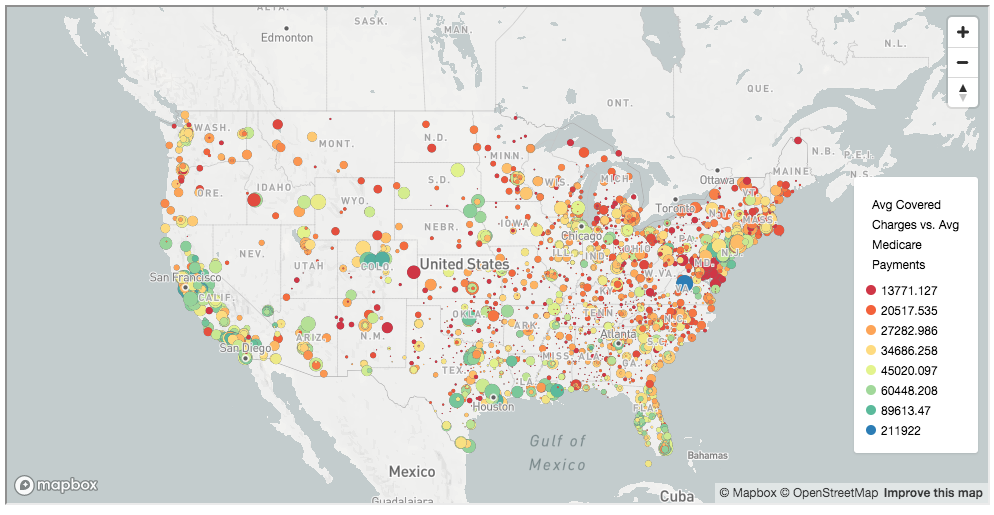
The GraduatedCircleViz object handles the creation of a graduated map and is built on top of the MapViz class.
Params
GraduatedCircleViz(data, color_property=None, color_stops=None, color_default='grey', color_function_type='interpolate', stroke_color='grey', stroke_width=0.1, radius_property=None, radius_stops=None, radius_default=2, radius_function_type='interpolate', *args, **kwargs)
| Parameter | Description |
|---|---|
| data | name of GeoJson file or object or JSON join-data |
| color_property | property to determine circle color. |
| color_stops | property to determine circle color. |
| color_default | color of the circle to use if no lookup value matches the property value. Only used for the match color_function_type. |
| color_function_type | property to determine type used by Mapbox to assign color. One of "interpolate" or "match". Default is interpolate. |
| radius_property | property to determine circle radius. |
| radius_stops | property to determine circle radius. |
| radius_default | radius of the circle to use if no lookup value matches the property value. Only used for the match radius_function_type. |
| radius_function_type | property to determine type used by Mapbox to assign radius size. One of "interpolate" or "match". Default is interpolate. |
| stroke_color | Color of stroke outline on circles |
| stroke_width | Width of stroke outline on circles |
Usage
import pandas as pd
import os
from mapboxgl.utils import *
from mapboxgl.viz import *
# Load data from sample csv
data_url = 'https://raw.githubusercontent.com/mapbox/mapboxgl-jupyter/master/examples/points.csv'
df = pd.read_csv(data_url)
# Must be a public token, starting with `pk`
token = os.getenv('MAPBOX_ACCESS_TOKEN')
# Create a geojson Feature Collection export from a Pandas dataframe
points = df_to_geojson(df,
                       properties=['Avg Medicare Payments', 'Avg Covered Charges', 'date'],
                       lat='lat', lon='lon', precision=3)
# Generate color stops from colorBrewer
measure_color = 'Avg Covered Charges'
color_breaks = [round(df[measure_color].quantile(q=x*0.1), 2) for x in range(2, 10)]
color_stops = create_color_stops(color_breaks, colors='Blues')
# Generate radius breaks from data domain and circle-radius range
measure_radius = 'Avg Medicare Payments'
radius_breaks = [round(df[measure_radius].quantile(q=x*0.1), 2) for x in range(2,10)]
radius_stops = create_radius_stops(radius_breaks, 0.5, 10)
# Create the viz
viz = GraduatedCircleViz(points,
                         access_token=token,
                         color_property='Avg Covered Charges',
                         color_stops=color_stops,
                         radius_property='Avg Medicare Payments',
                         stroke_color='black',
                         stroke_width=0.5,
                         radius_stops=radius_stops,
                         center=(-95, 40),
                         zoom=3,
                         below_layer='waterway-label')
viz.show()
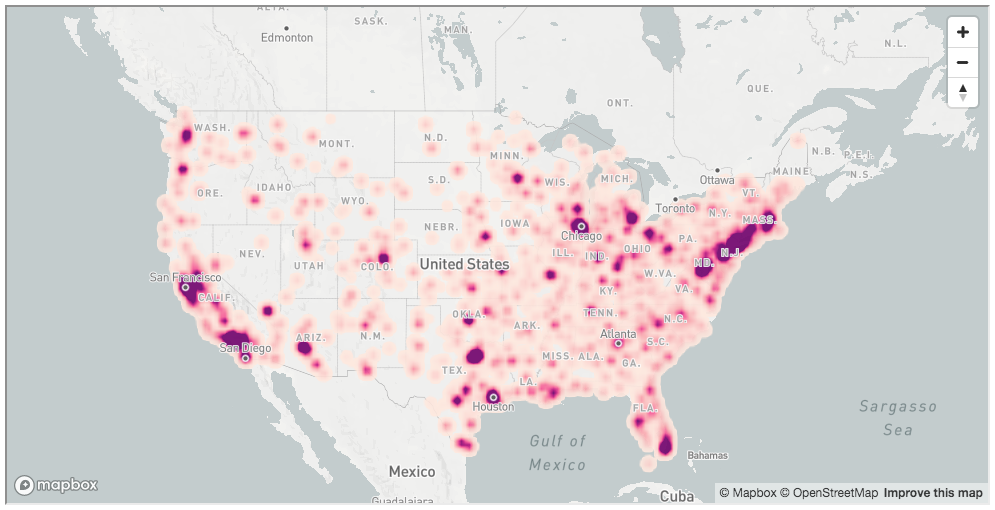
class HeatmapViz
The HeatmapViz object handles the creation of a heat map and is built on top of the MapViz class.
Params
HeatmapViz(data, weight_property=None, weight_stops=None, color_stops=None, radius_stops=None, intensity_stops=None, legend=False, *args, **kwargs)
| Parameter | Description | Example |
|---|---|---|
| data | name of GeoJson file or object or JSON join-data | |
| weight_property | property to determine heatmap weight. | "population" |
| weight_stops | stops to determine heatmap weight. | [[10, 0], [100, 1]] |
| color_stops | stops to determine heatmap color. | [[0, "red"], [0.5, "blue"], [1, "green"]] |
| radius_stops | stops to determine heatmap radius based on zoom. | [[0, 1], [12, 30]] |
| intensity_stops | stops to determine the heatmap intensity based on zoom. | [[0, 0.1], [20, 5]] |
| legend | defaults to no legend for HeatmapViz | False |
Usage
import pandas as pd
import os
from mapboxgl.utils import *
from mapboxgl.viz import *
# Load data from sample csv
data_url = 'https://raw.githubusercontent.com/mapbox/mapboxgl-jupyter/master/examples/points.csv'
df = pd.read_csv(data_url)
# Must be a public token, starting with `pk`
token = os.getenv('MAPBOX_ACCESS_TOKEN')
# Create a geojson Feature Collection export from a Pandas dataframe
points = df_to_geojson(df,
                       properties=['Avg Medicare Payments', 'Avg Covered Charges', 'date'],
                       lat='lat', lon='lon', precision=3)
#Create a heatmap
heatmap_color_stops = create_color_stops([0.01,0.25,0.5,0.75,1], colors='RdPu')
heatmap_radius_stops = [[0,1], [15, 40]] #increase radius with zoom
color_breaks = [0,10,100,1000,10000]
color_stops = create_color_stops(color_breaks, colors='Spectral')
heatmap_weight_stops = create_weight_stops(color_breaks)
#Create a heatmap
viz = HeatmapViz(points,
                 access_token=token,
                 weight_property='Avg Medicare Payments',
                 weight_stops=heatmap_weight_stops,
                 color_stops=heatmap_color_stops,
                 radius_stops=heatmap_radius_stops,
                 opacity=0.9,
                 center=(-95, 40),
                 zoom=3,
                 below_layer='waterway-label')
viz.show()
class ChoroplethViz
The ChoroplethViz object handles the creation of a choropleth map and inherits from the MapViz class. It applies a thematic map style to polygon features with color shading in proportion to the intensity of the data being displayed. Choropleth polygons can be initialized with geojson source or vector source styled using the data-join technique.
Params
ChoroplethViz(data, color_property=None, color_stops=None, color_default='grey', color_function_type='interpolate', line_color='white', line_stroke='solid', line_width=1, line_opacity=1, height_property=None, height_stops=None, height_default=0.0, height_function_type='interpolate', *args, **kwargs)
| Parameter | Description | Example |
|---|---|---|
| data | can be either GeoJSON (containing polygon features) or JSON for data-join technique with vector polygons | 'us-states.geojson' |
| label_property | property to use for marker label | 'density' |
| color_property | property to determine fill color | 'density' |
| color_stops | property to determine fill color | [[0, 'red'], [0.5, 'blue'], [1, 'green']] |
| color_default | property to determine default fill color in match lookups | '#F0F0F0' |
| color_function_type | property to determine type of expression used by Mapbox to assign color | 'interpolate' |
| line_color | property to determine choropleth border line color | '#FFFFFF' |
| line_stroke | property to determine choropleth border line stroke (one of solid (-), dashed (--), dotted (:), dash dot (-.)) | 'solid' or '-' |
| line_width | property to determine choropleth border line width | 1 |
| line_opacity | opacity of choropleth line layer | 1 |
| height_property | feature property for determining polygon height in 3D extruded choropleth map | 'density' |
| height_stops | property for determining 3D extrusion height | [[0, 0], [500, 50000], [1500, 150000]] |
| height_default | default height (in meters) for 3D extruded polygons on map | 1500.0 |
| height_function_type | property to determine type used by Mapbox to assign height |
'interpolate' |
Usage
import os
from mapboxgl.viz import *
from mapboxgl.utils import *
# Must be a public token, starting with `pk`
token = os.getenv('MAPBOX_ACCESS_TOKEN')
# Create Choropleth with GeoJSON Source
viz = ChoroplethViz('https://raw.githubusercontent.com/mapbox/mapboxgl-jupyter/master/examples/data/us-states.geojson',
                     color_property='density',
                     color_stops=create_color_stops([0, 50, 100, 500, 1500], colors='YlOrRd'),
                     color_function_type='interpolate',
                     line_stroke='--',
                     line_color='rgb(128,0,38)',
                     line_width=1,
                     line_opacity=0.9,
                     opacity=0.8,
                     center=(-96, 37.8),
                     zoom=3,
                     below_layer='waterway-label')
viz.show()

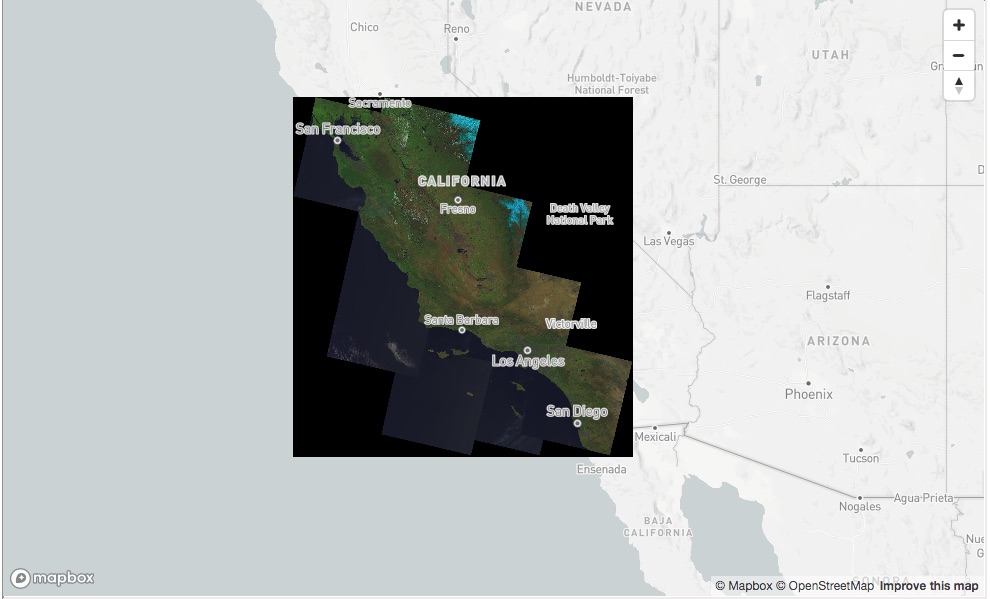
class ImageViz
The ImageViz object handles the creation of a simple image visualization on map and is built on top of the MapViz class.
Params
ImageViz(image, coordinates, legend=False, *args, **kwargs_)
| Parameter | Description | Example |
|---|---|---|
| image | image url, path or numpy ndarray | './my_image.png' |
| coordinates | property to image coordinates (UL, UR, LR, LL) | [[-80.425, 46.437], [-71.516, 46.437], [-71.516, 37.936], [-80.425, 37.936]] |
| legend | no legend for ImageViz | False |
Usage
from mapboxgl.viz import ImageViz
img_url = 'https://raw.githubusercontent.com/mapbox/mapboxgl-jupyter/master/examples/mosaic.jpg'
# Coordinates must be an array in the form of [UL, UR, LR, LL]
coordinates = [[-123.40515640309, 38.534294809274336],
               [-115.92938988349292, 38.534294809274336],
               [-115.92938988349292, 32.08296982365502],
               [-123.40515640309, 32.08296982365502]]
# Create the viz
viz = ImageViz(img_url, coordinates, access_token=token,
               height='600px',
               center=(-119, 35),
               zoom=5,
               below_layer='waterway-label')
viz.show()
class RasterTilesViz
The RasterTilesViz object handles the creation of a simple raster tiles visualization on map and is built on top of the MapViz class.
Params
RasterTilesViz(tiles_url, legend=False, *args, **kwargs)
| Parameter | Description | Example |
|---|---|---|
| tiles_url | tiles endpoint | 'https://a.tile.openstreetmap.org/{z}/{x}/{y}.png' |
| tiles_size | mapbox-gl tiles size | 256 |
| tiles_bounds | tiles endpoint bounds | [124.97480681619507, 10.876763902260592, 124.99391704636035, 10.888369402219947] |
| tiles_minzoom | tiles endpoint min zoom | 0 |
| tiles_maxzoom | tiles endpoint max zoom | 22 |
| legend | no legend for RasterTilesViz | False |
Usage
Bring your own raster
Using rio-glui python module, you can create a local tiles server to explore your own file.
Note: Your raster file has to be a cloud optimized geotiff (see cogeo.org or rio-cogeo).
from rio_glui.server import TileServer
from rio_glui.raster import RasterTiles
from mapboxgl.viz import RasterTilesViz
file = 'myfile.tif'
# Create raster tile object
# More info: https://github.com/mapbox/rio-glui/blob/master/rio_glui/raster.py#L16-L44
raster = RasterTiles(file, indexes=(2,1,3))
# Create local tile server
# More info: https://github.com/mapbox/rio-glui/blob/master/rio_glui/server.py#L21-L56
ts = TileServer(raster)
# Start tile server
ts.start()
# Initialize RasterTiles Viz by passing our local tile server url `ts.get_tiles_url`
viz = RasterTilesViz(ts.get_tiles_url(),
                     tiles_bounds=ts.get_bounds(),
                     center=ts.get_center(),
                     height='1000px',
                     zoom=13)
viz.show()
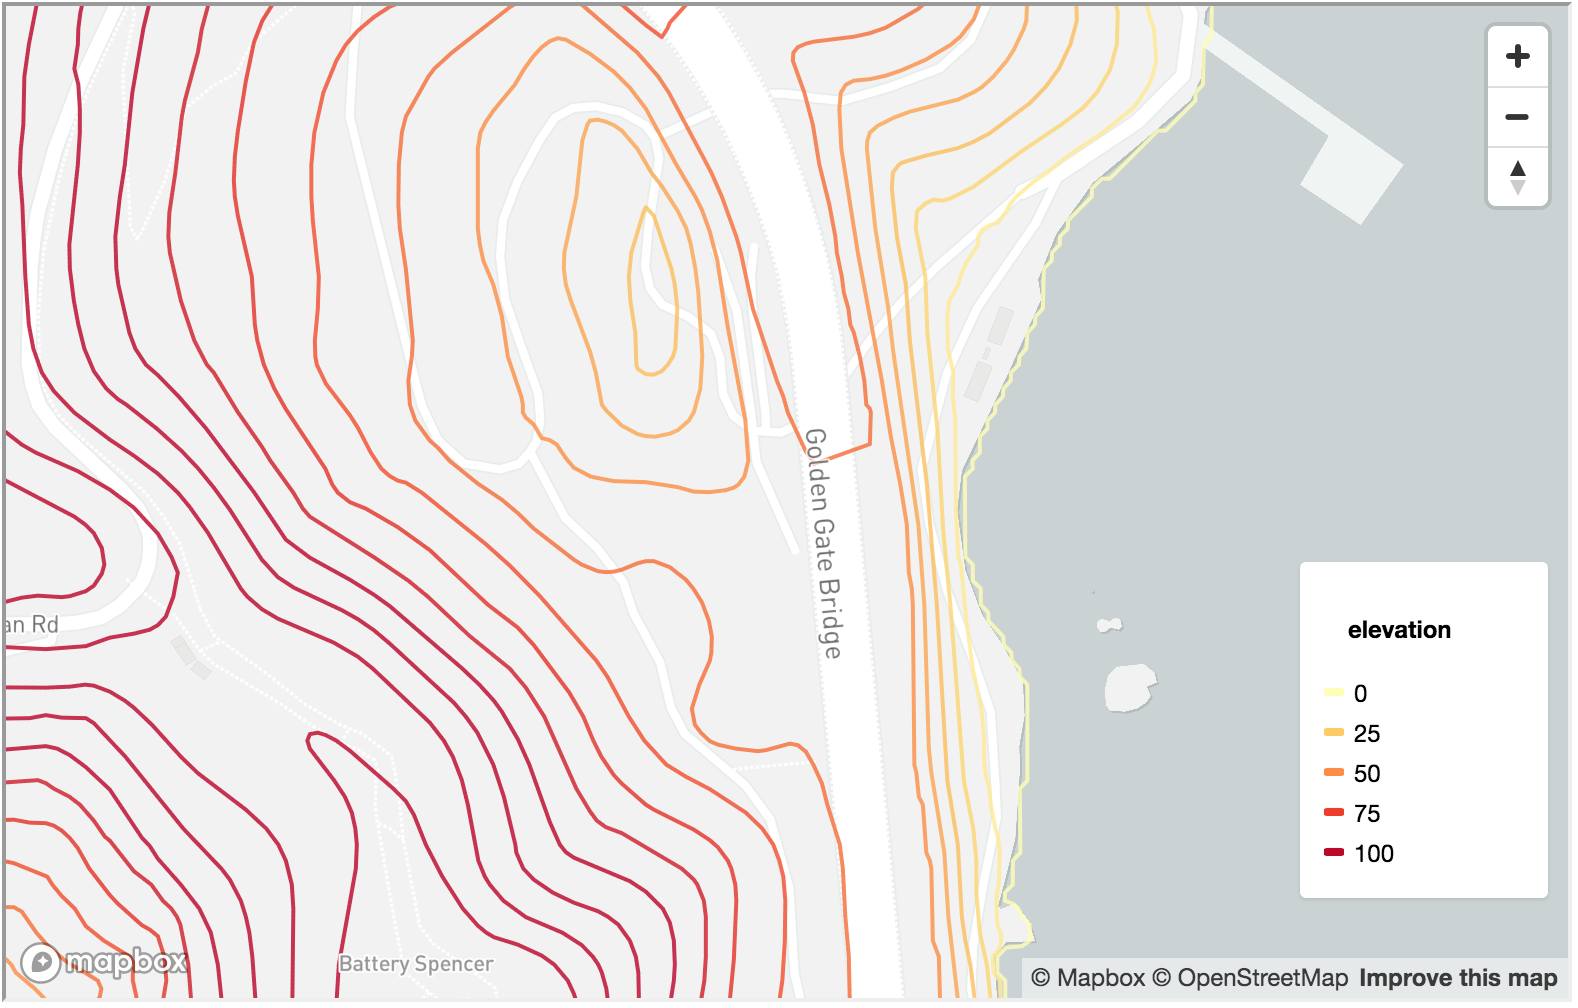
class LinestringViz
The LinestringViz object handles the creation of a vector or GeoJSON-based Linestring visualization and inherits from the MapViz class.
Params
LinestringViz(data, color_property=None, color_stops=None, color_default='grey', color_function_type='interpolate', line_stroke='solid', line_width_property=None, line_width_stops=None, line_width_default=1, line_width_function_type='interpolate', *args, **kwargs)
| Parameter | Description | Example |
|---|---|---|
| data | can be either GeoJSON (containing polygon features) or JSON for data-join technique with vector polygons | |
| color_property | property to determine line color | 'elevation' |
| color_stops | property to determine line color | [[0, 'red'], [0.5, 'blue'], [1, 'green']] |
| color_default | property to determine default line color if match lookup fails | '#F0F0F0' |
| color_function_type | property to determine type of expression used by Mapbox to assign color | 'interpolate' |
| line_stroke | property to determine line stroke (one of solid (-), dashed (--), dotted (:), dash dot (-.)) | 'solid' or '-' |
| line_width_property | feature property for determining line width | 'elevation' |
| line_width_stops | property to determine line width | [[0, 1], [50000, 2], [150000, 3]] |
| line_width_default | property to determine default line width if match lookup fails | 1.0 |
| line_width_function_type | property to determine type used by Mapbox to assign line width |
'interpolate' |
Usage
import random
import os
from mapboxgl.viz import LinestringViz
from mapboxgl.utils import create_color_stops
# Must be a public token, starting with `pk`
token = os.getenv('MAPBOX_ACCESS_TOKEN')
# JSON join-data object
data = [{"elevation": x, "weight": random.randint(0,100)} for x in range(0, 21000, 10)]
viz = LinestringViz(data,
                    vector_url='mapbox://mapbox.mapbox-terrain-v2',
                    vector_layer_name='contour',
                    vector_join_property='ele',
                    data_join_property='elevation',
                    color_property='elevation',
                    color_stops=create_color_stops([0, 25, 50, 75, 100], colors='YlOrRd'),
                    line_stroke='-',
                    line_width_default=2,
                    opacity=0.8,
                    center=(-122.48, 37.83),
                    zoom=16,
                    below_layer='waterway-label')
viz.show()