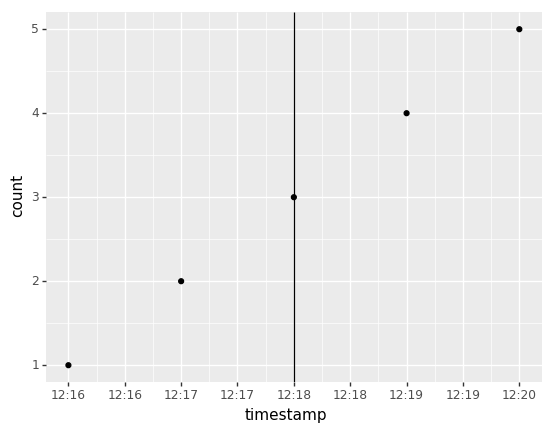
Here's an example that should show a vertical line through the third point, but doesn't:
import pandas as pd
from plotnine import *
from mizani.formatters import *
entries = [{"timestamp": pd.Timestamp("2017-11-30 12:16"), "count": 1},
           {"timestamp": pd.Timestamp("2017-11-30 12:17"), "count": 2},
           {"timestamp": pd.Timestamp("2017-11-30 12:18"), "count": 3},
           {"timestamp": pd.Timestamp("2017-11-30 12:19"), "count": 4},
           {"timestamp": pd.Timestamp("2017-11-30 12:20"), "count": 5}]
data = pd.DataFrame(entries)
ggplot(aes(x="timestamp", y="count"), data=data) + \
    geom_point() + \
    geom_vline(xintercept=data.timestamp[2]) + \
    scale_x_datetime(labels=date_format("%H:%M"))
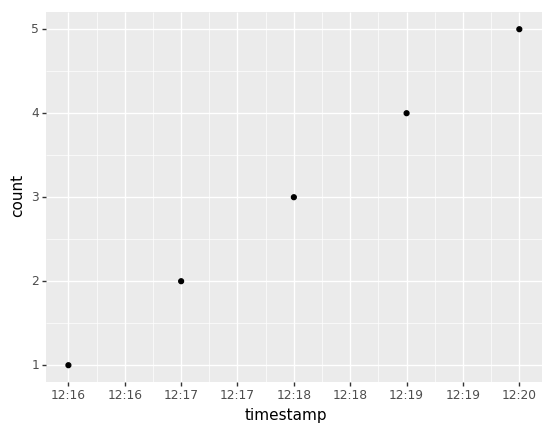
Calling matplotlib.dates.date2num on the xintercept parameter works around this issue right now:
from matplotlib.dates import date2num
... + geom_vline(xintercept=date2num(data.timestamp[2])) + ...