Hello!
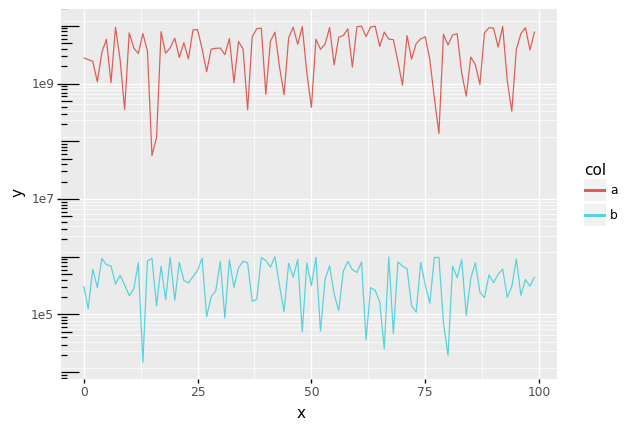
I noticed that logticks were missing in some of my plots and figured out that it happens when the aesthetics are mapped within a geom and not in the main call to ggplot(). I often define some empty base plots and then add geoms with different data mappings. So I was wondering if this is the intended behaviour of annotate_logticks()? And I thought I'd leave a workaround in case somebody else comes across this.
Here is a minimal code example to reproduce what I am talking about:
import numpy as np
import plotnine as p9
import pandas as pd
# random numbers in different orders of magnitude
measure1 = np.random.randint(low=1e6, high=1e10, size=100)
measure2 = np.random.randint(low=0, high=1e6, size=100)
y = np.concatenate([measure1, measure2])
# an index for the x axis
x = np.arange(100)
x = np.tile(x, 2)
# factor for the lower and higher numbers
col = np.array(["a", "b"])
col = np.repeat(col, 100)
# combine to dataframe
df = pd.DataFrame(data={"y": y, "x": x, "col": col})
logticks = (p9.ggplot(data=df, mapping=p9.aes(x="x", y="y", color="col")) +
            p9.geom_line() +
            p9.scale_y_log10() +
            p9.annotation_logticks(sides='l'))
no_logticks = (p9.ggplot() +
               p9.geom_line(data=df, mapping=p9.aes(x="x", y="y", color="col")) +
               p9.scale_y_log10() +
               p9.annotation_logticks(sides='l'))
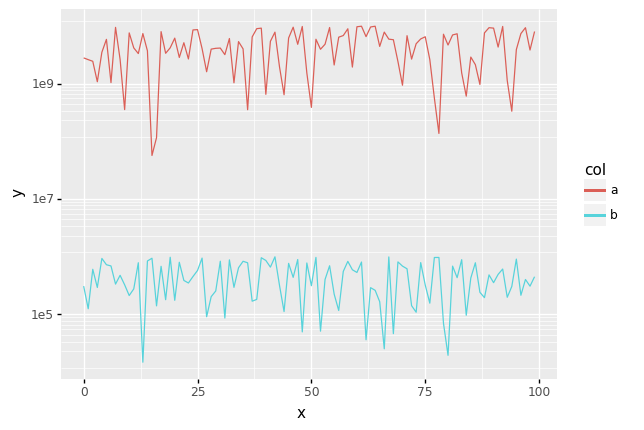
To recover logticks when aesthetics are defined in a geom, we can just add an (almost) empty dataframe to the ggplot() call:
empty_df = pd.DataFrame(data={"junk": [0]})
recovered_logticks = (p9.ggplot(data=empty_df) +
               p9.geom_line(data=df, mapping=p9.aes(x="x", y="y", color="col")) +
               p9.scale_y_log10() +
               p9.annotation_logticks(sides='l'))
Thanks very much for the awesome package!