This package allows users to create, visualize, and evaluate regression trees and random forests for longitudinal or functional data through a spline projection method first suggested by Yu and Lambert (1999).
Installation
You can install splinetree from CRAN or from github with:
# install.packages("devtools")
devtools::install_github("anna-neufeld/splinetree")
Usage
Detailed information on using this package can be found in the package vignettes. The package vignettes can be accessed with:
browseVignettes(package='splinetree')
The vignettes are also available on the package website, https://anna-neufeld.github.io/splinetree/reference/index.html.
Example Tree
library(splinetree)
#> Loading required package: rpart
#> Loading required package: nlme
#> Loading required package: splines
tree1 <- splineTree(~HISP+WHITE+BLACK+HGC_MOTHER+HGC_FATHER+SEX+Num_sibs,
        BMI ~ AGE, "ID", nlsySample, degree = 1, df=2, intercept = FALSE, cp = 0.005)
stPrint(tree1)
#> n= 1000,
#>
#> node), split, n , coefficients
#>       * denotes terminal node
#>
#> 1) root, 1000,  (4.961796, 8.091247)
#>   2) WHITE< 0.5, 505,  (5.882807, 9.006190)*
#>   3) WHITE>=0.5, 495,  (4.022179, 7.157821)
#>     6) HGC_FATHER< 8.5, 78,  (5.198284, 8.642817)*
#>     7) HGC_FATHER>=8.5, 417,  (3.802188, 6.880053)*
stPlot(tree)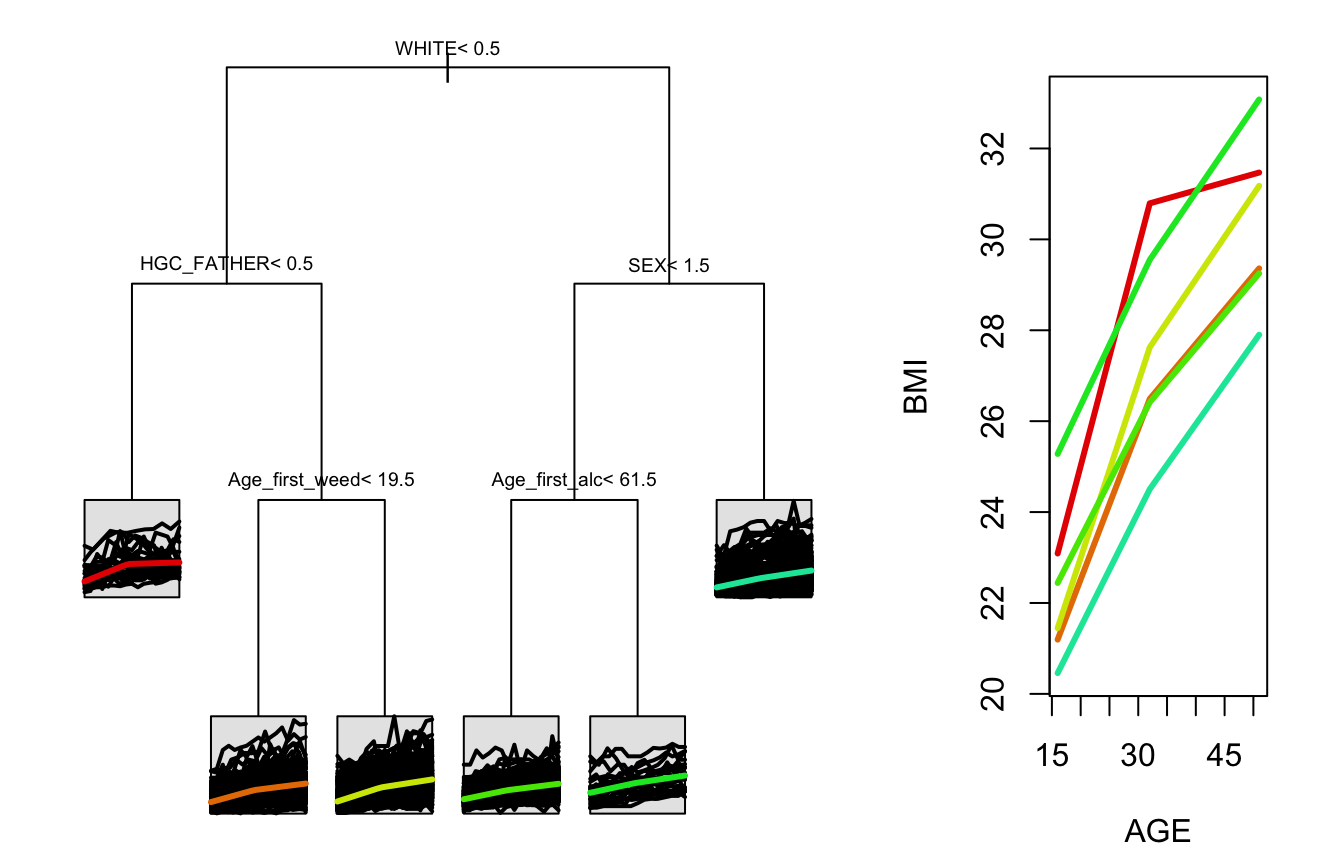
Example Forest
set.seed(1234)
forest1 <- splineForest(~HISP+WHITE+BLACK+HGC_MOTHER+HGC_FATHER+SEX+Num_sibs,
        BMI ~ AGE, "ID", nlsySample, degree = 1, df=2, intercept = FALSE, ntree=50, prob=1/2)
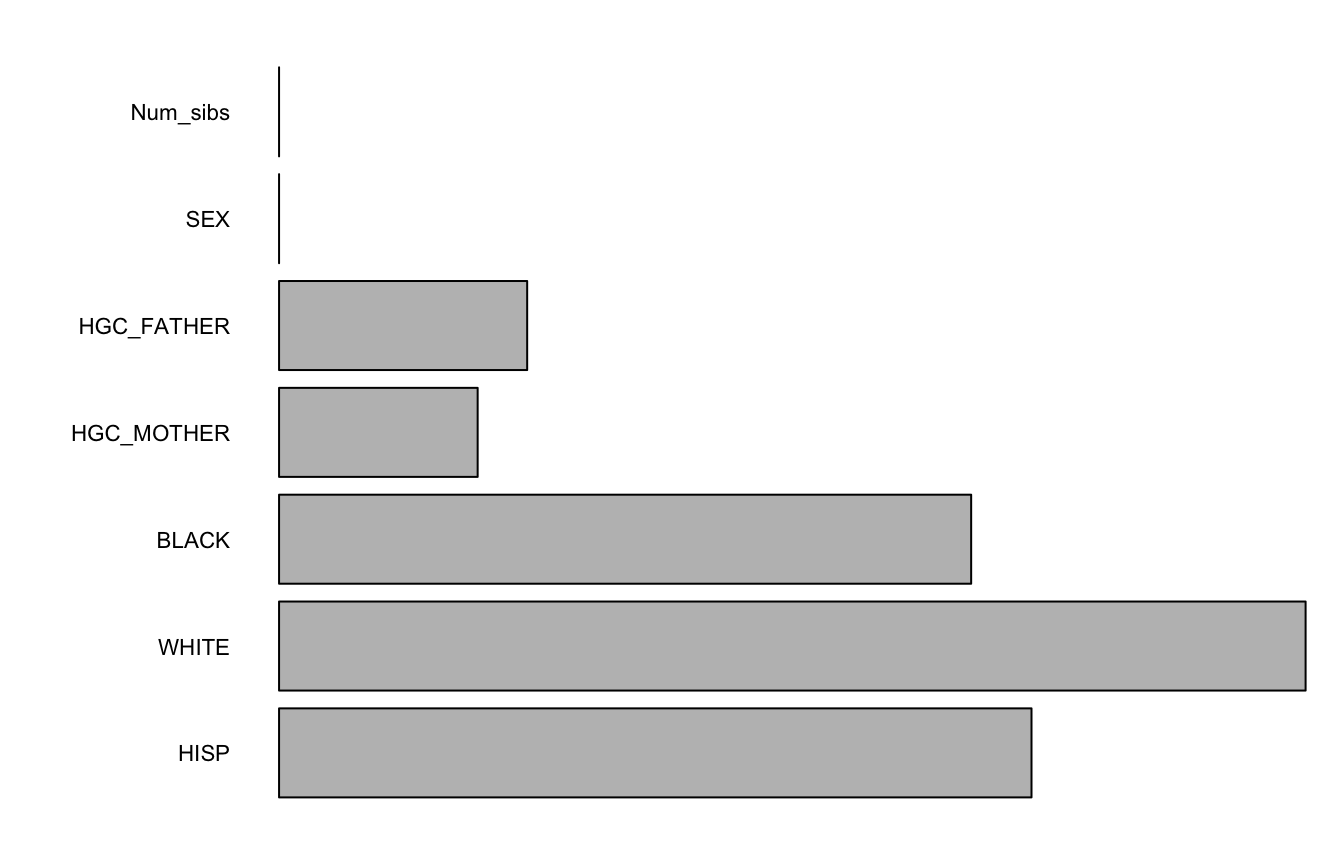
varImps <- varImpCoeff(forest1)
plotImp(varImps[,3])