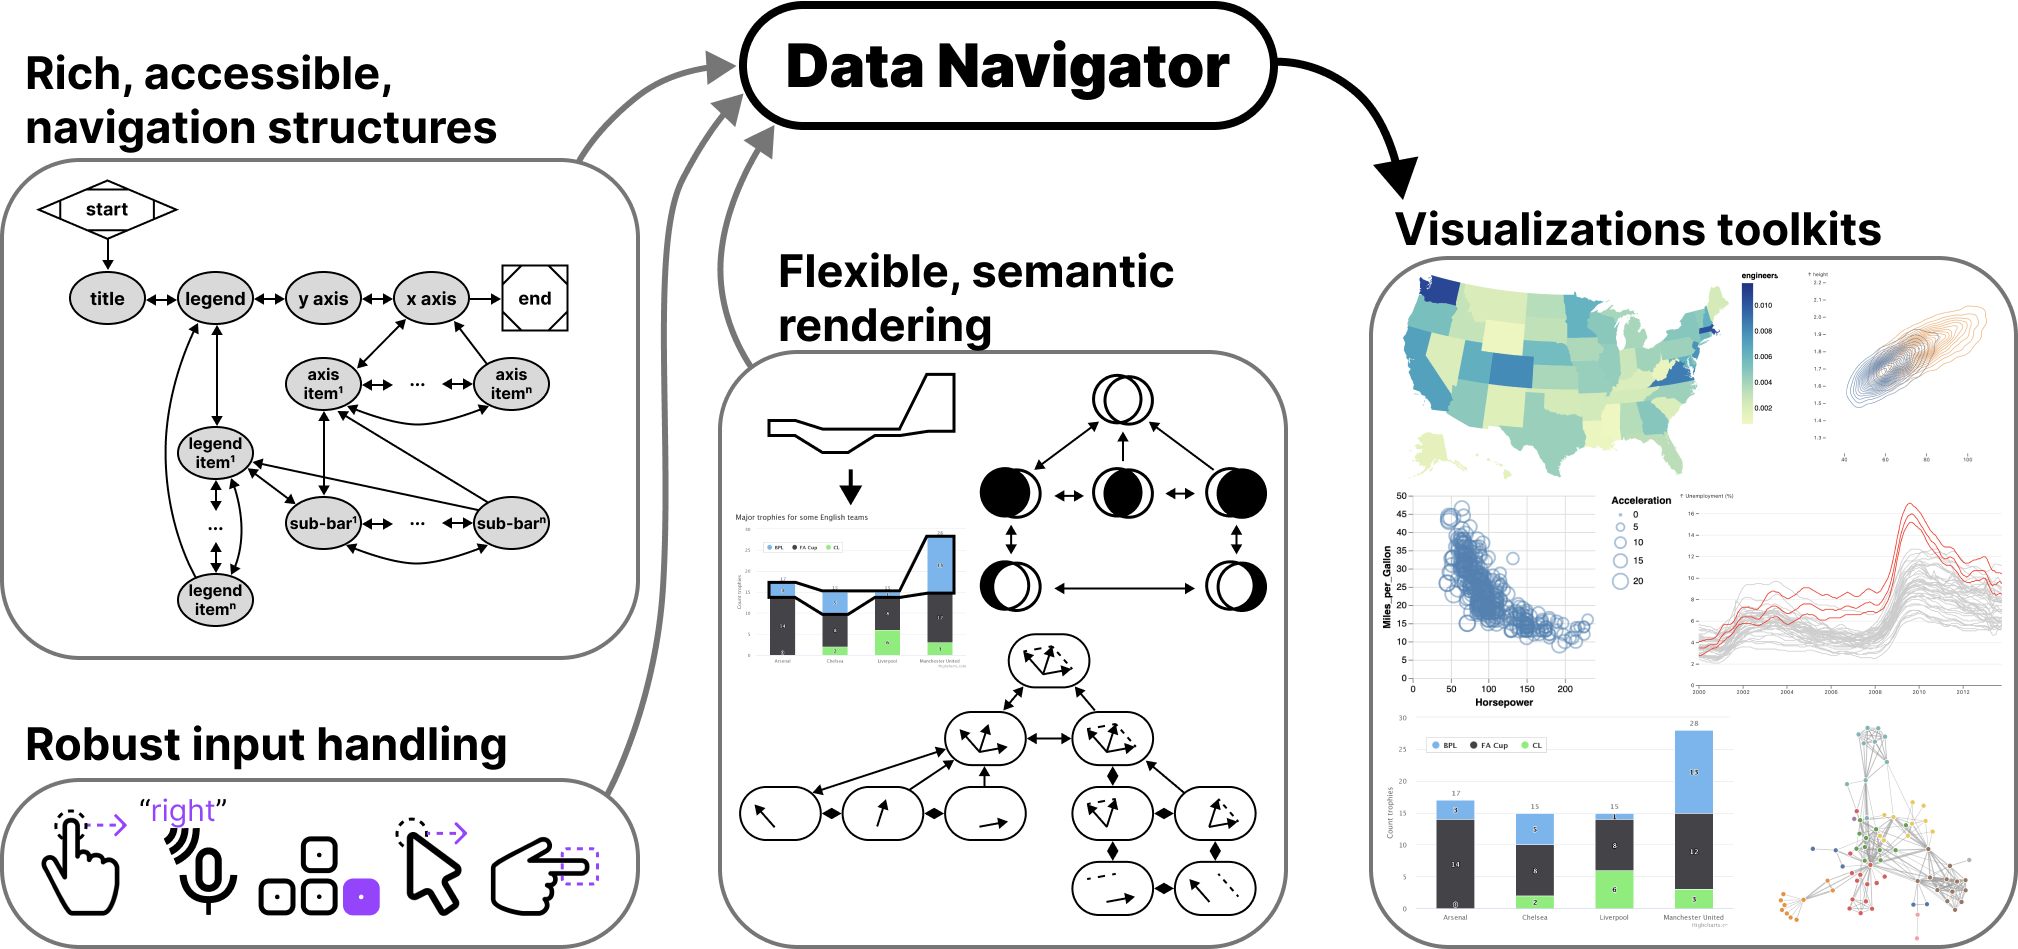
Data Navigator is a JavaScript library that enables keyboard, screen reader, and multi-modal navigation of data structures and visualizations. It works with any rendering technology — SVG, Canvas, images, or WebGL — by creating a semantic, accessible HTML layer on top of your graphics.
Documentation · Getting Started · Demo · npm
Install
npm install data-navigator
import dataNavigator from 'data-navigator';
How it works
Data Navigator is organized into 3 composable modules:
- Structure — a graph of nodes and edges that defines navigation paths through your data
- Input — handles keyboard, touch, voice, gesture, and custom input modalities
- Rendering — creates semantic HTML elements overlaid on your visualization
These modules can be used together or independently. Visit the docs for a step-by-step guide to building your first navigable chart.
Inspector
The optional @data-navigator/inspector package provides a visual graph of your data-navigator structure, useful for debugging and understanding navigation paths.
npm install @data-navigator/inspector data-navigator d3-array d3-drag d3-force d3-scale d3-scale-chromatic d3-selection
import dataNavigator from 'data-navigator';
import { Inspector } from '@data-navigator/inspector';
const inspector = Inspector({
    structure: myStructure, // made using data navigator
    container: 'inspector-container' // render to DOM
});
// Sync with navigation events
inspector.highlight(nodeId);
inspector.clear();
inspector.destroy();
Contributing
See CONTRIBUTING.md for setup instructions and development workflow.
Credit
Data Navigator was developed at CMU's Data Interaction Group (CMU DIG), primarily by Frank Elavsky.
Citing Data Navigator
@article{2023-data-navigator,
  title = {{Data Navigator}: An Accessibility-Centered Data Navigation Toolkit},
  publisher = {{IEEE}},
  author = {Frank Elavsky and Lucas Nadolskis and Dominik Moritz},
  journal = {{IEEE} Transactions on Visualization and Computer Graphics},
  year = {2023},
  url = {http://dig.cmu.edu/data-navigator/}
}