Support for a cftime axis in matplotlib
| ⚙️ CI |     |
| 💬 Community | |
| 📖 Documentation | |
| 📈 Health | |
| ✨ Meta | |
| 📦 Package | |
| 🧰 Repo | |
Installation
Install nc-time-axis either with conda:
conda install -c conda-forge nc-time-axis
Or pip:
pip install nc-time-axis
Example
import random
import cftime
import matplotlib.pyplot as plt
import nc_time_axis
calendar = "360_day"
dt = [
    cftime.datetime(year=2017, month=2, day=day, calendar=calendar)
    for day in range(1, 31)
]
temperatures = [round(random.uniform(0, 12), 3) for _ in range(len(dt))]
plt.plot(dt, temperatures)
plt.margins(0.1)
plt.ylim(0, 12)
plt.xlabel("Date")
plt.ylabel("Temperature")
plt.show()

License
nc-time-axis is distributed under the terms of the BSD-3-Clause license.
#ShowYourStripes
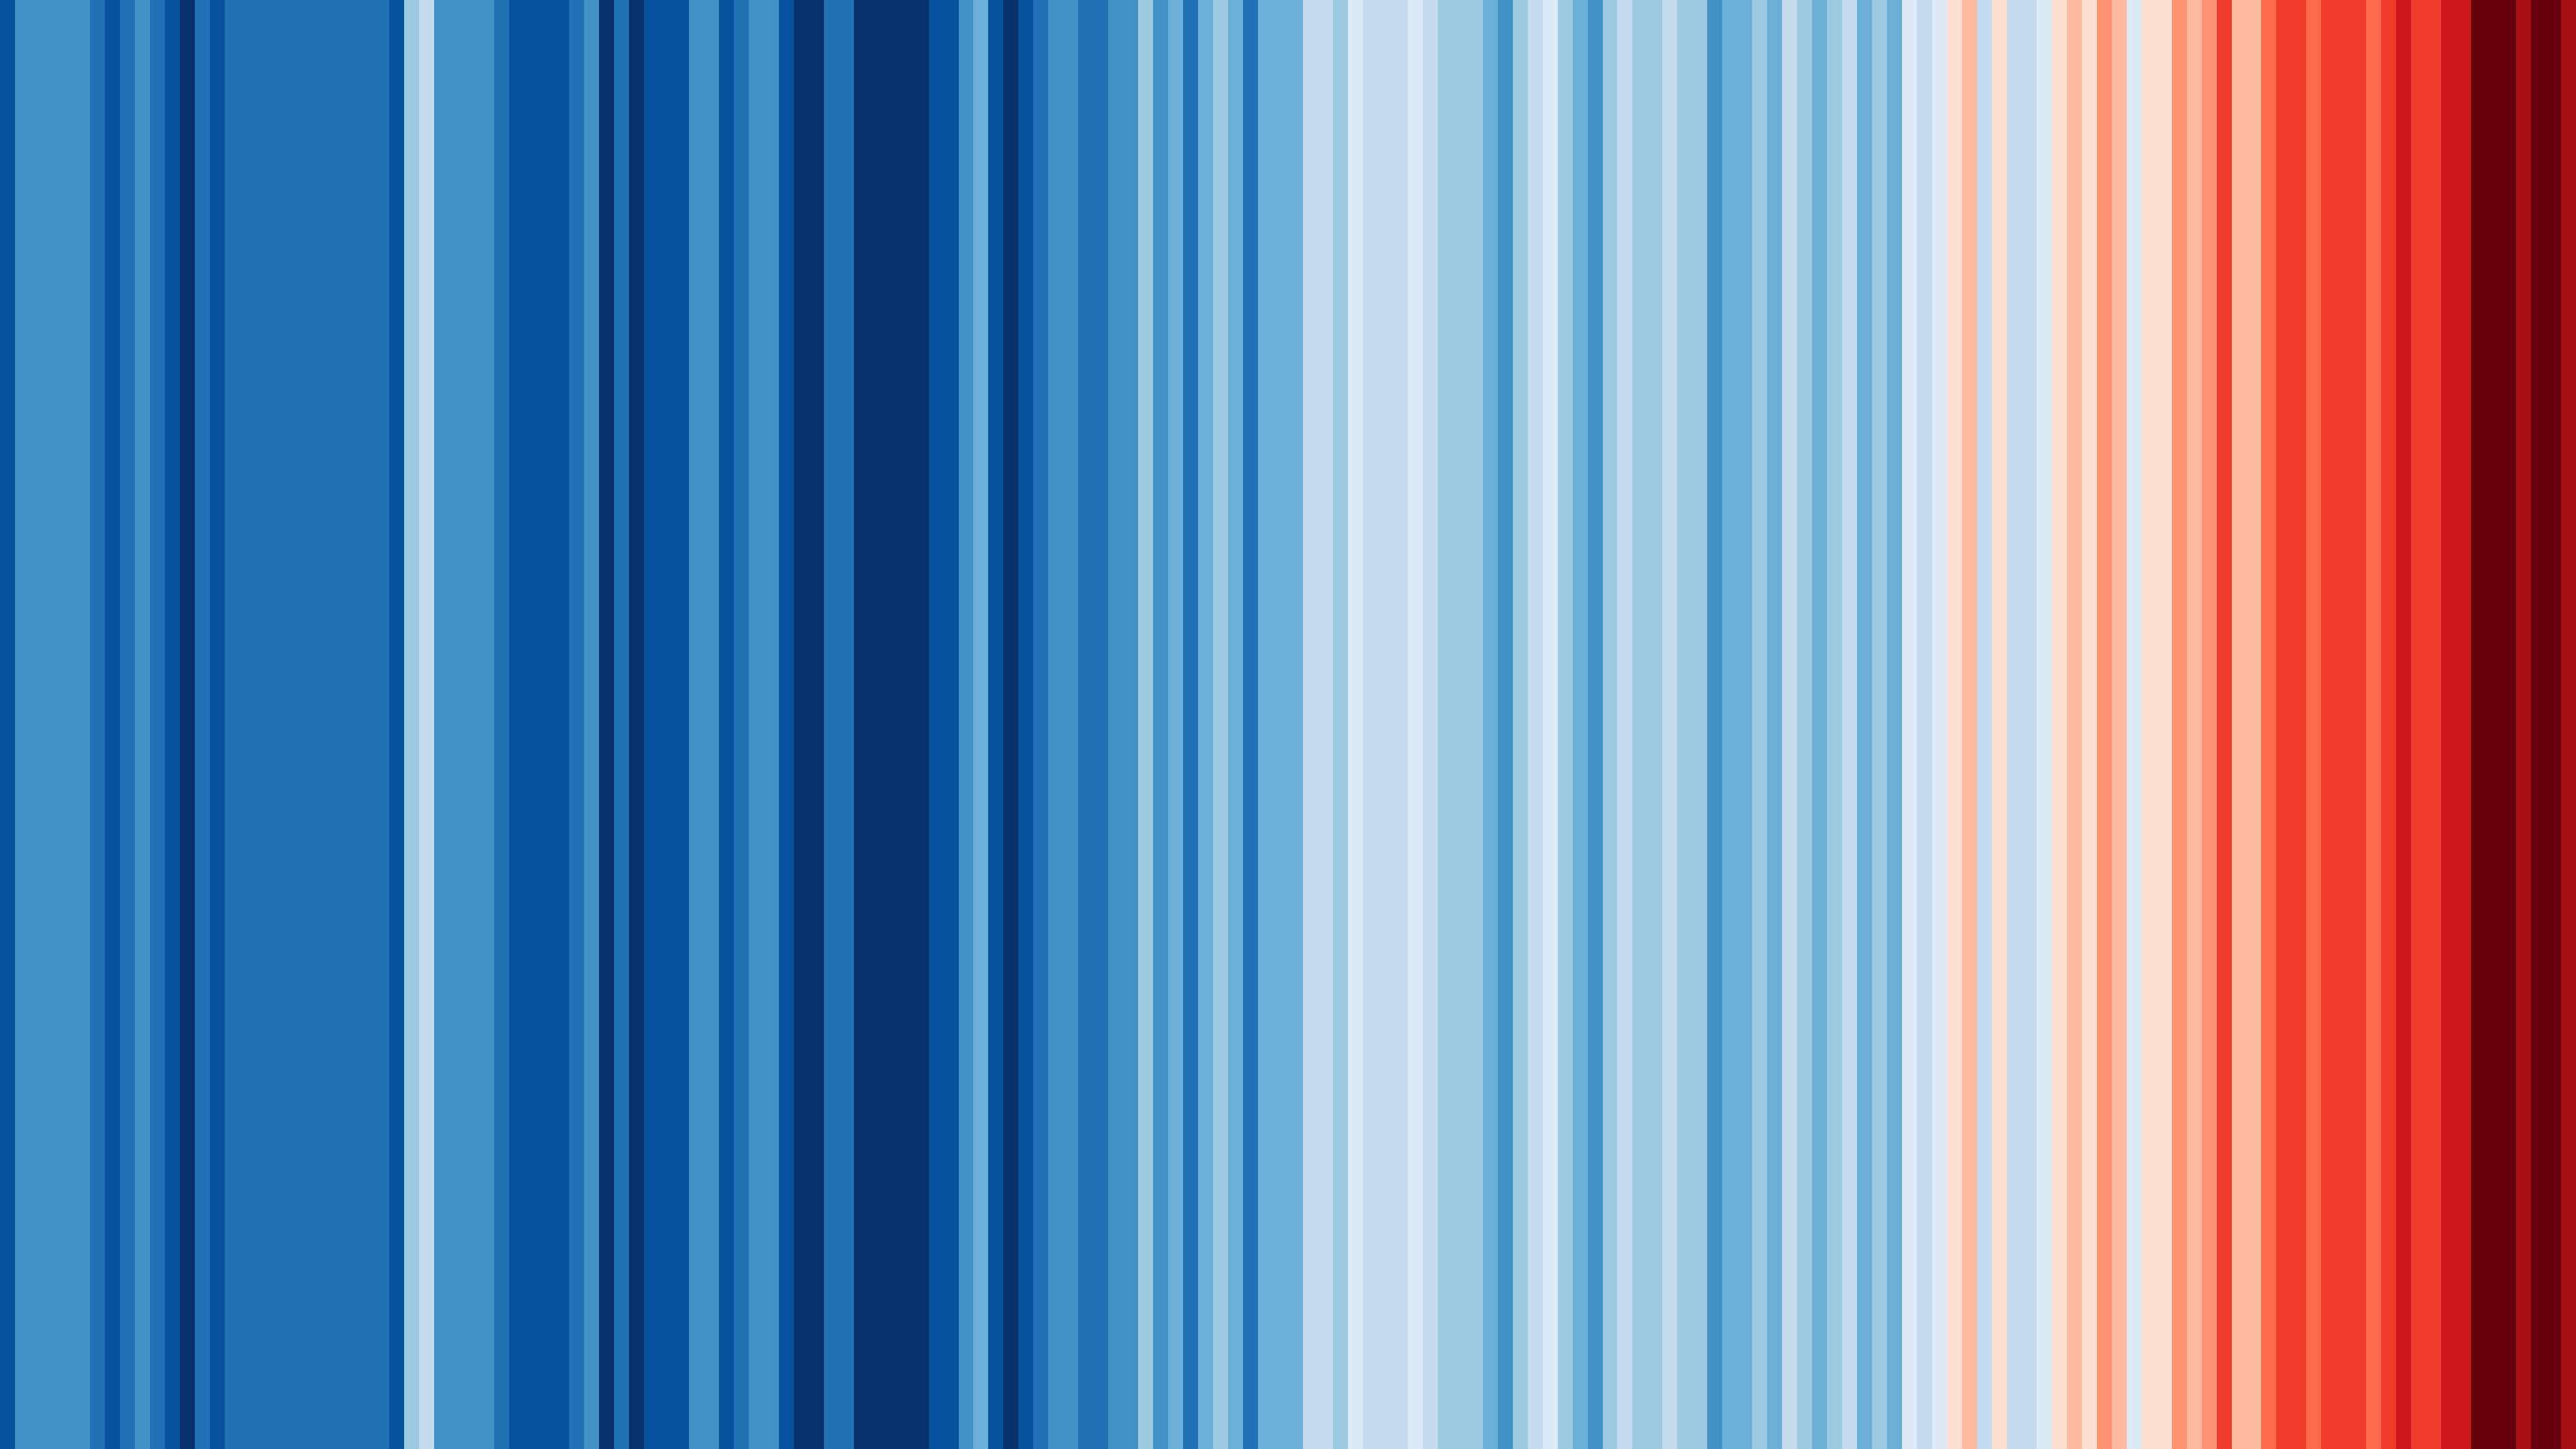
Graphics and Lead Scientist: Ed Hawkins, National Centre for Atmospheric Science, University of Reading.
Data: Berkeley Earth, NOAA, UK Met Office, MeteoSwiss, DWD, SMHI, UoR, Meteo France & ZAMG.
#ShowYourStripes is distributed under a
Creative Commons Attribution 4.0 International License