Update 1.94.1: The update addresses this security issue.
Update 1.94.2: The update addresses these issues.
Downloads: Windows: x64 Arm64 | Mac: Universal Intel silicon | Linux: deb rpm tarball Arm snap
Welcome to the September 2024 release of Visual Studio Code. There are many updates in this version that we hope you'll like, some of the key highlights include:
- Find in Explorer - Quickly find files in the Explorer view with the improved Find control.
- Source Control Graph - More filtering options and interactivity in the Source Control Graph.
- Python test coverage - Run Python tests with coverage and get rich results in the editor.
- ESM - Faster VS Code startup thanks to the migration to ESM.
- Account preference - Specify which account to use for an extension.
- Copilot in Native REPL - Get code completions and Inline Chat in the Native REPL.
- Improved chat context - Drag & drop files or use IntelliSense for more relevant chat context.
- Test environment setup - Get help with setting up a test framework for your workspace.
If you'd like to read these release notes online, go to Updates on code.visualstudio.com. Insiders: Want to try new features as soon as possible? You can download the nightly Insiders build and try the latest updates as soon as they are available.
GitHub Copilot
Switch language models in chat
Previously, we announced that you can sign up for early access to OpenAI o1 models. Once you have access, you will have a Copilot Chat model picker control in Copilot Chat in VS Code to choose which model version to use for your chat conversations.
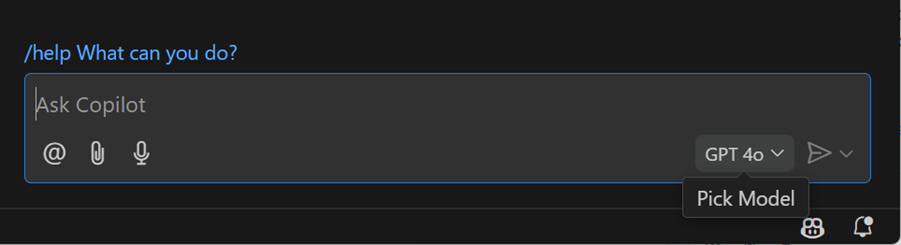
GPT-4o in Inline Chat
We've upgraded Copilot Inline Chat to GPT-4o, to give you faster, more accurate, and higher-quality code and explanations when you use Chat in the editor.
Public code matching in chat
You can allow GitHub Copilot to return code that could match publicly available code on GitHub.com. When this functionality is enabled for your organization subscription or personal subscription, Copilot code completions already provided you with details about the matches that were detected. We now show you these matches for public code in Copilot Chat as well.
If this is enabled for your organization or subscription, you might see a message at the end of the response with a View matches link. If you select the link, an editor opens that shows you the details of the matching code references with more details.
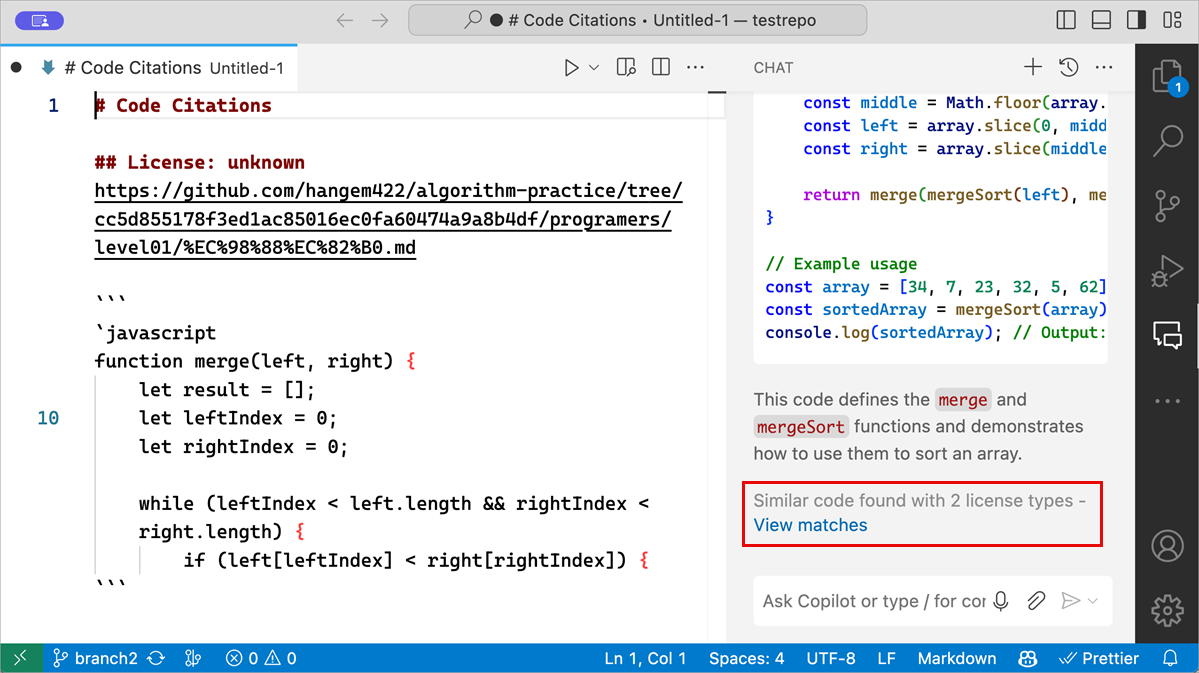
Get more information about code referencing in GitHub Copilot on the GitHub Blog.
File suggestions in chat
In chat input fields, you can now type #<filename> to get file name suggestions and quickly attach them to your prompt as context. This works in chat locations that support file attachments, such as the Chat view, Quick Chat, Inline Chat, and Notebook Chat.
Improved file links in chat responses
We've improved the rendering of any workspace file paths that are mentioned in Copilot responses. These paths are very common when you ask @workspace questions.
The first thing you'll notice, is that paths to workspace files now include a file icon. This enables you to easily distinguish them in the chat response. The file icon is based on your current file icon theme.
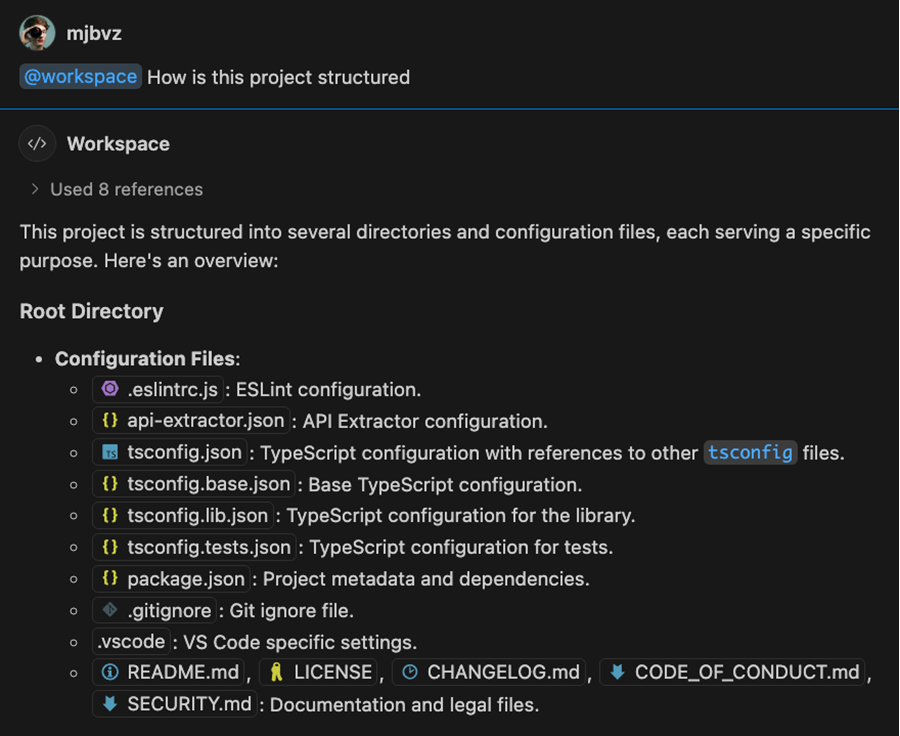
These paths are interactive links, so just select them to open the corresponding file. You can even use drag and drop to open the file in a new editor group, or insert it into a text editor by holding Shift before dropping.
By default, these links only show the file name but you can hover over them to see the full file path.
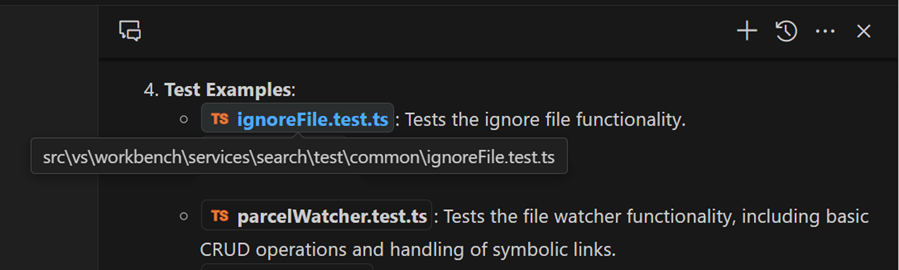
You can also right-click on one of these paths to open a context menu with additional commands, such as copying a relative path to the resource, or revealing the file in your operating system's file explorer.
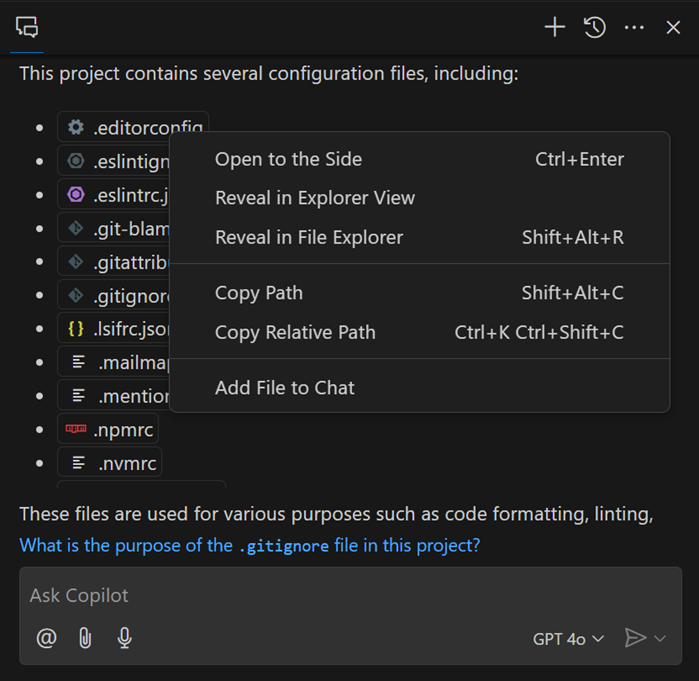
We plan to further improve workspace path rendering in the coming iterations, as well as make similar improvements to symbol names in responses.
Drag and drop files to add chat context
You can now easily attach additional files as context for a chat prompt by dragging files or editor tabs from the workbench directly into chat. For Inline Cat, hold Shift and drop a file to add it as context instead of opening it in the editor.
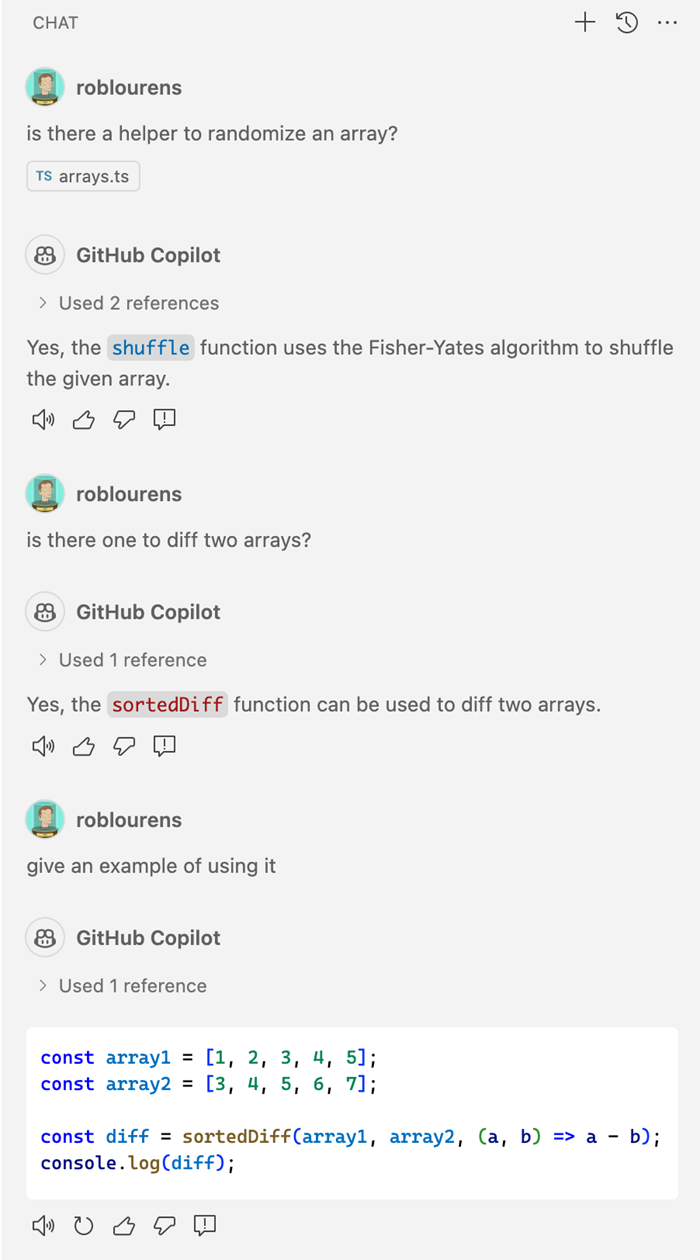
File attachments included in history
There are multiple ways to attach a file or editor selection as relevant context to your chat request. Previously, this context was added only for the current request and was not included in the history of follow-on requests. Now, these attachments are kept in history, so that you can keep referring to them without having to reattach them.
Inline Chat and completions in Python native REPL
The native REPL editor, used by the Python extension, now supports Copilot Inline Chat and code completions directly in the input box.
Accept and run generated code in notebook
When you use Copilot Inline Chat to generate code in a notebook, you can now accept and directly run the generated code from Inline Chat.
Attach variables in notebook chat
When you use Copilot in a notebook, you can now attach variables from the Jupyter kernel in your requests. Adding variables gives you more precise control over the context for your chat request, so that you get more relevant responses from Copilot.
Either type #, followed by the variable name, or use the 📎 control (⌘/ (Windows, Linux Ctrl+/)) in Inline Chat to add a context variable.
Refreshed chat user experience
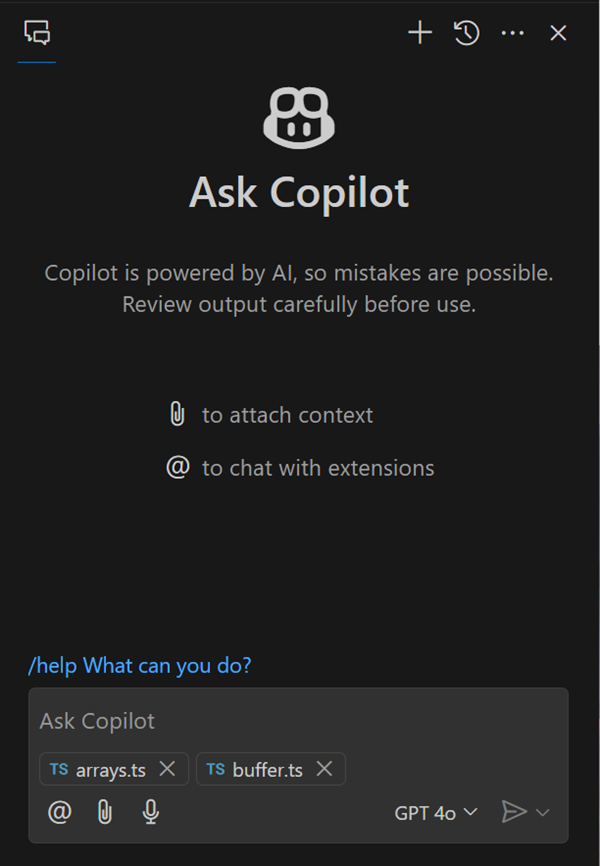
We've refreshed the Chat view with a clean new welcome experience, and we've updated the layout of the chat input area. You can now use the @ button to easily find the list of available chat participants and slash commands, both the built-in ones and chat participants from extensions that you've installed. You can also still find participants and slash commands by typing / or @ in the chat input box.
Semantic search results (Preview)
Setting: github.copilot.chat.search.semanticTextResults
The Search view enables you to perform an exact search across your files. We have now added functionality to the Search view that uses Copilot to give search results that are semantically relevant.
This functionality is still in preview and by default, the setting is not enabled. Try it out and let us know what you think!
Fix test failure (Preview)
Setting: github.copilot.chat.fixTestFailure.enabled
We've added specialized logic to help you to diagnose failing unit tests. This logic is triggered in some scenarios by the /fix slash command, and you can also invoke it directly with the /fixTestFailure slash command. The command is enabled in chat by default but can be disabled via the setting
github.copilot.chat.fixTestFailure.enabled
.
Automated test setup (Experimental)
Setting: github.copilot.chat.experimental.setupTests.enabled
We added an experimental /setupTests slash command that can help you configure the testing set up for your workspace. This command can recommend a testing framework, provide steps to set up and configure it, and suggest a VS Code extension to provide testing integration in VS Code. This can save you time and effort to get started with testing for your code.
When you use the /tests command to generate tests for your code, it can recommend /setupTests and testing extensions if looks like such an integration has not been set up yet in your workspace.
Start debugging from Chat (Experimental)
Setting: github.copilot.chat.experimental.startDebugging.enabled
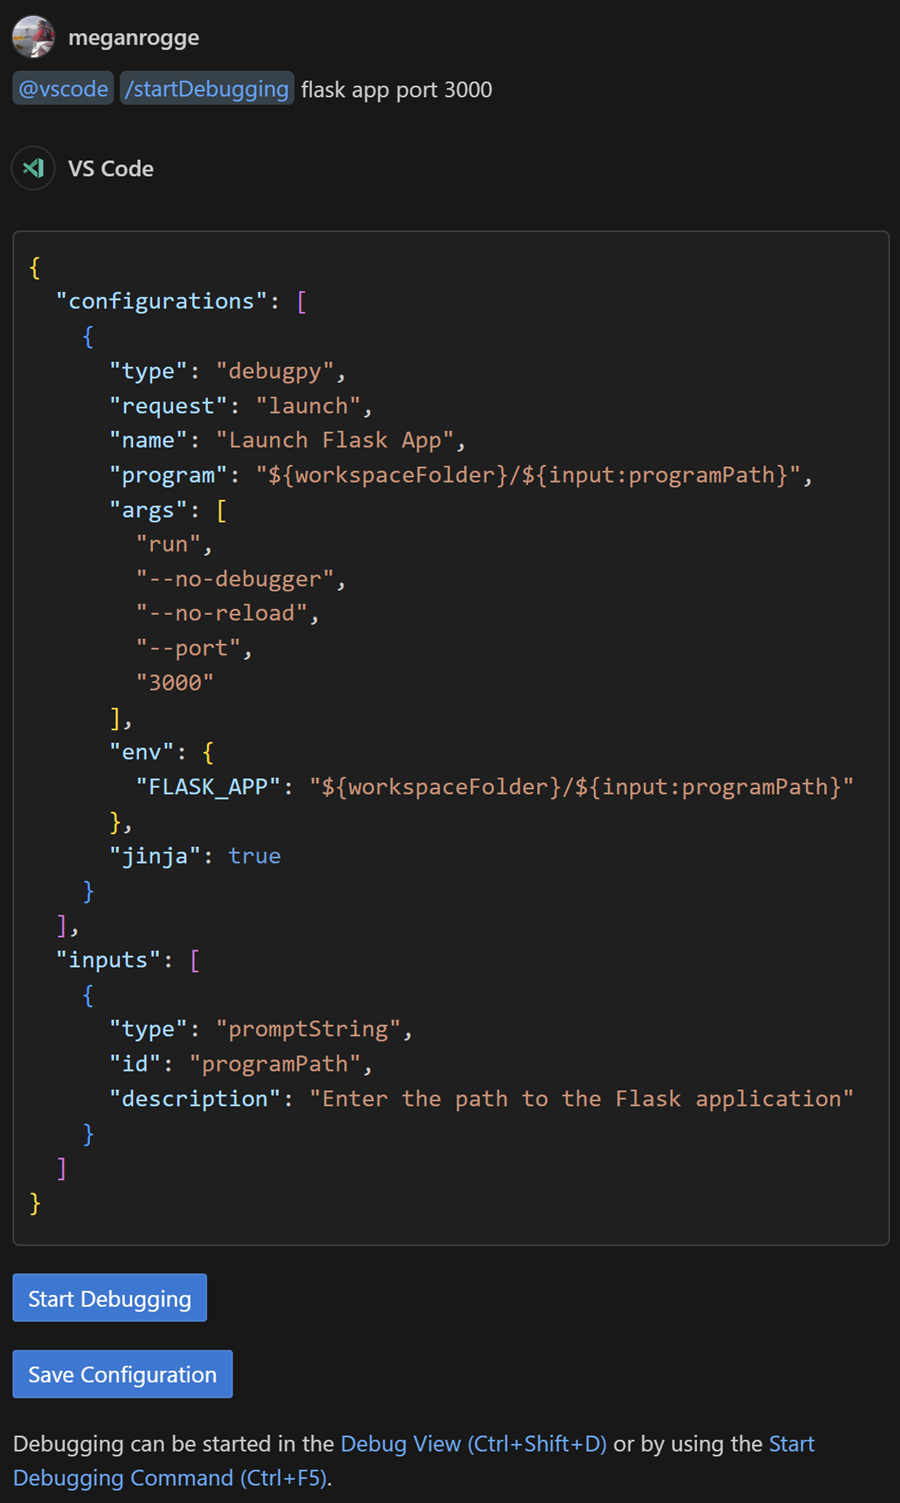
In this milestone, we made improvements to the experimental /startDebugging slash command. This command enables you to easily find or create a launch configuration and start debugging your application seamlessly. When you use @vscode in Copilot Chat, /startDebugging is now available by default.
Chat in Command Center (Experimental)
Setting: chat.commandCenter.enabled
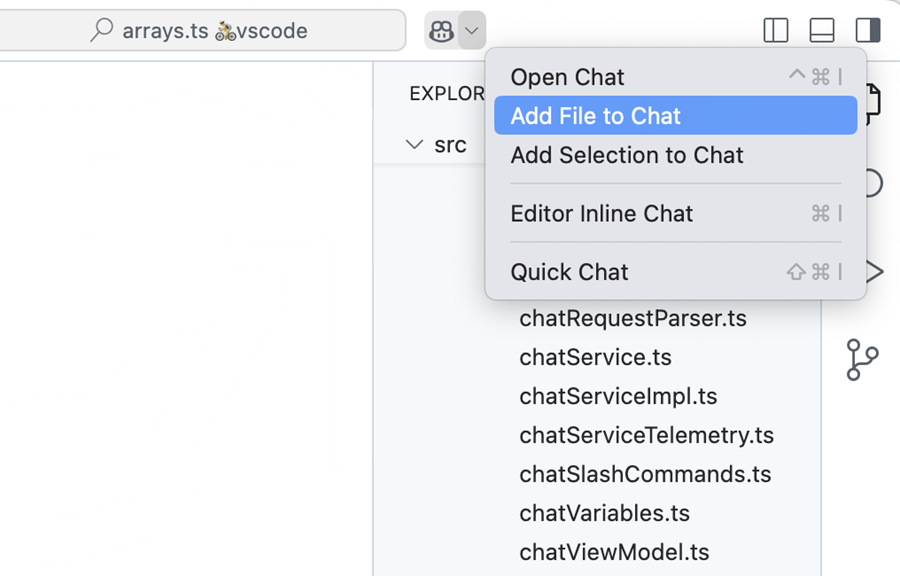
We are experimenting with a Command Center entry for accessing chat. It provides quick access to all relevant chat commands, like starting the different chat experiences or attaching context to your prompt. Note that the Command Center itself needs to be enabled for the chat Command Center entry to show.
Improved temporal context (Experimental)
Setting: github.copilot.chat.experimental.temporalContext.enabled
With temporal context, you can instruct Inline Chat to consider recently opened or edited files as part of the chat context. We have improved this feature and invite everyone to give it a go.
Custom instructions (Experimental)
Setting: github.copilot.chat.experimental.codeGeneration.useInstructionFiles
Setting: github.copilot.chat.experimental.testGeneration.instructions
Last milestone, we introduced custom code-generation instructions. We've further expanded this functionality to define shared instructions for code generation in a .github/copilot-instructions.md file in your workspace. These common instructions supplement your own personal code generation instructions. Enable the code-generation instruction file with the
github.copilot.chat.experimental.codeGeneration.useInstructionFiles
setting.
In addition, you can now define instructions for test generation in settings or import them from a file. For example, if you always want to use a particular unit testing framework for your tests. Configure the test-generation instructions in the github.copilot.chat.experimental.testGeneration.instructions setting.
Accessibility
Getting started
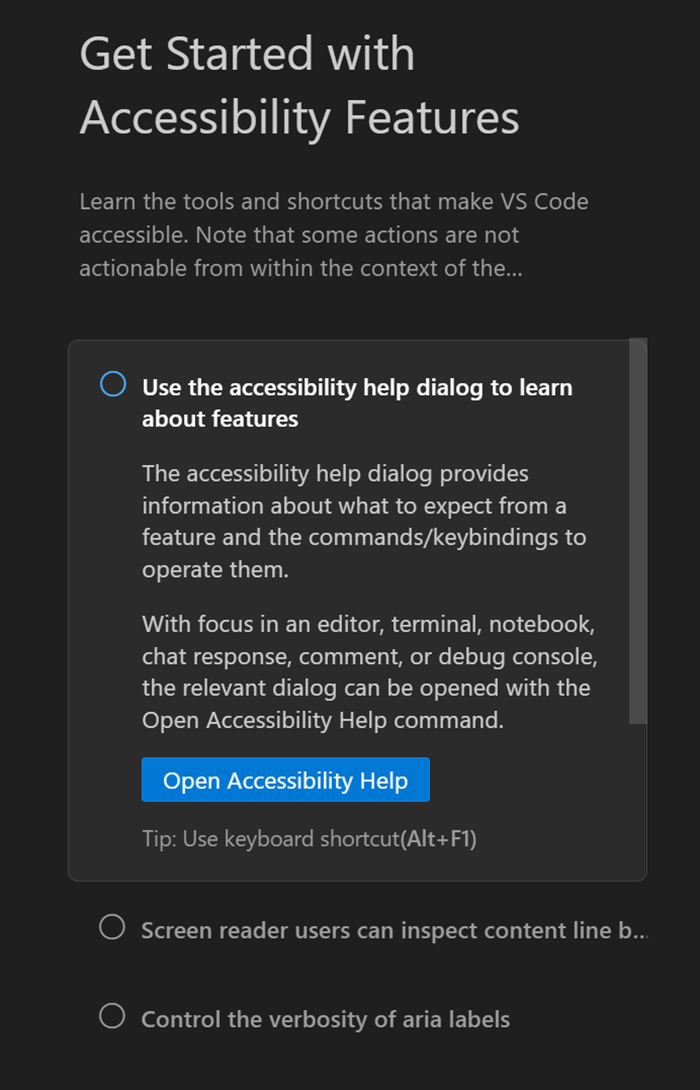
Our Help menu now includes a Get Started with Accessibility Features walkthrough, which makes it easier for you to explore and utilize the accessibility options. The walkthrough introduces you to functionality, such as the accessibility help dialog, accessibility signals, keyboard shortcuts, and more.
We have introduced an accessible view for comment thread controls. This view includes the relevant editor context, enabling you to stay focused without needing to switch between the editor and the accessible view. Likewise, the editor context is now provided in the accessible view for the comments panel.
We've also introduced the Comments: Focus Comment on Current Line command that lets you quickly move to the Comments control from the Editor by using the keyboard. There are also new actions to go to the next and previous commented ranges in the Editor: Comments: Go to Next Commented Range and Comments: Go to Previous Commented Range.
Workbench
Change an extension's account preference
In this iteration, we explored how to improve the experience of changing the preferred account for an extension. For example, if you have multiple GitHub accounts and you accidentally signed in to GitHub Copilot with the wrong account and now need to use the other one.
It's now possible to change that preference after the fact in multiple ways.
-
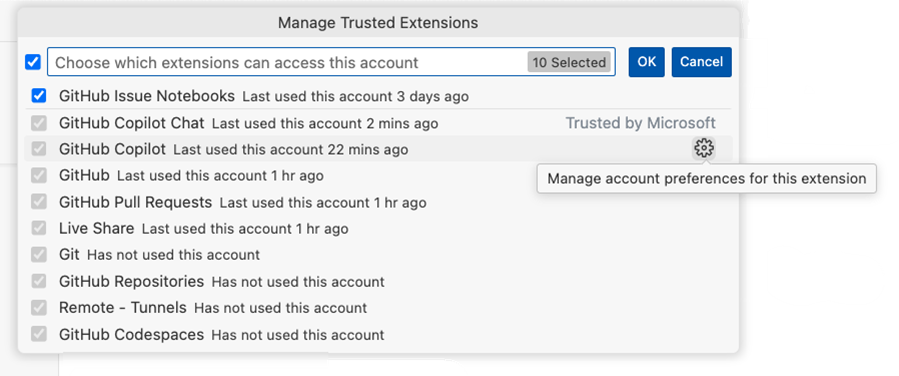
Account menu in the Activity Bar > <Your Account> > Manage Trusted Extensions > select the gear icon for an extension
-
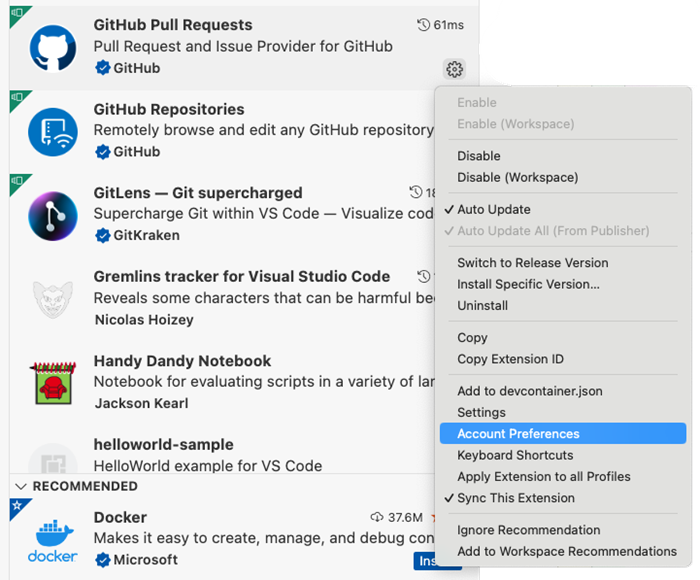
Extensions view > context menu (or gear icon) on an extension that uses auth > select Account Preferences
-
Extension detail view > gear icon > select Account Preferences
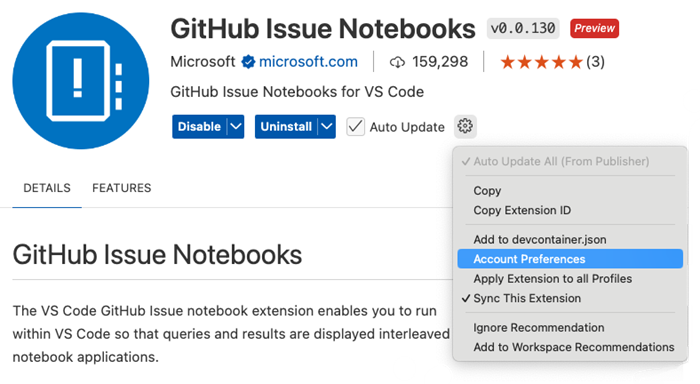
Choosing any of these options takes you to a Quick Pick where you can change the account that an extension uses.
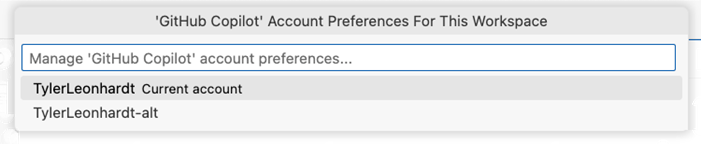
When you change an extension's account preference, this sends an event to the extension and it is up to the extension to handle it properly. If you don't see the expected behavior, report an issue going for that extension, so the account preference experience can be handled.
Also, let us know if you have any feedback on this flow.
View folders and workspaces associated with a profile
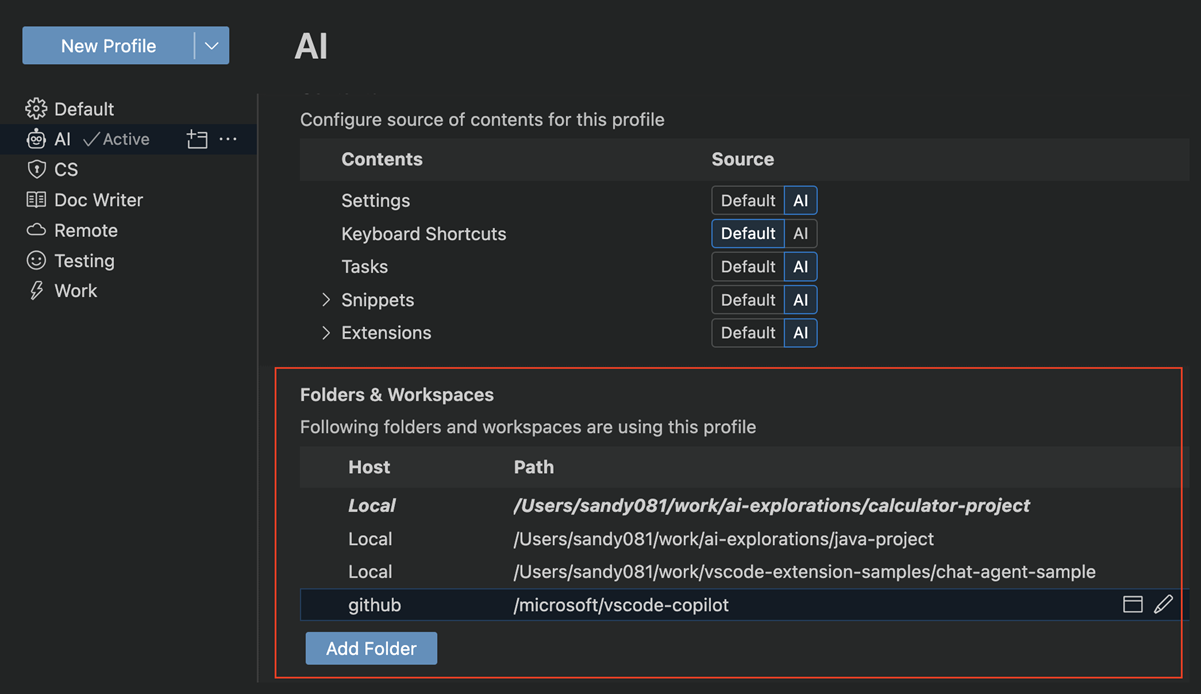
In this milestone, we introduced a Folders & Workspaces section in the Profiles editor. This section lists all folders and workspaces that are associated with a specific profile from a central place. From this section, you can add or modify folders, or open the folder or workspace in a new window.
Update extensions across all profiles
In this milestone, we introduced the ability to update extensions across all profiles. This is useful if you have multiple profiles and you want to keep your extensions versions in sync. Previously, you had to switch to each profile and update the extensions for that profile.
Warnings in the Extensions view
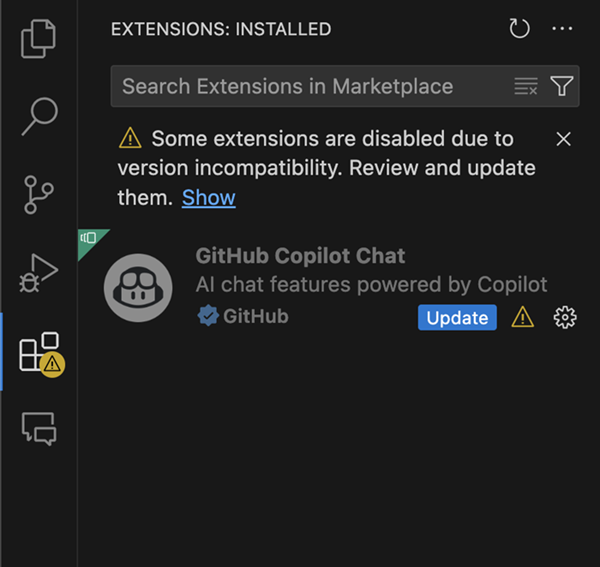
The Extensions view now shows a warning badge and associated information when there are any invalid extensions or extensions that are disabled due to version incompatibility.
Find in Explorer
We’ve improved the Find feature in the Explorer view to make it easier to search for files in large projects. You can open the Find control in the File Explorer by using the ⌥⌘F (Windows, Linux Ctrl+Alt+F) keyboard shortcut. While searching, you can switch between fuzzy matching and continuous matching for more flexible results.
Note that some context menu actions are temporarily disabled during searches. Stay tuned for more improvements coming soon!
Release notes
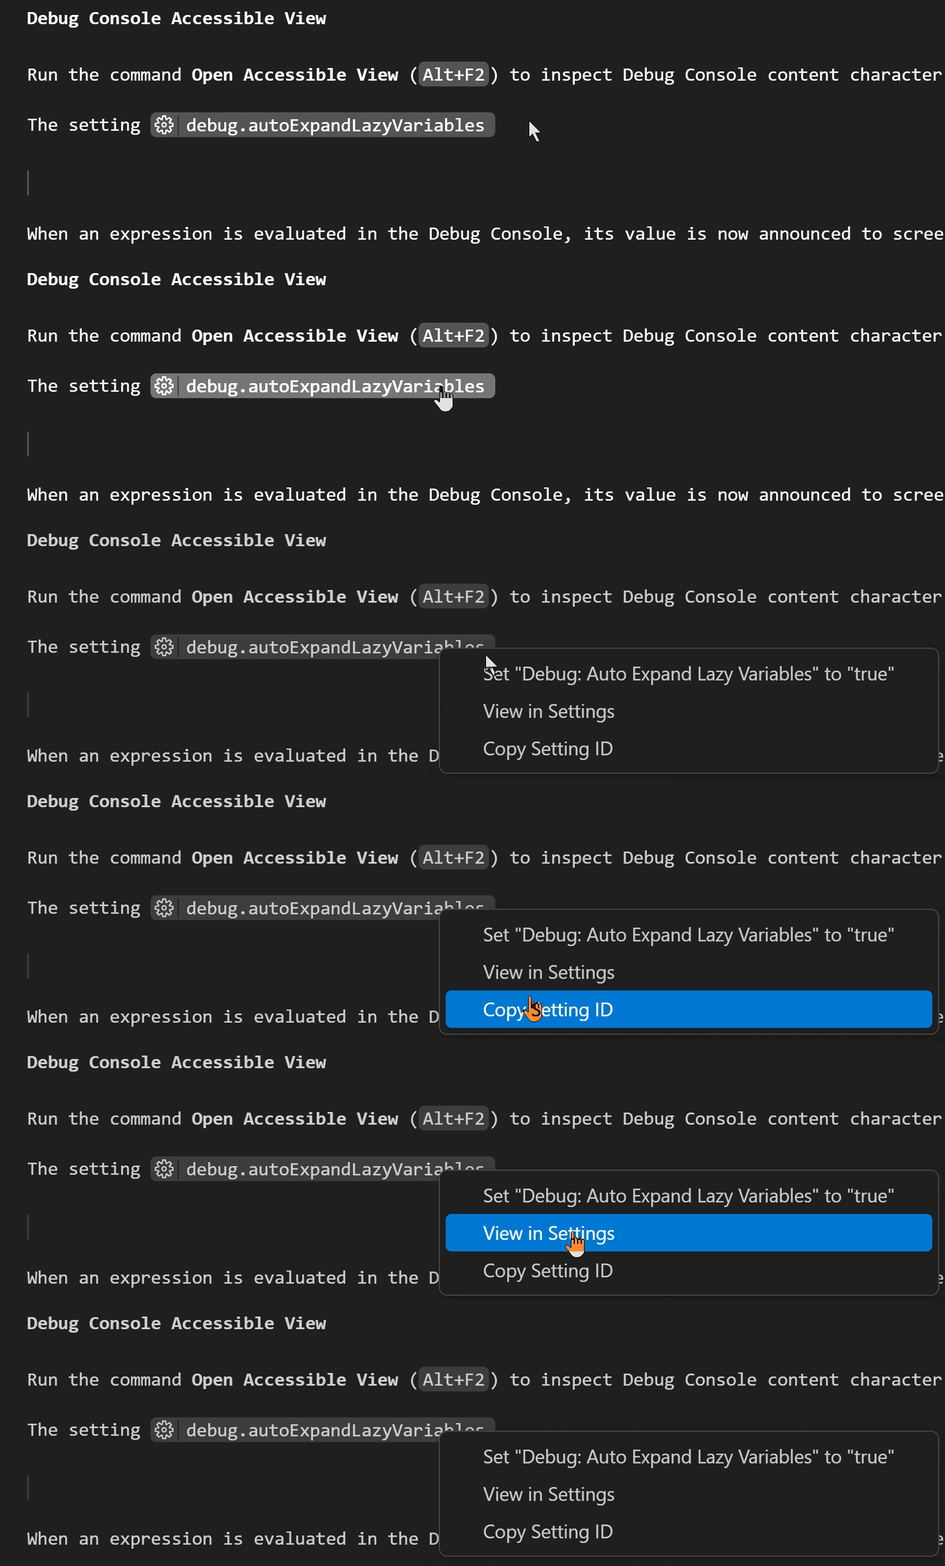
We have a simplified syntax for referring to settings in our release notes ( setting.name ), which also has the now-familiar settings-gear rendering when displayed in the release notes editor.
Editor
Inlay hint improvements
We have added the editor.inlayHints.maximumLength setting, which controls after how many characters inlay hints are truncated.
We have also revised the updating strategy for inlay hints and now, while typing, they should update sooner but not cause any horizontal movements of your cursor.
Experimental Edit Context
This milestone, we introduced a new experimental setting editor.experimentalEditContextEnabled . This setting enables the EditContext API to power the editing experience in VS Code. The adoption of the EditContext API has enabled us to fix certain IME composition bugs. Generally we believe it will improve the editing experience in the long term, and ultimately it will be enabled by default.
Make sure to reload your VS Code window after enabling this setting to take advantage of it.
Source Control
Source Control Graph view improvements
Last milestone, we added the new Source Control Graph view. This milestone, we have been working on expanding the functionality available in the newly added view as well as polishing the layout of the view.
Repository picker
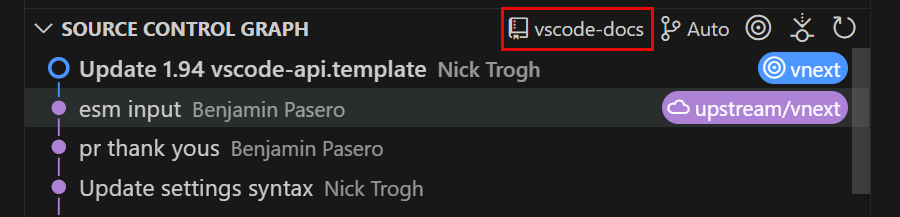
When you open a folder/workspace that contains multiple repositories, the Source Control Graph view title shows a repository picker. By default, the Source Control Graph view shows the active repository, matching the information in the Status Bar. You can use the repository picker to lock the Source Control Graph view to a particular repository.
History item reference picker
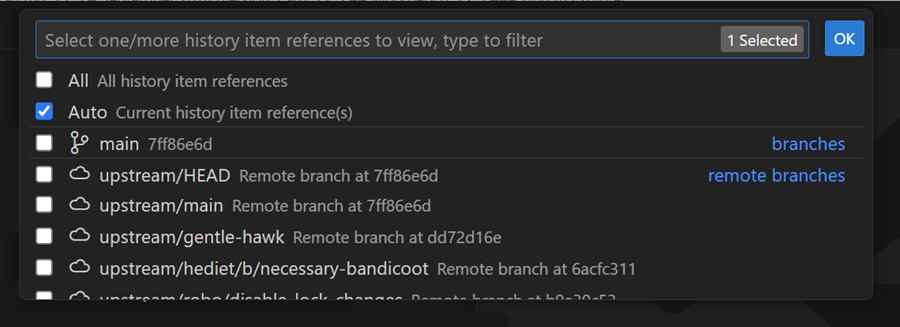
This milestone, we have added a new history item reference picker to the Source Control Graph view title. You can use this reference picker to filter the history items shown in the graph to a different branch, or to view multiple branches.
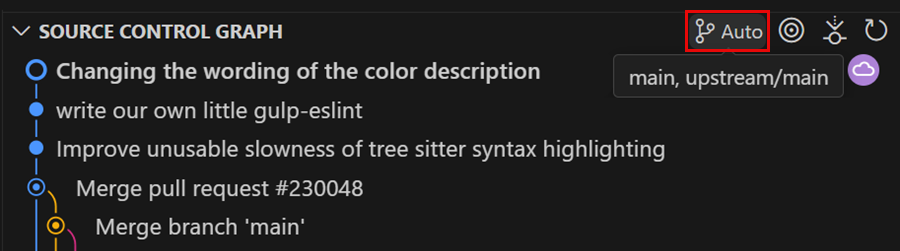
By default the history item reference picker is set to Auto, which renders the graph for the current history item reference, its remote, and an optional base.
History item actions
This milestone, we have expanded the list of actions that are available in the context menu for source control history items. We have added actions to create a new branch/tag from a history item, cherry-pick a history item, and checkout (detached) an item.
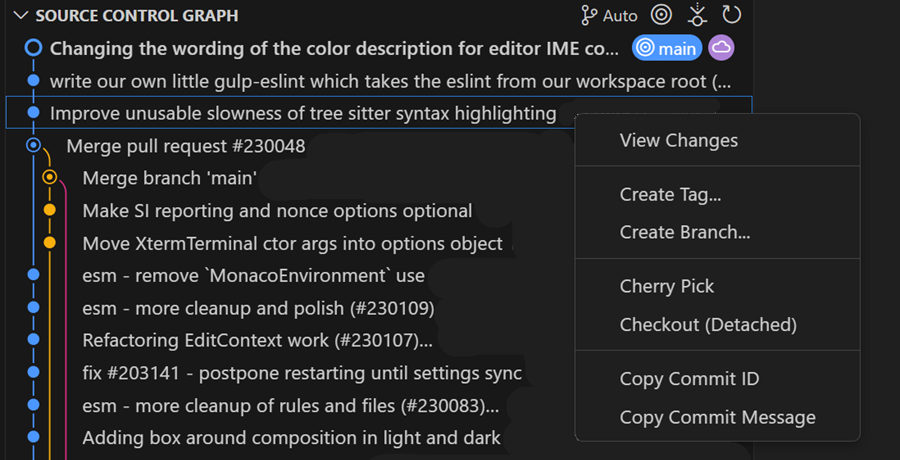
Source Control Graph settings
This milestone, we have added a set of new settings, so that you can customize the graph:
- scm.graph.badges - controls which badges are shown in the Source Control Graph view
- scm.graph.pageOnScroll - controls whether the Source Control Graph view loads the next page of items when you scroll to the end of the list
- scm.graph.pageSize - the default number of items to show in the Source Control Graph view and when loading more items
Notebooks
Multi cursor support across cells (preview)
The Notebook editor now supports multi-cursor editing between cells with the setting notebook.multiCursor.enabled . Currently, this can only be triggered with the shortcut Ctrl+D and supports core editor actions alongside a limited subset of editor commands.
Diff editor shows document metadata changes
The notebook diff editor now also shows changes made to the document metadata, such as kernel information and cell language.
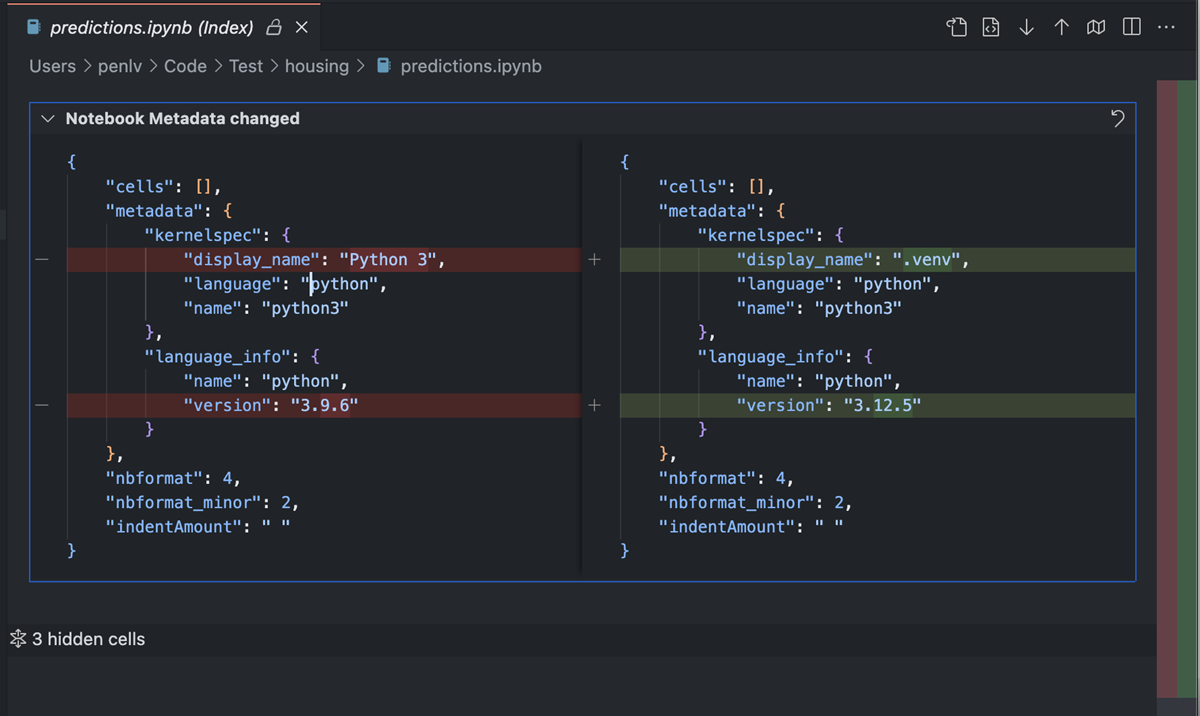
Collapse unchanged regions in diff view
The notebook diff view now respects the setting diffEditor.hideUnchangedRegions.enabled . When enabled, unchanged code blocks are collapsed by default, which makes reviewing changes in large notebooks easier.
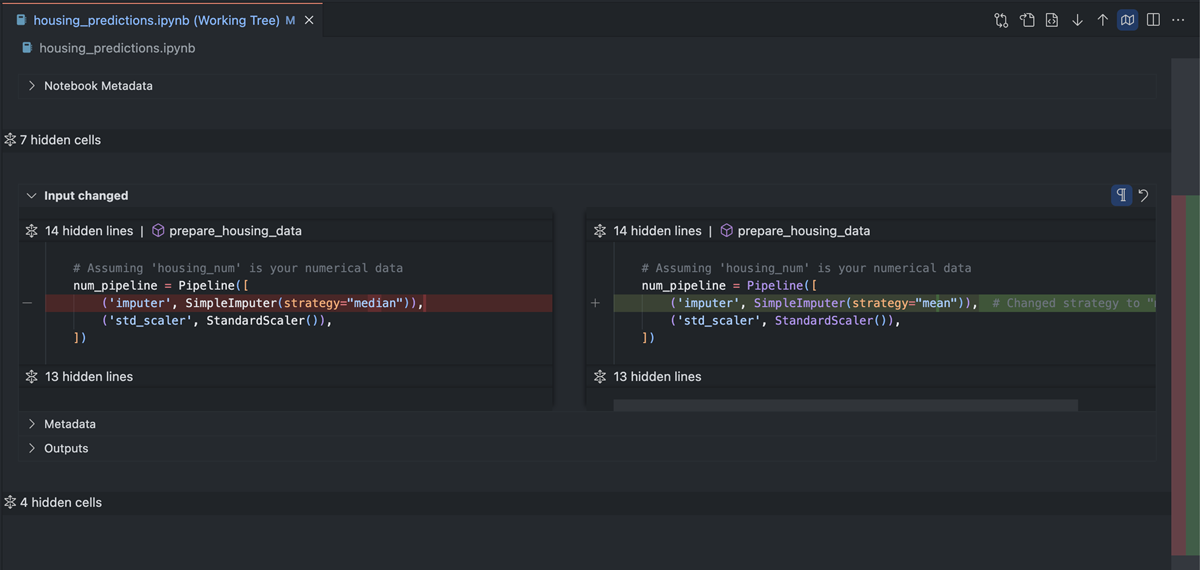
Notebook serialization in web worker (Experimental)
This release introduces an experimental feature that enables notebook serialization in a web worker. This can help reduce main thread blocking time in the Extension Host process when you work with large notebooks. By default, this feature is disabled but can be enabled by setting
ipynb.experimental.serialization
to true.
Debug
Support for data colorization
VS Code supports new text styling capabilities from the Debug Adapter Protocol. This enables data in the Variables view, Watch view, hovers, and Debug Console to be colorized via ANSI escape sequences.
JavaScript Debugger
Improved display of HTML elements
We've improved how HTML elements are displayed in the JavaScript debugger. Previously, they were rendered as naive objects, which were hard to navigate. Now, they more closely reflect DOM structure, and we take advantage of new colorization capabilities to provide some basic syntax highlighting.
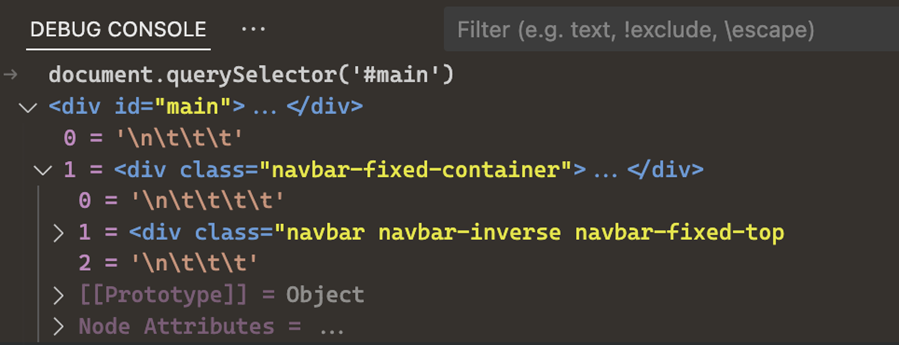
Autocomplete of Node commands in launch configuration
There is a new autocompletion helper available in launch.json files for command-line applications that are installed in your node_modules. This makes it easier to set up debugging for tools like vitest or nest.
Cleaner Loaded Sources view
We changed how source paths are structured for Node.js built-in modules, evaluated scripts, and WebAssembly modules to make the Loaded Sources view less noisy and easier to browse.
Languages
TypeScript 5.6
Our JavaScript and TypeScript support now uses TypeScript 5.6. This major update includes a number of language and tooling improvements, along with important bug fixes and performance optimizations.
You can read all about the TypeScript 5.6 release on the TypeScript blog. We've also included a few tooling highlights in the following sections.
Detection of some common 'always true' programming mistakes
Say you're using a regular expression in JavaScript or TypeScript and write some code like this:
{
  "typescript.preferences.autoImportSpecifierExcludeRegexes": ["^lodash/.*$"]
}
You can configure this by using javascript.preferences.autoImportSpecifierExcludeRegexes for JavaScript and typescript.preferences.autoImportSpecifierExcludeRegexes for TypeScript. For more details see the TypeScript 5.6 release notes
Remote Development
The Remote Development extensions, allow you to use a Dev Container, remote machine via SSH or Remote Tunnels, or the Windows Subsystem for Linux (WSL) as a full-featured development environment.
Highlights include:
- Attach to a Kubernetes container over SSH/Tunnel
- Manually specify GPU availability
You can learn more about these features in the Remote Development release notes.
Contributions to extensions
Python
Run tests with coverage
You can now run Python tests with coverage in VS Code! To run tests with coverage, select the coverage run icon in the Test Explorer or “Run with coverage” from any menu you normally trigger test runs from. The Python extension will run coverage by using the pytest-cov plugin if you are using pytest, or with coverage.py for unittest.
Once the coverage run is complete, lines are highlighted in the editor for line level coverage. These can be closed and re-opened via the Run Results panel in the bottom, where it says "Close Test Coverage" or "View Test Coverage" under the most recent test run. Additionally, a Test Coverage tab appears below the Testing tab in the Test Explorer, also with a beaker icon, which you can also navigate to with Testing: Focus on Test Coverage View in Command Palette (⇧⌘P (Windows, Linux Ctrl+Shift+P)). On this panel you can view line and branch coverage metrics for each file and folder in your workspace.
For more information on running Python tests with coverage, see our Python documentation. For general information on test coverage, see VS Code's Test Coverage documentation.
Python default problem matcher
The Python extension now includes a default problem matcher, simplifying issue tracking in your Python code and offering more contextual feedback. To integrate it, add "problemMatcher": "$python" to your tasks in task.json. A problem matcher scans the task's output for errors and warnings and displays them in the Problems panel, enhancing your development workflow.
Below is an example of a task.json file that uses the default problem matcher for Python:
">PR #2020