The Visual Studio Code editor has built-in debugging support for the Node.js runtime and can debug JavaScript, TypeScript, and many other languages that are transpiled into JavaScript. Setting up a project for Node.js debugging is straightforward with VS Code providing appropriate launch configuration defaults and snippets.
There are a few ways you can debug your Node.js programs in VS Code:
- Use auto attach to debug processes you run in VS Code's integrated terminal.
- Use the JavaScript debug terminal, similar to using the integrated terminal.
- Use a launch config to start your program, or attach to a process launched outside of VS Code.
Auto Attach
If the Auto Attach feature is enabled, the Node debugger automatically attaches to certain Node.js processes that have been launched from VS Code's Integrated Terminal. To enable the feature, either use the Toggle Auto Attach command from the Command Palette (⇧⌘P (Windows, Linux Ctrl+Shift+P)) or, if it's already activated, use the Auto Attach Status bar item.
There are three modes for auto attach, which you can select in the resulting Quick Pick and via the debug.javascript.autoAttachFilter setting:
smart- If you execute a script outside of yournode_modulesfolder or use a common 'runner' script like mocha or ts-node, the process will be debugged. You can configure the 'runner' script allow list using the Auto Attach Smart Pattern setting (debug.javascript.autoAttachSmartPattern).always- All Node.js processes launched in the Integrated Terminal will be debugged.onlyWithFlag- Only processes launched with the--inspector--inspect-brkflag will be debugged.
After enabling Auto Attach, you'll need to restart your terminal by clicking the ⚠ icon in the top right of the terminal, or just creating a new one. Then, the debugger should attach to your program within a second:
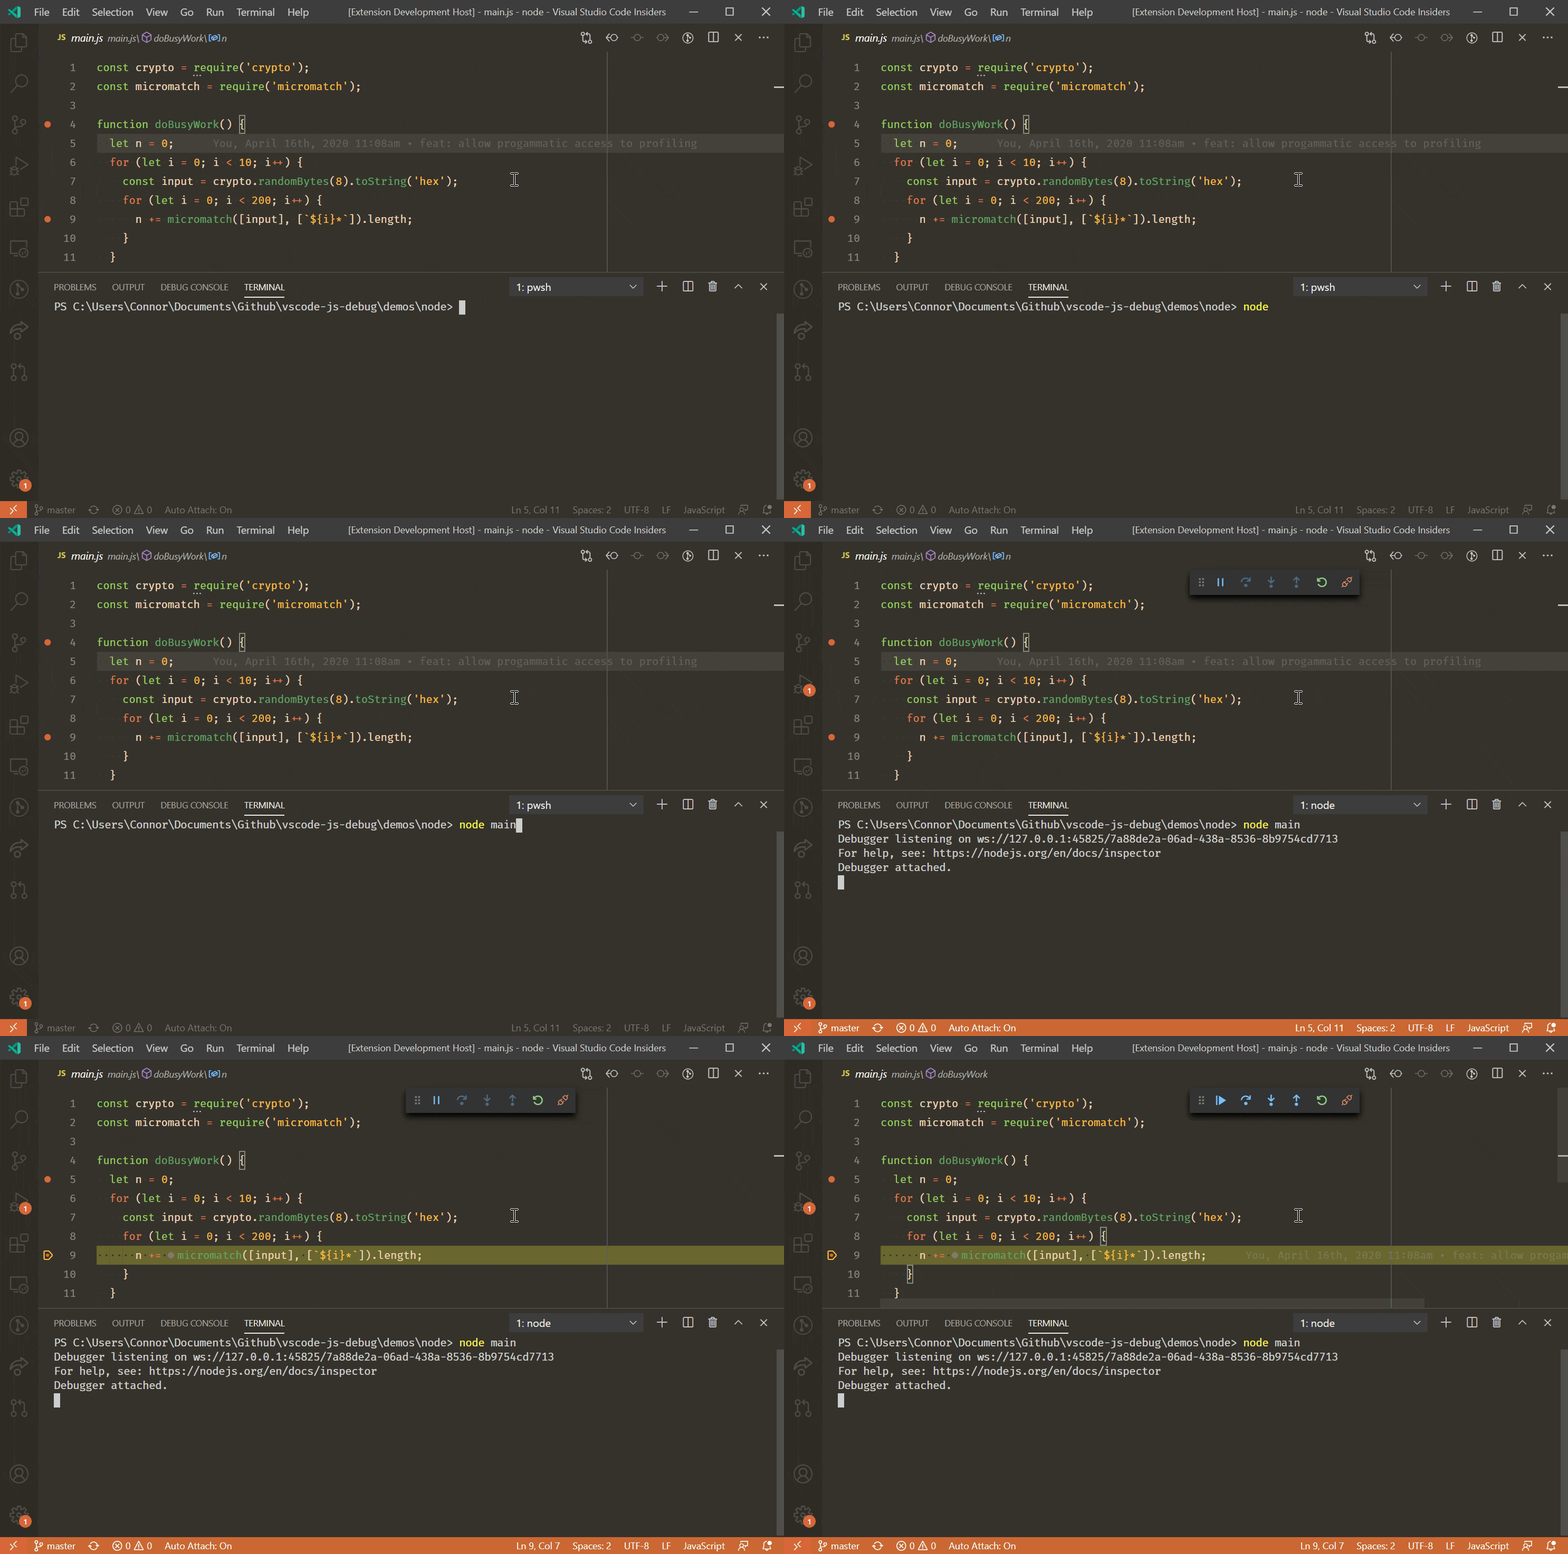
When auto attach is on, the Auto Attach item will appear in the status bar across the bottom of the VS Code window. Clicking it allows you to change the auto attach mode, or temporarily turn it off. Temporarily turning off auto attach is useful if you're running some one-off programs where you don't need debugging, but you don't want to disable the feature entirely.
Additional Configuration
Other Launch Configuration Properties
You can apply other properties normally found in launch.json to auto attach in the debug.javascript.terminalOptions setting. For example, to add node internals to your skipFiles, you could add the following to your user or workspace settings:
[
  '!**/node_modules/**', // exclude scripts in node_modules folders
  '**/$KNOWN_TOOLS$/**' // but include some common tools
];
$KNOWN_TOOLS$ is replaced with a list of common 'code runners' such as ts-node, mocha, ava, and so on. You can modify this list if these settings don't work. For example, to exclude mocha and include my-cool-test-runner, you could add two lines:
"debug.javascript.terminalOptions": {
  "skipFiles": [
    "<node_internals>/**"
  ]
},
Launch Configuration
Launch configs are the traditional way to set up debugging in VS Code, and provide you the most configuration options for running complex applications.
In this section we'll go into more detail about configurations and features for more advanced debugging scenarios. You'll find instruction for debugging with source maps, stepping over external code, doing remote debugging, and much more.
If you'd like to watch an introductory video, see Getting started with debugging in VS Code.
Note: If you are just getting started with VS Code, you can learn about general debugging features and creating
launch.jsonconfiguration files in the Debugging topic.
Launch configuration attributes
Debugging configurations are stored in a launch.json file located in your workspace's .vscode folder. An introduction into the creation and use of debugging configuration files is in the general Debugging article.
Below is a reference of common launch.json attributes specific to the Node.js debugger. You can view the complete set of options in the vscode-js-debug options documentation.
The following attributes are supported in launch configurations of type launch and attach:
outFiles- array of glob patterns for locating generated JavaScript files. See section Source maps.resolveSourceMapLocations- an array of glob patterns for locations where source maps should be parsed. See section Source maps.timeout- when restarting a session, give up after this number of milliseconds. See section Attaching to Node.js.stopOnEntry- break immediately when the program launches.localRoot- VS Code's root directory. See section Remote debugging below.remoteRoot- Node's root directory. See section Remote debugging below.smartStep- try to automatically step over code that doesn't map to source files. See section Smart stepping.skipFiles- automatically skip files covered by these glob patterns. See section Skipping uninteresting code.trace- enable diagnostic output.
These attributes are only available for launch configurations of request type launch:
program- an absolute path to the Node.js program to debug.args- arguments passed to the program to debug. This attribute is of type array and expects individual arguments as array elements.cwd- launch the program to debug in this directory.runtimeExecutable- absolute path to the runtime executable to be used. Default isnode. See section Launch configuration support for 'npm' and other tools.runtimeArgs- optional arguments passed to the runtime executable.runtimeVersion- if "nvm" (or "nvm-windows") or "nvs" is used for managing Node.js versions, this attribute can be used to select a specific version of Node.js. See section Multi version support below.env- optional environment variables. This attribute expects environment variables as a list of string typed key/value pairs.envFile- optional path to a file containing environment variable definitions. See section Load environment variables from external file below.console- the console to launch the program (internalConsole,integratedTerminal,externalTerminal). See section Node Console below.outputCapture- if set tostd, output from the process stdout/stderr will be shown in the Debug Console, instead of listening to output over the debug port. This is useful for programs or log libraries that write directly to the stdout/stderr streams instead of usingconsole.*APIs.
This attribute is only available for launch configurations of request type attach:
restart- restart the connection on termination. See section Restarting debug session automatically.port- debug port to use. See sections Attaching to Node.js and Remote debugging.address- TCP/IP address of the debug port. See sections Attaching to Node.js and Remote debugging.processId- the debugger tries to attach to this process after having sent a USR1 signal. With this setting, the debugger can attach to an already running process that was not started in debug mode. When using theprocessIdattribute, the debug port is determined automatically based on the Node.js version (and the used protocol) and cannot be configured explicitly. So don't specify aportattribute.continueOnAttach- whether to continue the process if it's paused when we attach to it. This option is useful if you launch your program with--inspect-brk.
Launch configurations for common scenarios
You can trigger IntelliSense (⌃Space (Windows, Linux Ctrl+Space)) in your launch.json file to see launch configuration snippets for commonly used Node.js debugging scenarios.
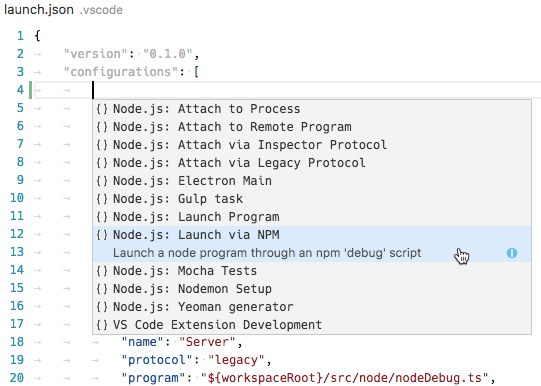
You can also bring up the snippets with the Add Configuration... button in the lower right of the launch.json editor window.

The following snippets are available:
- Launch Program: Launch a Node.js program in debug mode.
- Launch via npm: Launch a Node.js program through an npm 'debug' script. You can use an npm debug script from your launch configuration if it has been defined in your package.json. The debug port used in the npm script must correspond to the port specified in the snippet.
- Attach: Attach to the debug port of a locally running Node.js program. Make sure that the Node.js program to debug has been started in debug mode, and the debug port used is the same as the one specified in the snippet.
- Attach to Remote Program: Attach to the debug port of a Node.js program running on the host specified by the
addressattribute. Make sure that the Node.js program to debug has been started in debug mode, and the debug port used is the same as the one specified in the snippet. To help VS Code map source files between your workspace and the filesystem of the remote host, make sure to specify correct paths for thelocalRootandremoteRootattributes. - Attach by Process ID: Open the process picker to select a node or gulp process for debugging. With this launch configuration, you can even attach to a node or gulp process that was not started in debug mode.
- Nodemon Setup: Use nodemon to relaunch a debug session automatically whenever the JavaScript source has changed. Make sure that you have nodemon installed globally. Note that terminating the debug session only terminates the program to debug, not nodemon itself. To terminate nodemon, press Ctrl+C in the Integrated Terminal.
- Mocha Tests: Debug mocha tests in a
testfolder of your project. Make sure that your project has 'mocha' installed in itsnode_modulesfolder. - Yeoman generator: Debug a yeoman generator. The snippet asks you to specify the name of the generator. Make sure that your project has 'yo' installed in its
node_modulesfolder and that your generated project has been installed for debugging by runningnpm linkin the project folder. - Gulp task: Debug a gulp task. Make sure that your project has 'gulp' installed in its
node_modulesfolder. - Electron Main: Debug the main Node.js process of an Electron application. The snippet assumes that the Electron executable has been installed inside the
node_modules/.bindirectory of the workspace.
Node console
By default, Node.js debug sessions launch the target in the internal VS Code Debug Console. Since the Debug Console does not support programs that need to read input from the console, you can enable either an external terminal or use the VS Code Integrated Terminal by setting the console attribute in your launch configuration to externalTerminal or integratedTerminal respectively. The default is internalConsole.
In an external terminal, you can configure which terminal program to use via the terminal.external.windowsExec, terminal.external.osxExec, and terminal.external.linuxExec settings.
Launch configuration support for 'npm' and other tools
Instead of launching the Node.js program directly with node, you can use 'npm' scripts or other task runner tools directly from a launch configuration:
- You can use any program available on the PATH (for example 'npm', 'mocha', 'gulp', etc.) for the
runtimeExecutableattribute and arguments can be passed viaruntimeArgs. - You do not have to set the
programattribute if your npm script or other tool implicitly specifies the program to launch.
Let's look at an 'npm' example. If your package.json has a 'debug' script, for example:
{
  "name": "Launch via npm",
  "type": "node",
  "request": "launch",
  "cwd": "${workspaceFolder}",
  "runtimeExecutable": "npm",
  "runtimeArgs": ["run-script", "debug"]
}
Multi version support
If you are using 'nvm' (or 'nvm-windows') to manage your Node.js versions, it is possible to specify a runtimeVersion attribute in a launch configuration for selecting a specific version of Node.js:
{
  "type": "node",
  "request": "launch",
  "name": "Launch test",
  "runtimeVersion": "chackracore/8.9.4/x64",
  "program": "${workspaceFolder}/test.js"
}
Make sure to have those Node.js versions installed that you want to use with the runtimeVersion attribute, as the feature will not download and install the version automatically. For example, you'll have to run something like nvm install 7.10.1 or nvs add 7.10.1 from the integrated terminal if you plan to add "runtimeVersion": "7.10.1" to your launch configuration.
If you omit the minor and patch version and have, for example, "runtimeVersion": "14", then the most recent 14.x.y version installed on your system will be used.
Load environment variables from external file
The VS Code Node debugger supports loading environment variables from a file and passing them to the Node.js runtime. To use this feature, add an attribute envFile to your launch configuration and specify the absolute path to the file containing the environment variables:
USER=doe
PASSWORD=abc123

# a comment

# an empty value:
empty=

# new lines expanded in quoted strings:
lines="foo\nbar"
Attaching to Node.js
If you want to attach the VS Code debugger to an external Node.js program, launch Node.js as follows:
node --inspect-brk program.js
Options to attach the debugger to your program:
- Open a "process picker" that lists all potential candidate processes and let you pick one, or
- Create an "attach" configuration that explicitly specifies all configuration options and then press F5.
Let's go through these options in detail:
Attach to Node Process action
The Attach to Node Process command from the Command Palette (⇧⌘P (Windows, Linux Ctrl+Shift+P)) opens a Quick Pick menu that lists all potential processes that are available to the Node.js debugger:

The individual processes listed in the picker show the debug port and process ID. Once you select your Node.js process in that list, the Node.js debugger will try to attach to it.
In addition to Node.js processes, the picker also shows other programs that were launched with one of the various forms --inspect arguments. This makes it possible to attach to Electron's or VS Code's helper processes.
Setting up an "Attach" configuration
This option requires more work but in contrast to the previous two options it allows you to configure various debug configuration options explicitly.
The simplest "attach" configuration looks like this:
{
  "name": "Attach to Process",
  "type": "node",
  "request": "attach",
  "processId": "53426"
}
To avoid repeatedly entering a new process ID in the launch configuration, Node debug supports a command variable PickProcess that will open the process picker (from above).
Using the PickProcess variable the launch configuration looks like this:
tsc --sourceMap --outDir bin app.ts
Babel
For Babel, you'll want to set the sourceMaps option to true, or pass the --source-maps option when compiling your code.
{
  "version": "0.2.0",
  "configurations": [
    {
      "name": "Launch TypeScript",
      "type": "node",
      "request": "launch",
      "program": "app.ts",
      "outFiles": ["${workspaceFolder}/bin/**/*.js"]
    }
  ]
}
Note that the outFiles should match your JavaScript files, not the source map files (which may end in .map instead of .js).
Source Map Resolution
By default, only source maps in your outFiles will be resolved. This behavior is used to prevent dependencies from interfering with breakpoints you set. For example, if you had a file src/index.ts and a dependency had a source map that referenced webpack:///./src/index.ts, that would incorrectly resolve to your source file and could lead to surprising results.
You can configure this behavior by setting the resolveSourceMapLocations option. If set to null, every source map will be resolved. For example, this configuration will additionally allow source maps in node_modules/some-dependency to be resolved:
{
  'webpack:///./~/*': "${workspaceFolder}/node_modules/*",
  'webpack:////*': '/*',
  'webpack://@?:*/?:*/*': "${workspaceFolder}/*",
  // and some more patterns...
}
This maps paths or URLs in the source map from the left to the right. The pattern ?:* is a non-greedy, non-capturing match, and * is a greedy capturing match. The debugger then replaces the corresponding * in the right-hand pattern with the fragment captured from the source map path. For example, the last pattern in the above example would map webpack://@my/package/foo/bar to ${workspaceFolder}/foo/bar.
Note that for browser debugging, the webRoot is used in place of the workspaceFolder in the default sourceMapPathOverrides.
Remote debugging
Note: VS Code now has universal remote development capabilities. Using the Remote Development extensions, Node.js development in remote scenarios and containers is no different than Node.js development in a local setup. This is the recommended way to remote debug Node.js programs. Check out the Getting started section and Remote tutorials to learn more.
If you are unable to use any of the Remote Development extensions to debug your Node.js program, below is a guide on how to debug a remote Node.js program from your local instance of VS Code.
The Node.js debugger supports remote debugging where you attach to a process running on a different machine, or in a container. Specify a remote host via the address attribute. For example:
{
  "type": "node",
  "request": "attach",
  "name": "Attach to remote",
  "address": "TCP/IP address of process to be debugged",
  "port": 9229,
  "localRoot": "${workspaceFolder}",
  "remoteRoot": "C:\\Users\\username\\project\\server"
}
Access Loaded Scripts
If you need to set a breakpoint in a script that is not part of your workspace and therefore cannot be easily located and opened through normal VS Code file browsing, you can access the loaded scripts via the LOADED SCRIPTS view in the Run and Debug view:

The LOADED SCRIPTS view lets you quickly select the script by typing its name or filter the list when Enable Filter on Type is on.
Scripts are loaded into a read-only editor where you can set breakpoints. These breakpoints are remembered across debug sessions but you only have access to the script content while a debug session is running.
Restarting debug sessions automatically when source is edited
The restart attribute of a launch configuration controls whether the Node.js debugger automatically restarts after the debug session has ended. This feature is useful if you use nodemon to restart Node.js on file changes. Setting the launch configuration attribute restart to true makes the node debugger automatically try to reattach to Node.js after Node.js has terminated.
If you have started your program server.js via nodemon on the command line like this:
{
  "name": "Attach to node",
  "type": "node",
  "request": "attach",
  "restart": true,
  "port": 9229
}
Alternatively, you can start your program server.js via nodemon directly with a launch config and attach the VS Code debugger:
  "skipFiles": [
    "${workspaceFolder}/node_modules/**/*.js",
    "${workspaceFolder}/lib/**/*.js"
  ]
all code in the node_modules and lib folders in your project will be skipped. The skipFiles also apply to the location shown when calling console.log and similar methods: the first non-skipped location in the stack will be shown beside the output in the Debug Console.
Built-in core modules of Node.js can be referred to by the 'magic name' <node_internals> in a glob patterns. The following example skips all internal modules:
"skipFiles": [
    "${workspaceFolder}/node_modules/**/*.js",
    "!${workspaceFolder}/node_modules/math/**/*.js"
]
Note: The
legacyprotocol debugger has to emulate theskipFilesfeature because the V8 Debugger Protocol does not support it natively. This might result in slow stepping performance.
Debugging WebAssembly
The JavaScript debugger can debug code compiled into WebAssembly if it includes DWARF debug information. Many toolchains support emitting this information:
- C/C++ with Emscripten: Compile with the
-gflag to emit debug information. - Zig: DWARF information is automatically emittted in the "Debug" build mode.
- Rust: Rust emits DWARF debug information. However, wasm-pack does not yet retain it during the build. So, instead of running
wasm-pack build, users of the common wasm-bindgen/wasm-pack libraries should build manually build using two commands:cargo install wasm-bindgen-clionce to install the necessary command-line tool.cargo build --target wasm32-unknown-unknownto build your library.wasm-bindgen --keep-debug --out-dir pkg ./target/wasm32-unknown-unknown/debug/<library-name>.wasm <extra-arguments>to generate the WebAssembly bindings, replacing<library-name>with the name from your Cargo.toml and configuring<extra-arguments>as necessary.
After you have your code built, you'll want to install the WebAssembly DWARF Debugging extension. This is shipped as a separate extension in order to keep the VS Code core 'streamlined.' Once installed, restart any active debugging sessions, and native code should then be mapped in the debugger! You should see your source code appear in the Loaded Sources view, and breakpoints should work.
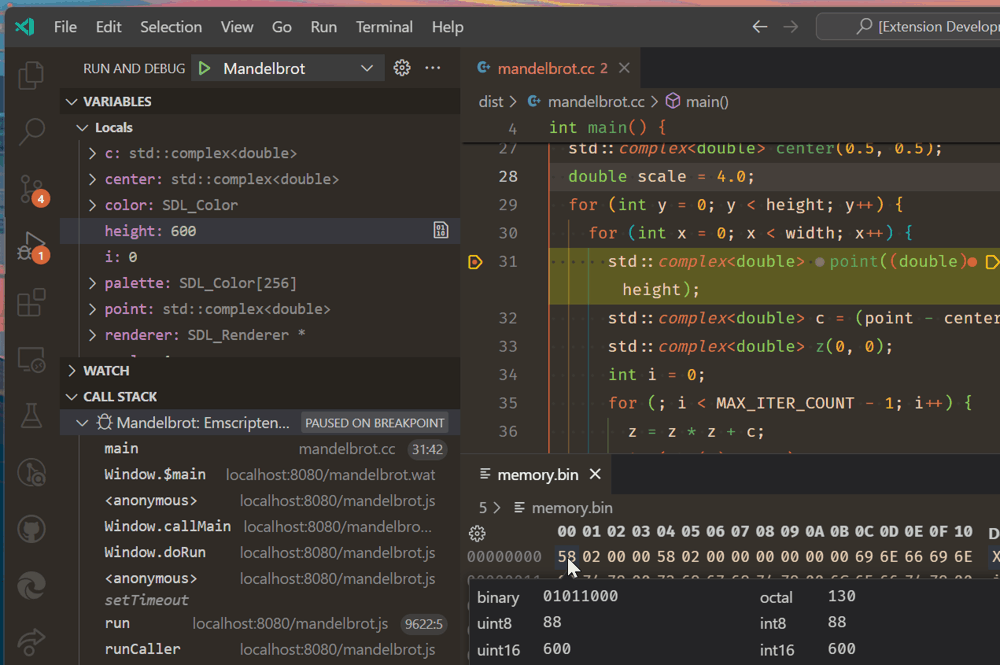
In the image below, the debugger is stopped on a breakpoint in C++ source code that creates a Mandelbrot fractal. The call stack is visible, with frames from the JavaScript code, to WebAssembly, to the mapped C++ code. You can also see the variables in the C++ code, and an edit to the memory associated with the int32 height variable.
While close to parity, debugging WebAssembly is a little different than ordinary JavaScript:
- Variables in the Variables view cannot be edited directly. However, you can select the View Binary Data action beside the variable to edit their associated memory.
- Basic expression evaluation in the Debug Console and Watch views is provided by lldb-eval. This is different than ordinary JavaScript expressions.
- Locations not mapped to source code will be shown in disassembled WebAssembly Text Format. For WebAssembly, the command Disable Source Map Stepping will cause the debugger to step only in disassembled code.
VS Code's WebAssembly debugging is built upon the C/C++ Debugging Extension from the Chromium authors.
Supported Node-like runtimes
The current VS Code JavaScript debugger supports Node version at or above 8.x, recent Chrome versions, and recent Edge versions (via the msedge launch type).
Next steps
In case you didn't already read the Node.js section, take a look at:
- Node.js - End to end Node scenario with a sample application
To see a tutorial on the basics of debugging in VS Code, check out this video:
To learn about VS Code's task running support, go to:
- Tasks - Running tasks with Gulp, Grunt, and Jake. Showing Errors and Warnings
To write your own debugger extension, visit:
- Debugger Extension - Steps to create a VS Code debug extension starting from a mock sample
Common questions
Can I debug if I'm using symlinks?
Yes, if you've created symlinks for folders inside your project, such as with npm link, you can debug the symlinked sources by telling the Node.js runtime to preserve symlinked paths. Use the node.exe --preserve-symlinks switch in your launch configuration runtimeArgs attribute. runtimeArgs, an array of strings, are passed to the debugging session runtime executable, which defaults to node.exe.
export NODE_OPTIONS="$NODE_OPTIONS --some-other-option=here"
8/12/2026