Use the tips and tricks in this article to jump right in and learn how to be productive with Visual Studio Code. Become familiar with the powerful editing, code intelligence, and source code control features and learn useful keyboard shortcuts. Make sure to explore the other in-depth topics in Getting Started and the User Guide to learn more.
If you're just getting started, make sure to check out the VS Code tutorial for a step-by-step to discover the key features.
If you don't have Visual Studio Code installed, go to the Download page. You can find platform specific setup instructions at Running VS Code on Linux, macOS, and Windows.
Prefer a video? You can watch the VS Code Day talks Visual Studio Code tips and tricks or Elevate your VS Code experience.
Basics
Getting started
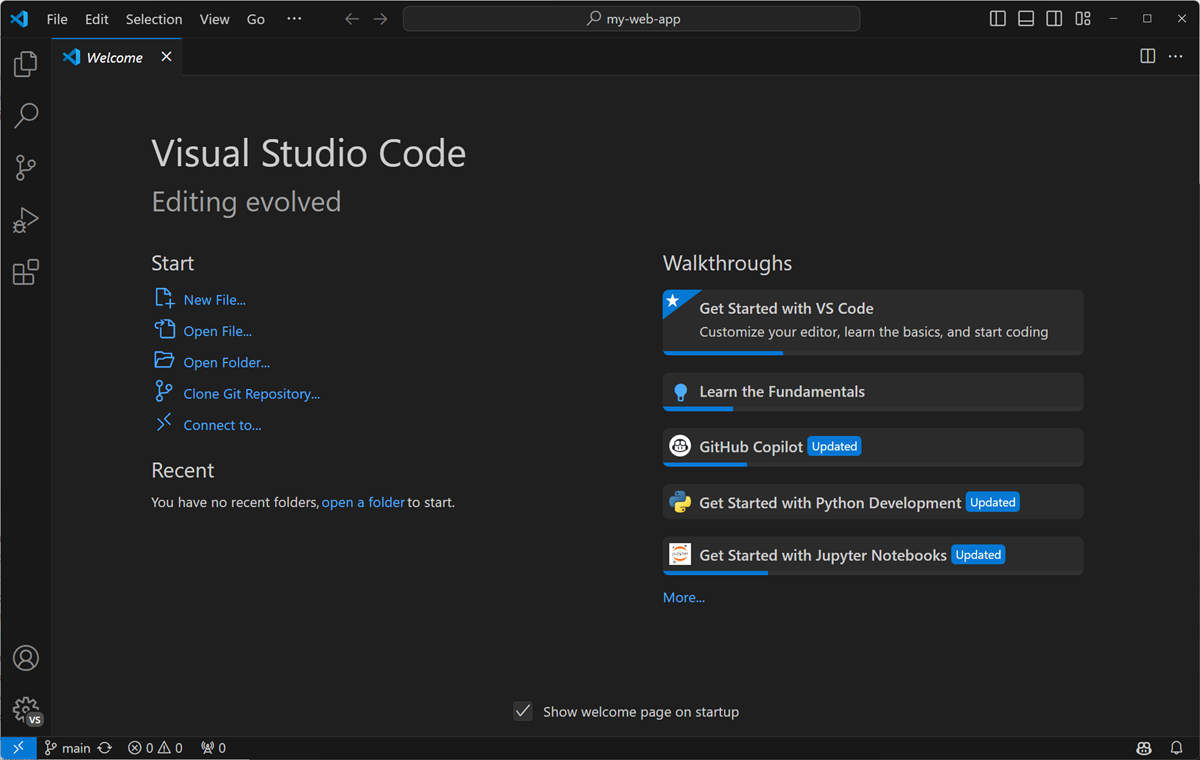
The best way of exploring VS Code hands-on is to open the Welcome page and then pick a Walkthrough for a self-guided tour through the setup steps, features, and deeper customizations that VS Code offers. As you discover and learn, the walkthroughs track your progress.
Open the Welcome page from the Help > Welcome menu or use the Help: Welcome command from the Command Palette (⇧⌘P (Windows, Linux Ctrl+Shift+P)).
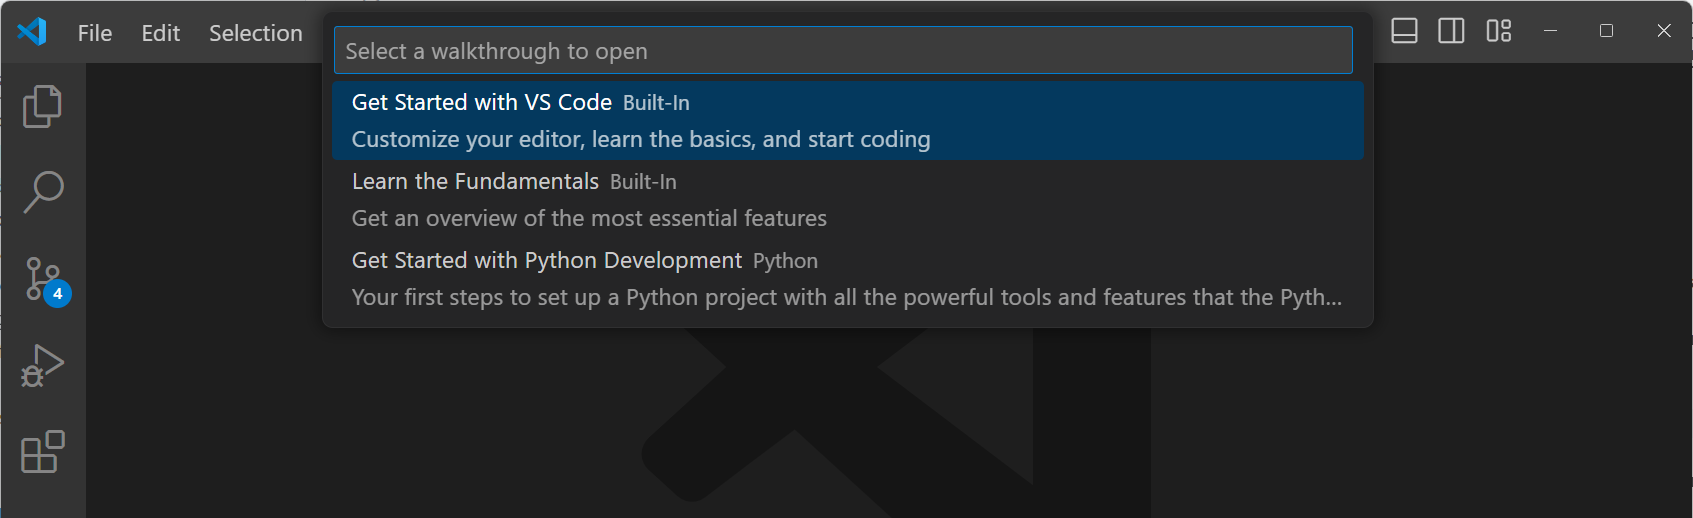
Extensions can also contribute walkthroughs. You can also directly open a walkthrough by using the Help: Open Walkthrough... command from the Command Palette (⇧⌘P (Windows, Linux Ctrl+Shift+P)).
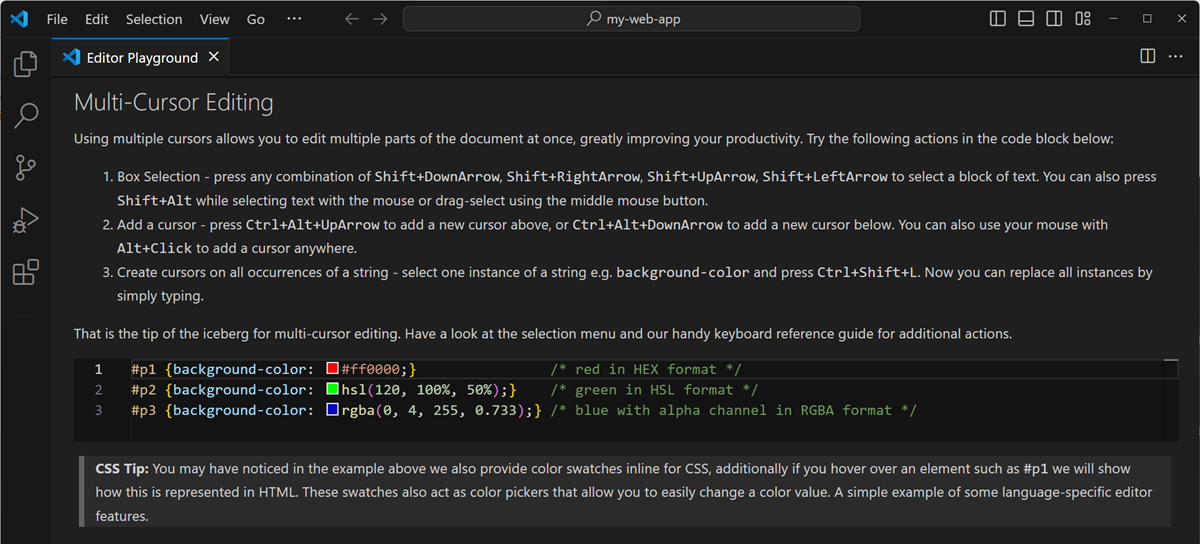
If you are looking to improve your code editing skills, open the Interactive Editor Playground. Try out VS Code's code editing features, like multi-cursor editing, IntelliSense, Snippets, Emmet, and more.
Open the Welcome page from the Help > Editor Playground menu or use the Help: Interactive Editor Playground command from the Command Palette (⇧⌘P (Windows, Linux Ctrl+Shift+P)).
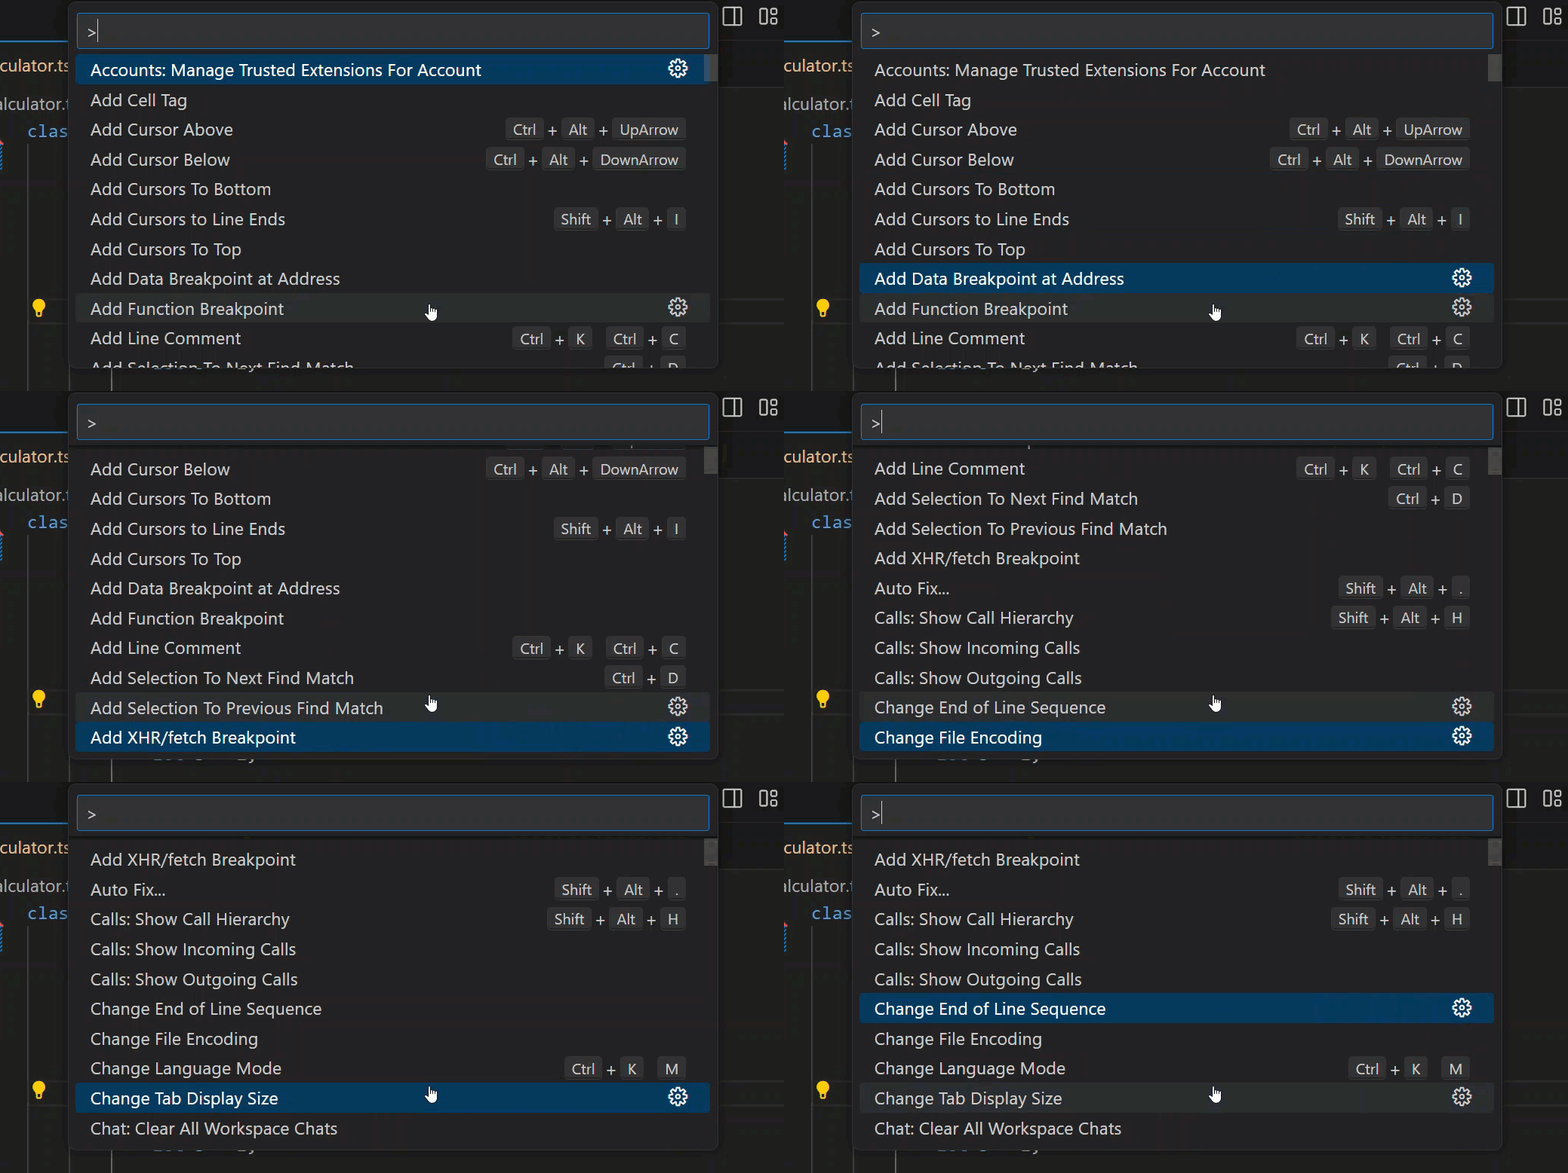
Command Palette
Access all available commands based on your current context.
Keyboard Shortcut: ⇧⌘P (Windows, Linux Ctrl+Shift+P)
Tip
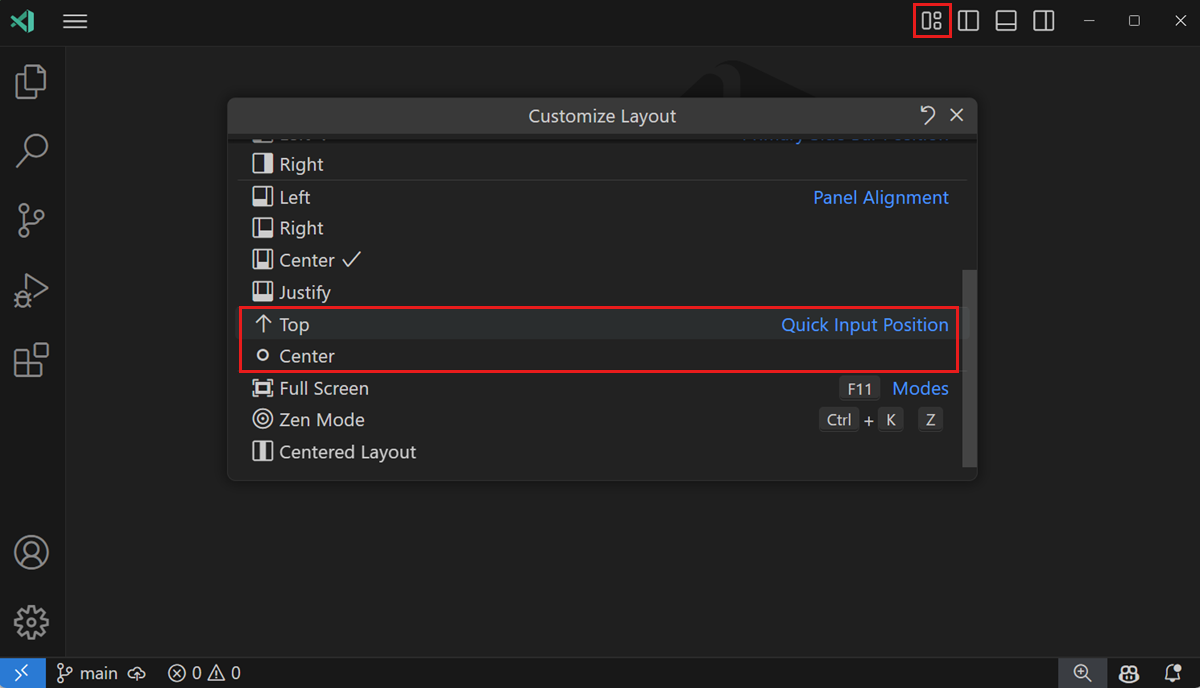
You can move the Command Palette to another location by grabbing the top edge with the mouse cursor and dragging it somewhere else. You can also select the Customize Layout control in the title bar, and then select one of the preconfigured Quick Input Positions.
Default keyboard shortcuts
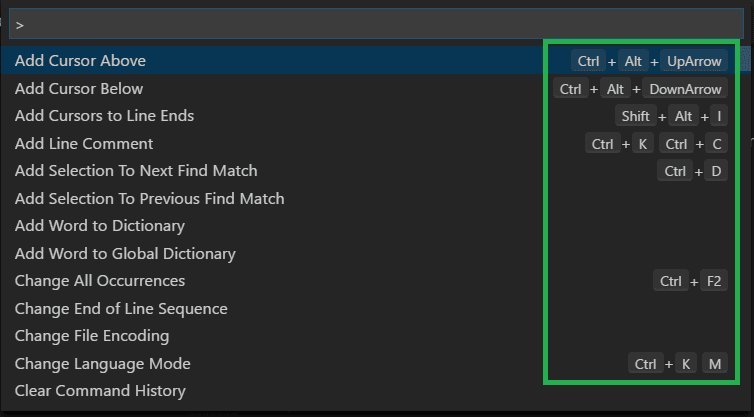
Many of the commands in the Command Palette have default keyboard shortcuts associated with them. You can see the default keyboard shortcut alongside the command in the Command Palette (⇧⌘P (Windows, Linux Ctrl+Shift+P)).
Keyboard reference sheets
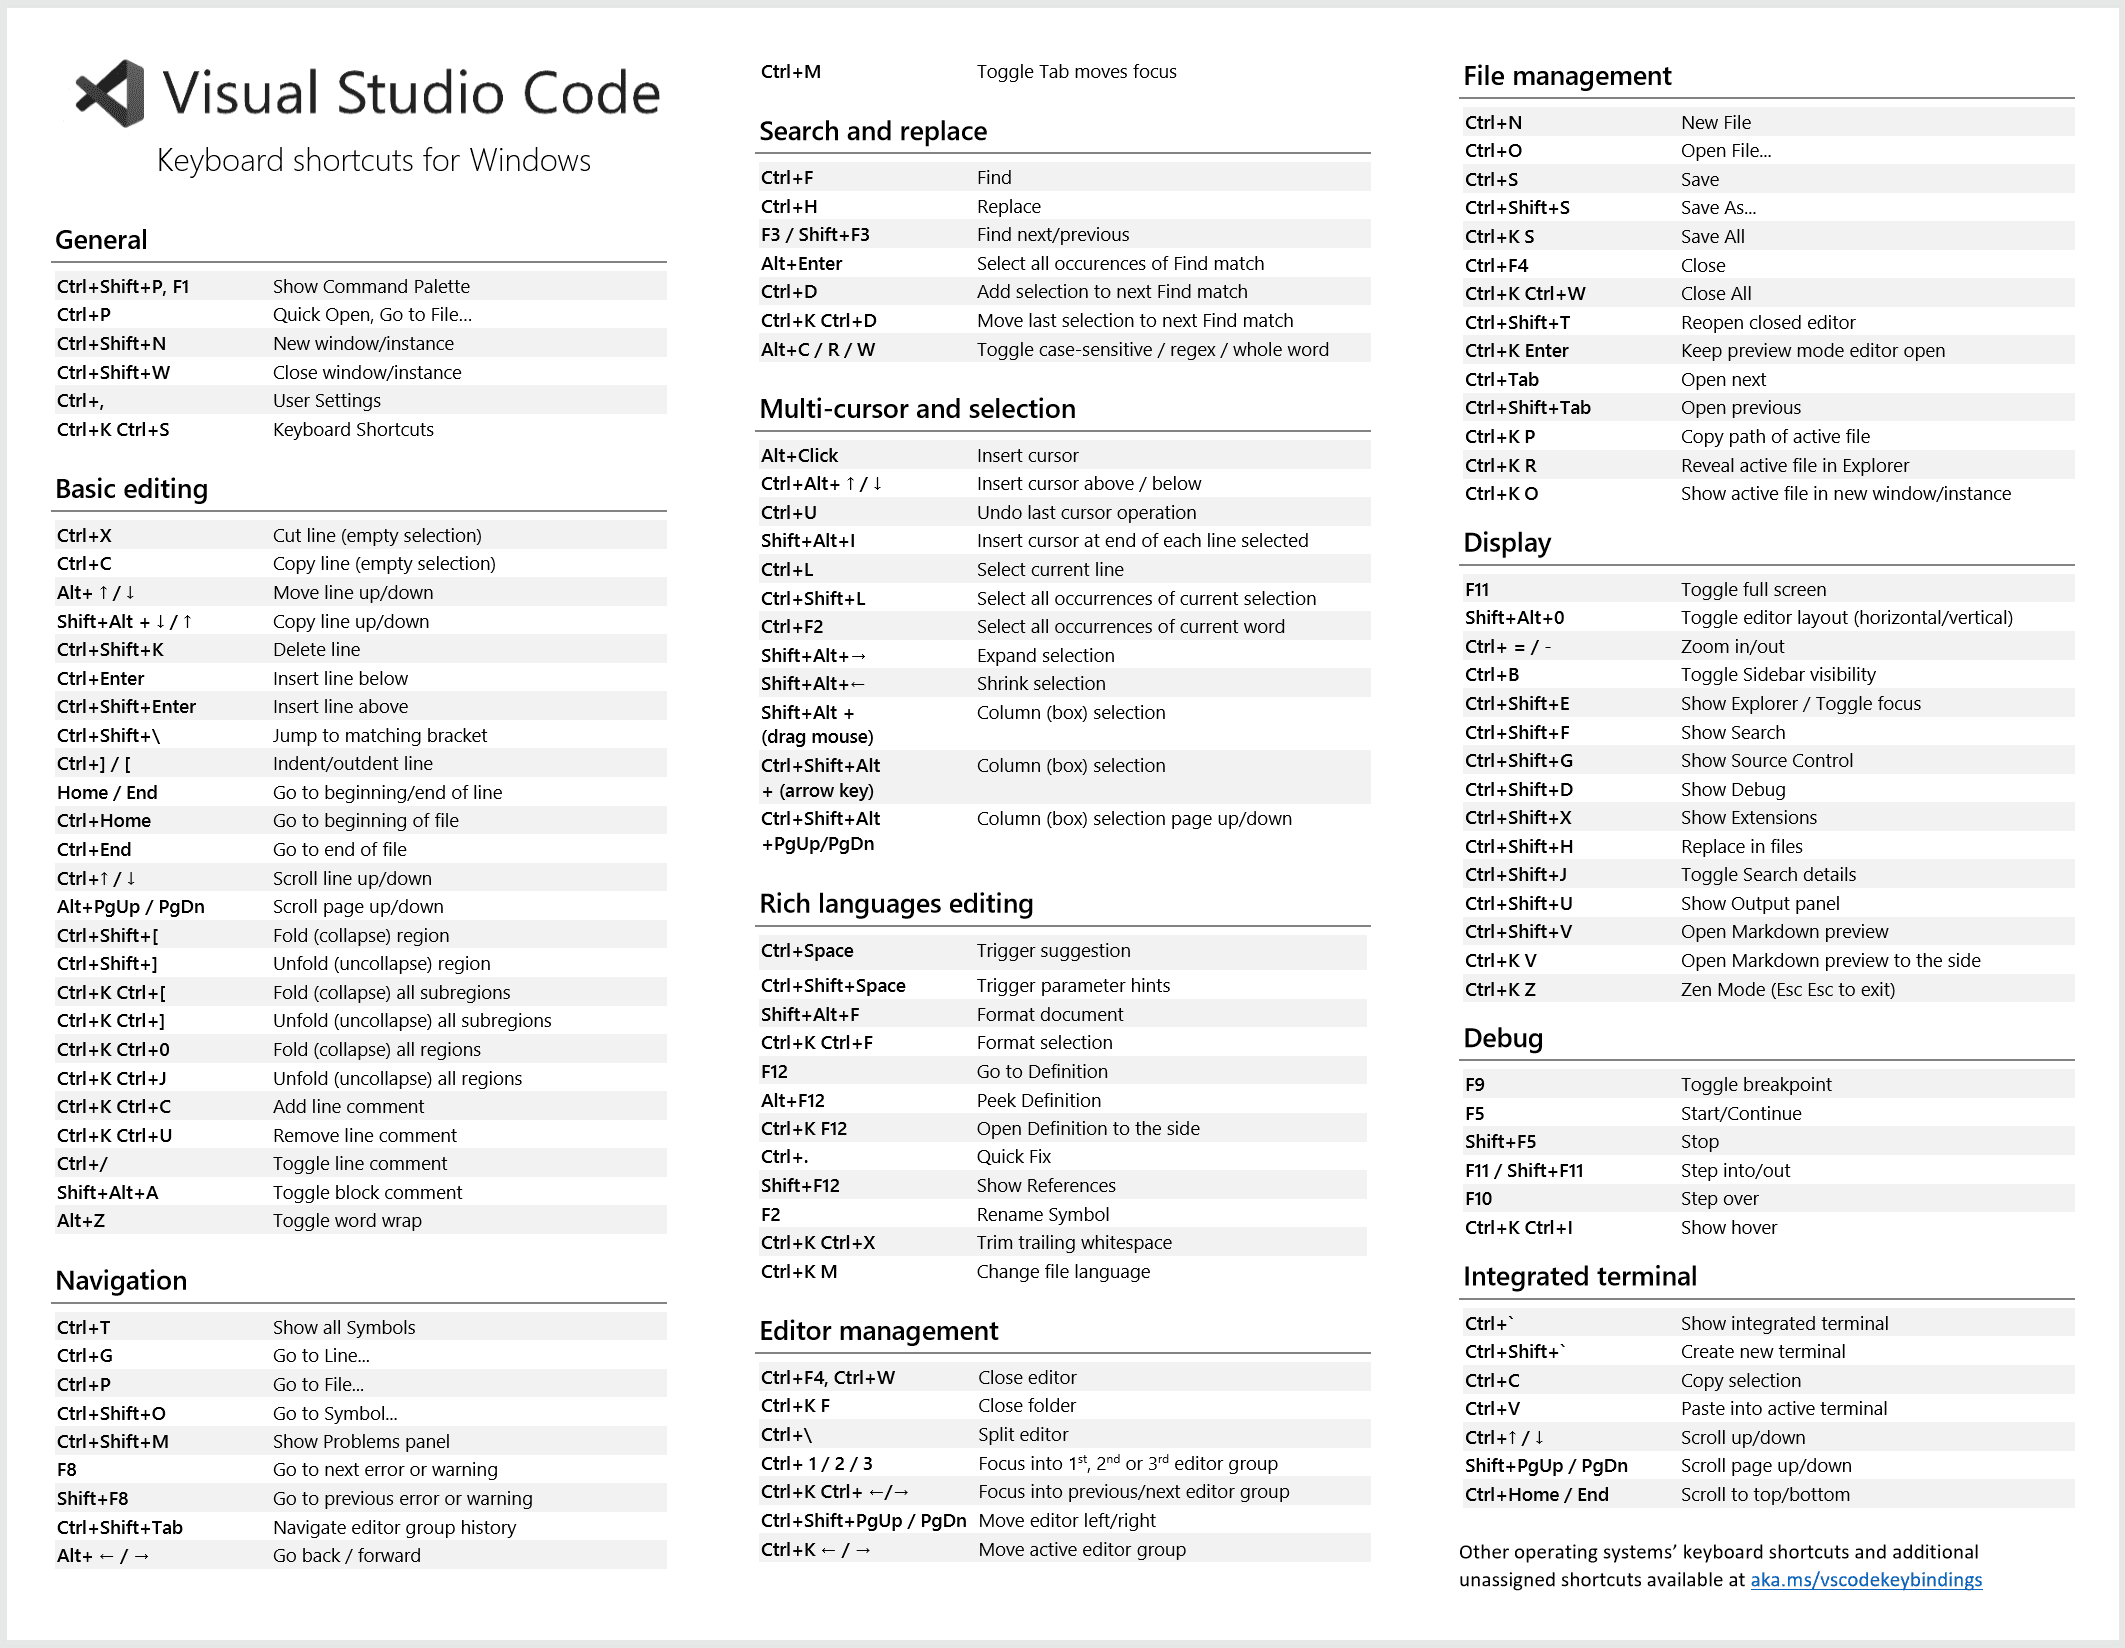
Download the keyboard shortcut reference sheet for your platform (macOS, Windows, Linux).
Floating windows
You can open an editor, the terminal, or specific views in a floating window, for example to move the editor to another place on your monitor or even to another monitor.
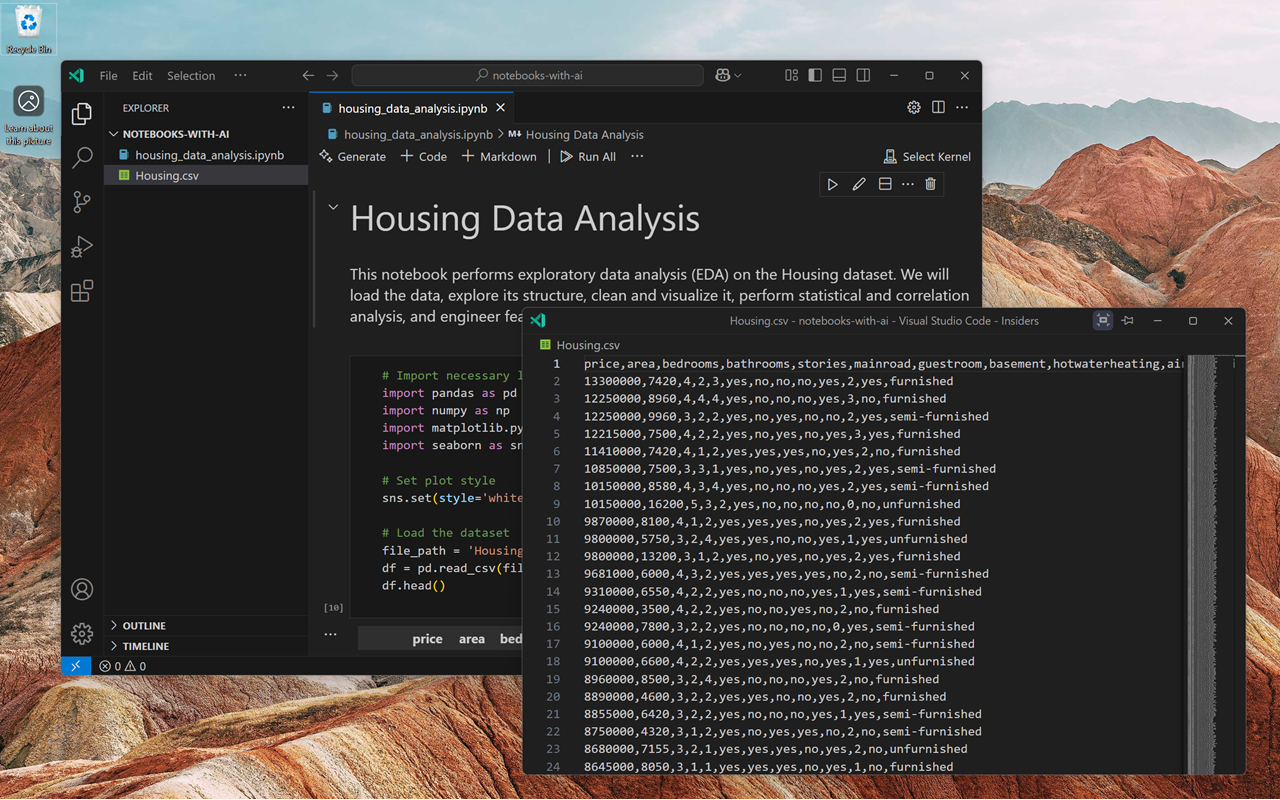
Drag an editor tab out of the current VS Code window to open it in a floating window. Alternatively, use the Move into New Window or Copy into New Window context options from the editor tab.
Integrated terminal
Keyboard Shortcut: ⌃` (Windows, Linux Ctrl+`)
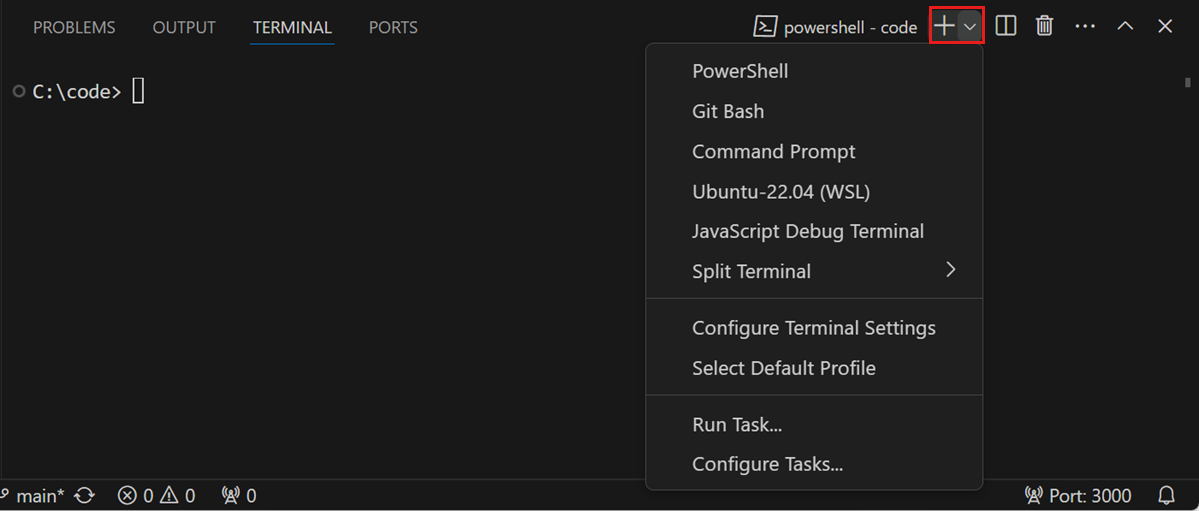
You can select another terminal shell from the dropdown. Depending on your operating system and system configuration, you might see different shells listed.
Further reading:
- Integrated Terminal documentation
- Mastering VS Code's Terminal article
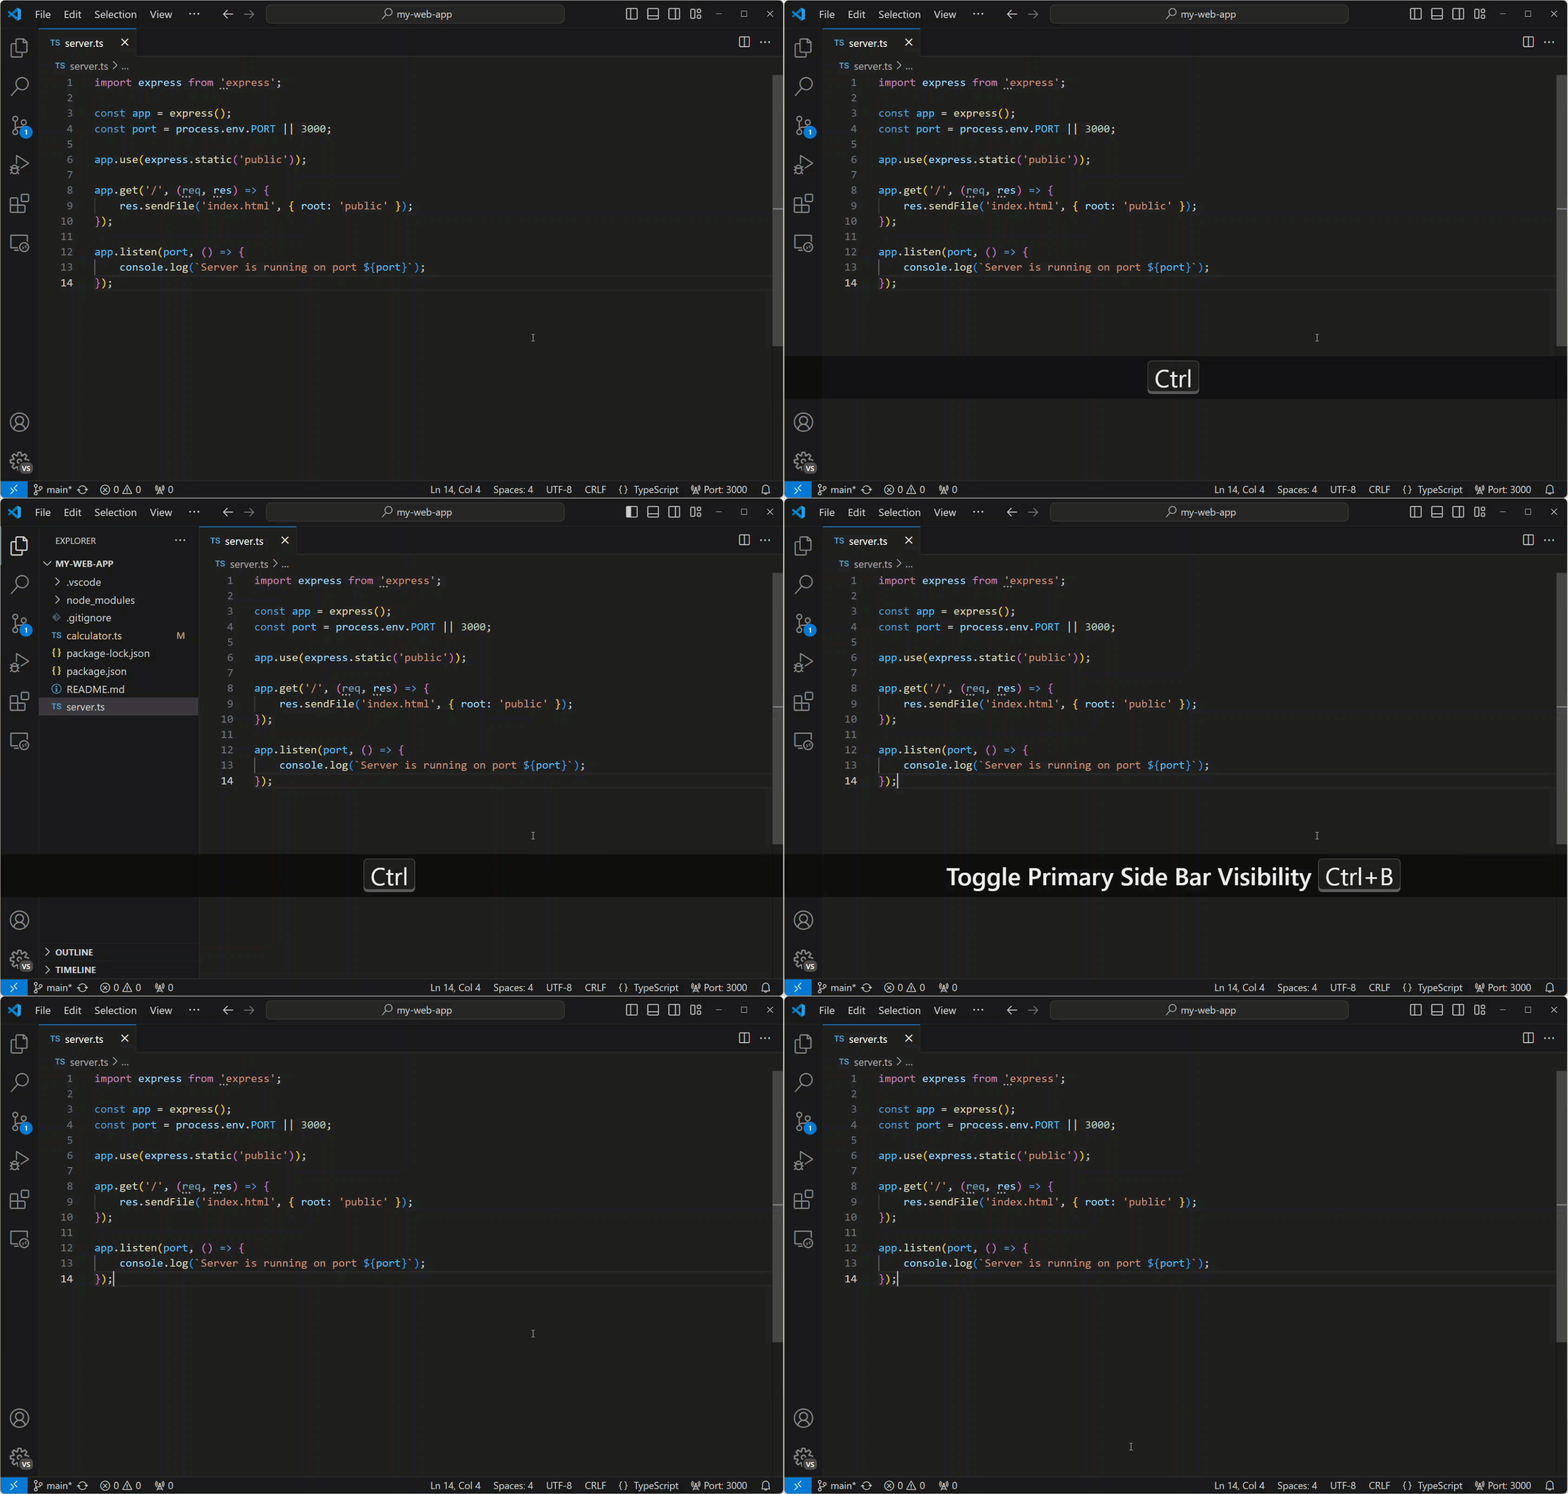
Keyboard Shortcut: ⌘B (Windows, Linux Ctrl+B)
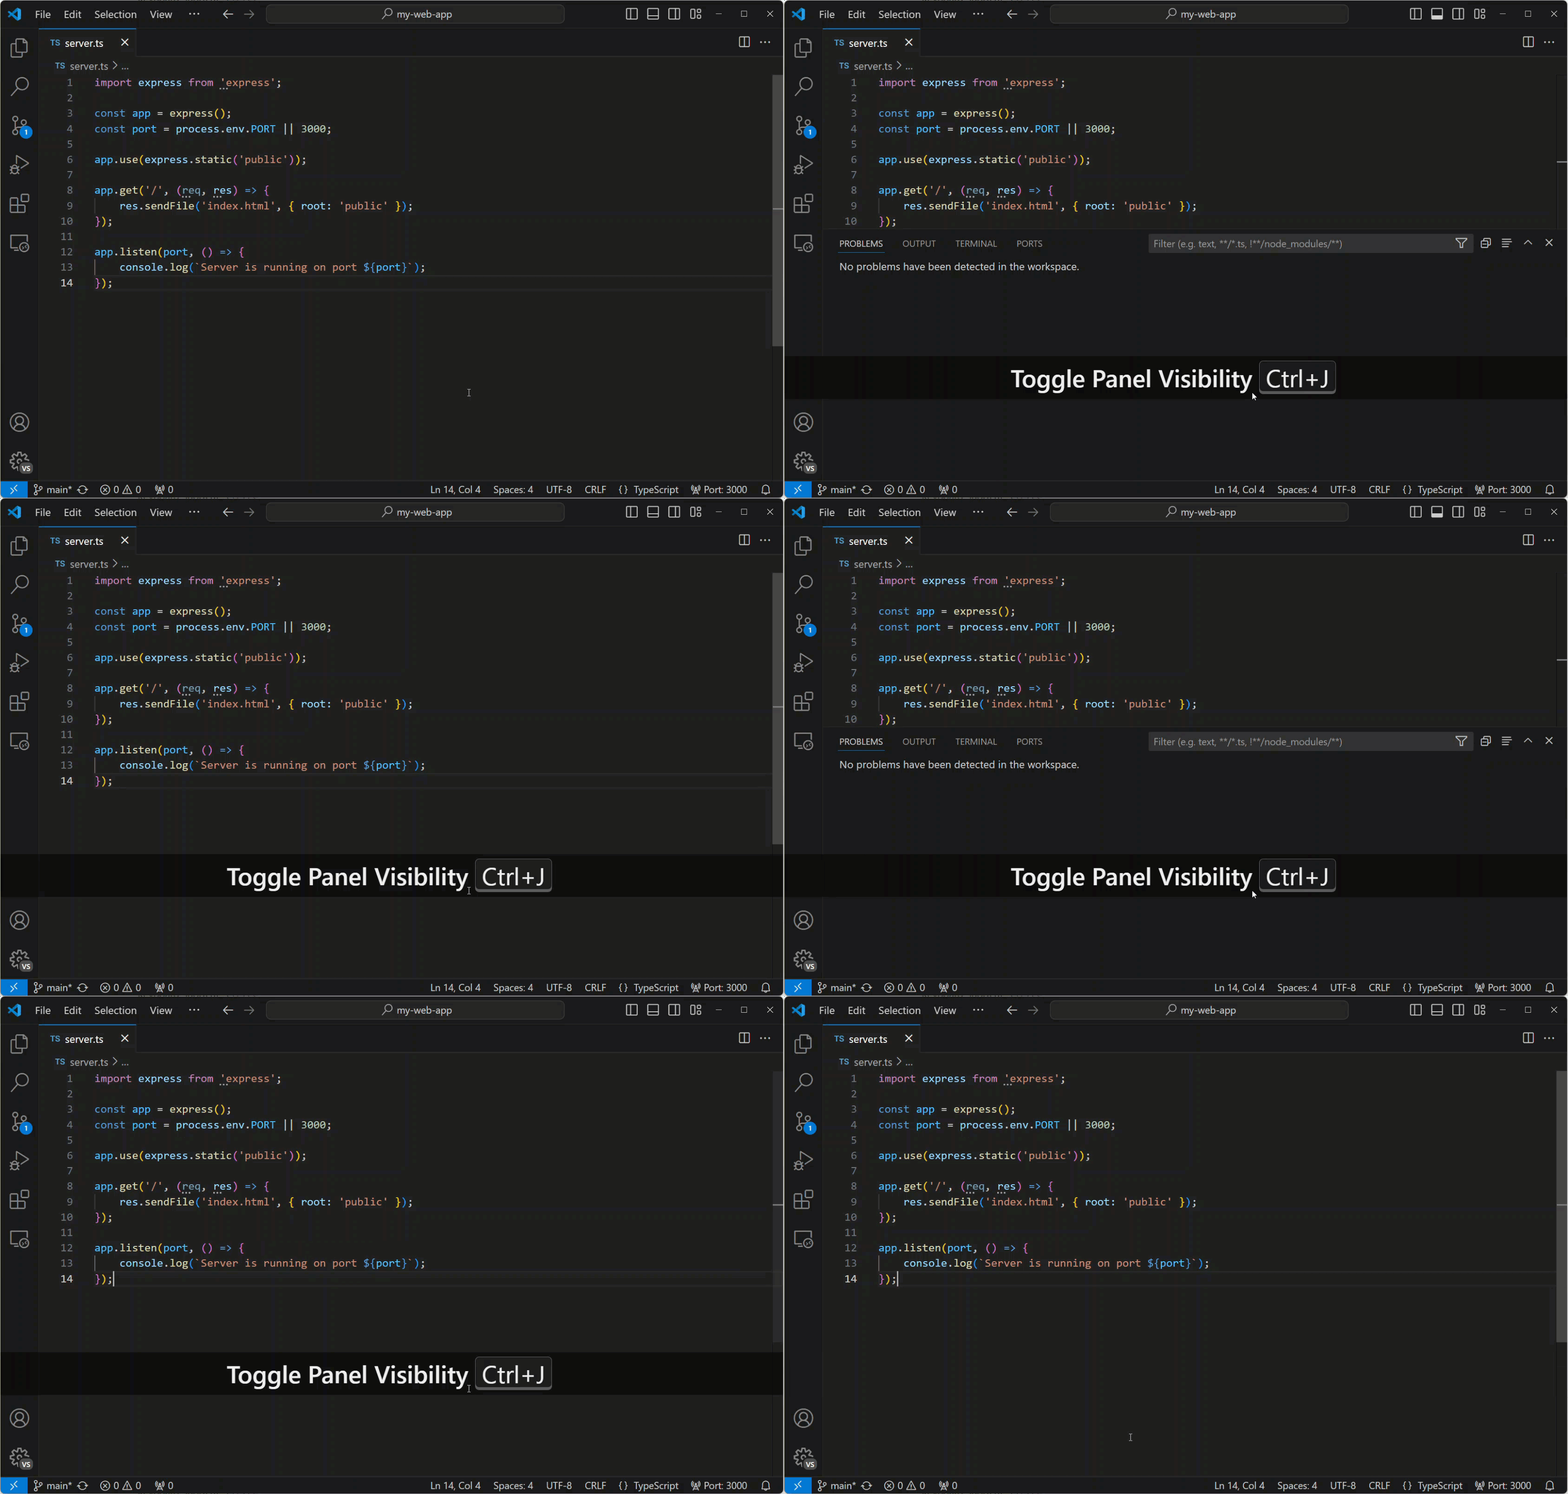
Toggle Panel
Keyboard Shortcut: ⌘J (Windows, Linux Ctrl+J)
Zen mode
Enter distraction-free Zen mode.
Keyboard Shortcut: ⌘K Z (Windows, Linux Ctrl+K Z)
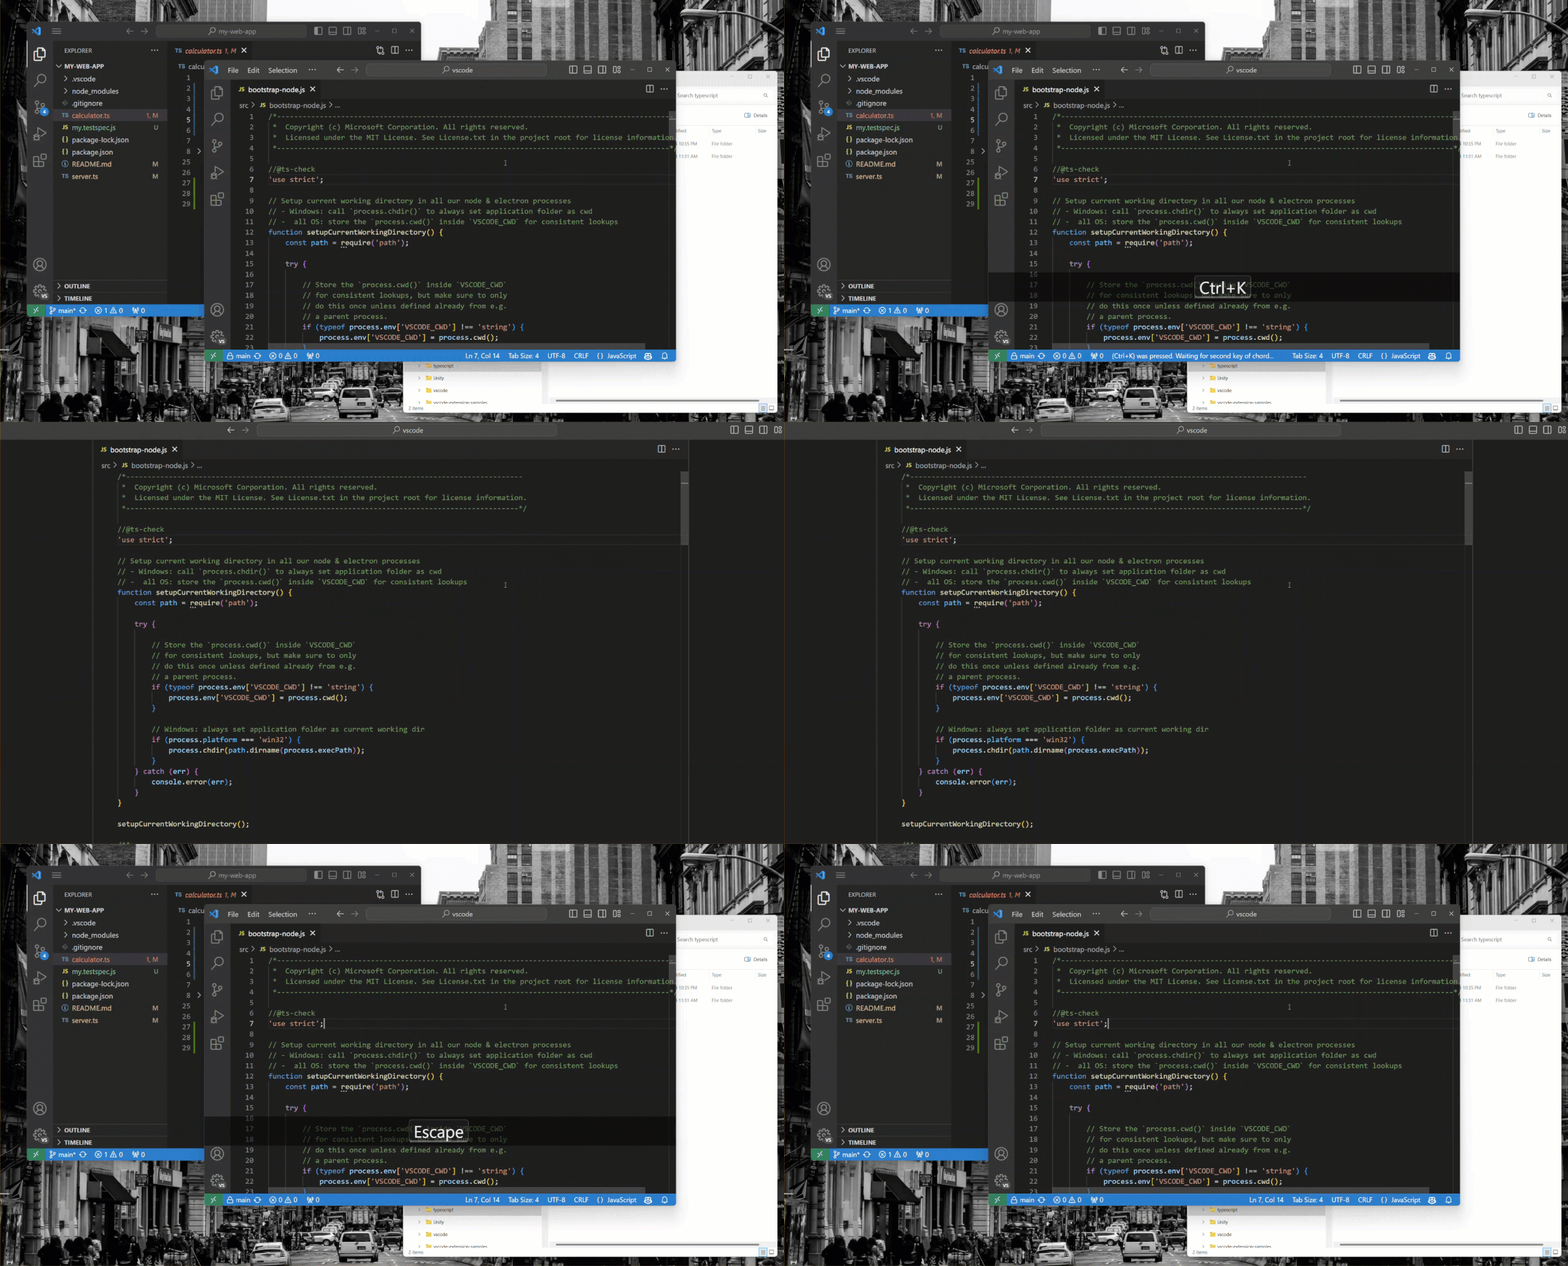
Press Esc twice to exit Zen Mode.
Command line
VS Code has a powerful command line interface (CLI) which enables you to customize how the editor is launched to support various scenarios. For example, you can start VS Code from the command line to open a diff editor for comparing two files.
Make sure the VS Code binary is on your path so you can simply type 'code' to launch VS Code. See the platform specific setup topics if VS Code is added to your environment path during installation (Running VS Code on Linux, macOS, Windows).
// Main editor
"editor.fontSize": 18,
// Terminal panel
"terminal.integrated.fontSize": 14,
// Output panel
"[Log]": {
    "editor.fontSize": 15
}
Change the zoom level
"editor.fontFamily": "Fira Code",
"editor.fontLigatures": true
Tip: You need to have a font installed that supports font ligatures. FiraCode is a popular font on the VS Code team.
Auto Save
"editor.formatOnSave": true
Format on paste
"editor.tabSize": 4
Spaces or Tabs
"editor.renderWhitespace": "all"
Whitespace characters are rendered by default in text selection.
Ignore files / folders
Removes these files / folders from your editor window.
"search.exclude": {
    "someFolder/": true,
    "somefile": true
}
Learn about the many other customizations.
Language specific settings
You can scope settings for specific languages by using the language identifier. You can find a list of commonly used language IDs in the Language Identifiers reference.
"json.schemas": [
    {
        "fileMatch": [
            "bower.json"
        ],
        "url": "https://json.schemastore.org/bower"
    }
]
or for a schema defined in your workspace:
"json.schemas": [
    {
        "fileMatch": [
            "/.myconfig"
        ],
        "schema": {
            "type": "object",
            "properties": {
                "name" : {
                    "type": "string",
                    "description": "The name of the entry"
                }
            }
        }
    }
]
See more in the JSON documentation.
Configure the default browser
In VS Code, you can Ctrl+click (Cmd+click on macOS) on a link to open it in your default browser. You can configure the default browser by setting the workbench.externalBrowser setting.
Specify the full path to the browser executable as the settings value. Alternatively, to ensure correct functioning across devices, you can also use browser aliases, such as edge, chrome, or firefox.
"files.associations": {
    ".database": "json"
}
Preventing dirty writes
VS Code will show you an error message when you try to save a file that cannot be saved because it has changed on disk. VS Code blocks saving the file to prevent overwriting changes that have been made outside of the editor.
To resolve the save conflict, select the Compare action in the notification popup to open a diff editor that shows you the contents of the file on disk (to the left) compared to the contents in VS Code (on the right):
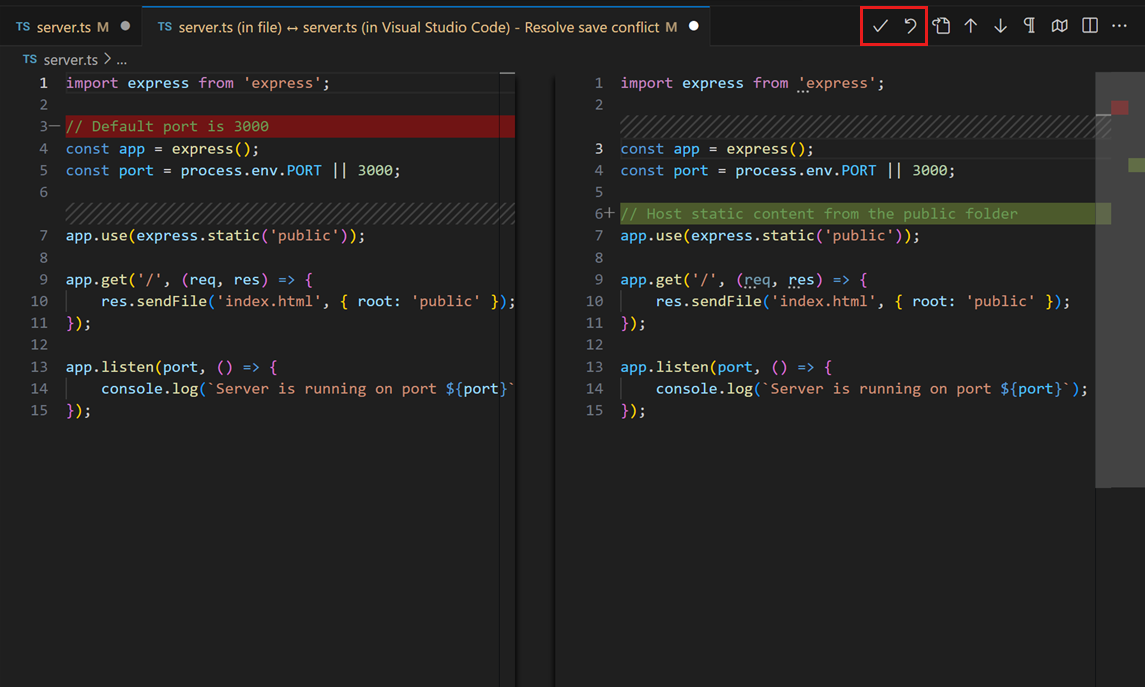
Use the actions in the editor toolbar to resolve the save conflict. You can either Accept your changes and thereby overwriting any changes on disk, or Revert to the version on disk. Reverting means that your changes will be lost.
Note: The file remains dirty and cannot be saved until you pick one of the two actions to resolve the conflict.
Editing hacks
Here is a selection of common features for editing code. If you're more familiar with the keyboard shortcuts for another editor, consider installing a keymap extension.
Tip: You can see recommended keymap extensions in the Extensions view by filtering the search to @recommended:keymaps.
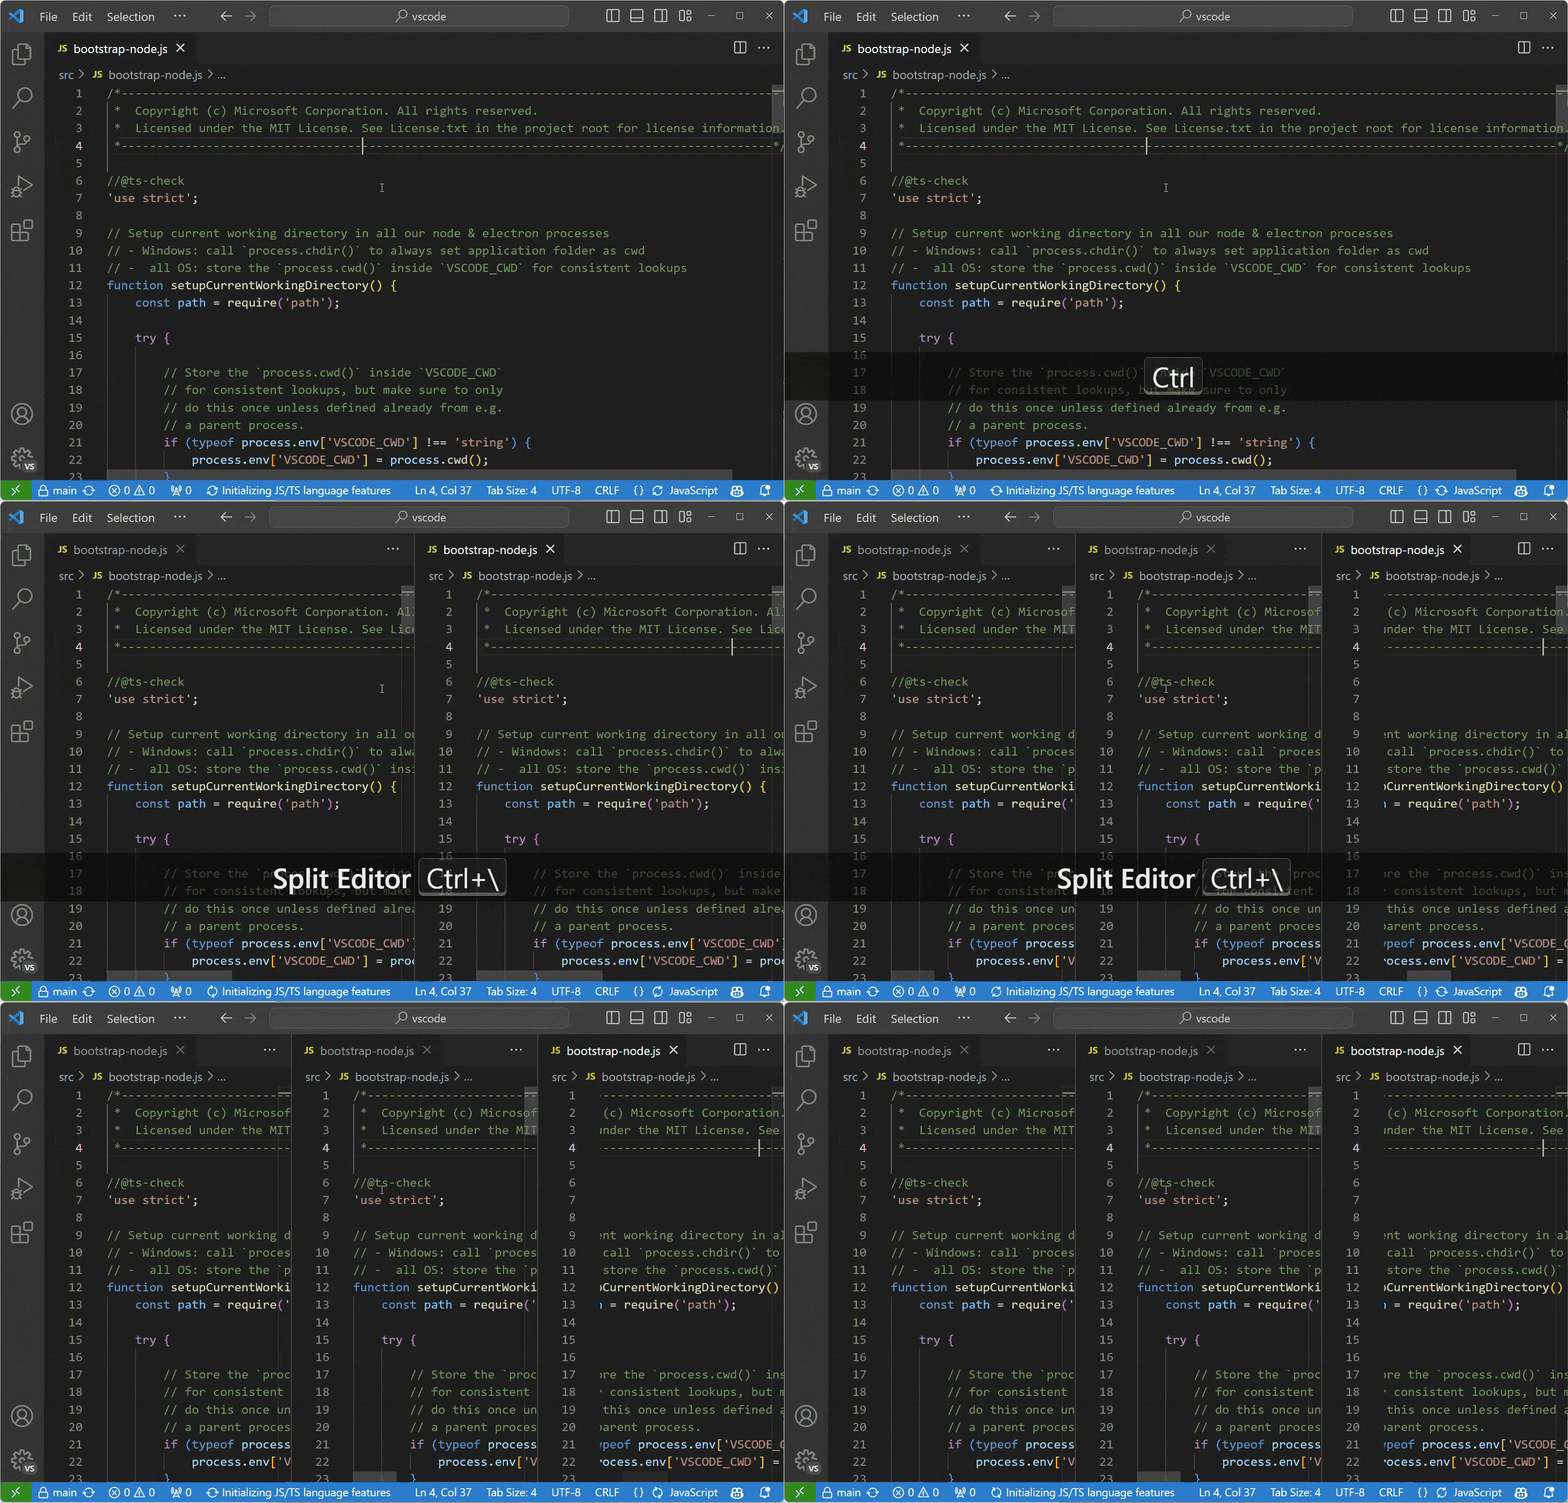
Side by side editing
Keyboard Shortcut: ⌘\ (Windows, Linux Ctrl+\)
You can also drag and drop editors to create new editor groups and move editors between groups.
Switch between editors
Keyboard Shortcut: ⌘1 (Windows, Linux Ctrl+1), ⌘2 (Windows, Linux Ctrl+2), ⌘3 (Windows, Linux Ctrl+3)

Multi cursor selection
To add cursors at arbitrary positions, select a position with your mouse and use Alt+Click (Option+Click on macOS).
To set cursors above or below the current position use:
Keyboard Shortcut: ⌥⌘↑ (Windows Ctrl+Alt+Up, Linux Shift+Alt+Up) or ⌥⌘↓ (Windows Ctrl+Alt+Down, Linux Shift+Alt+Down)
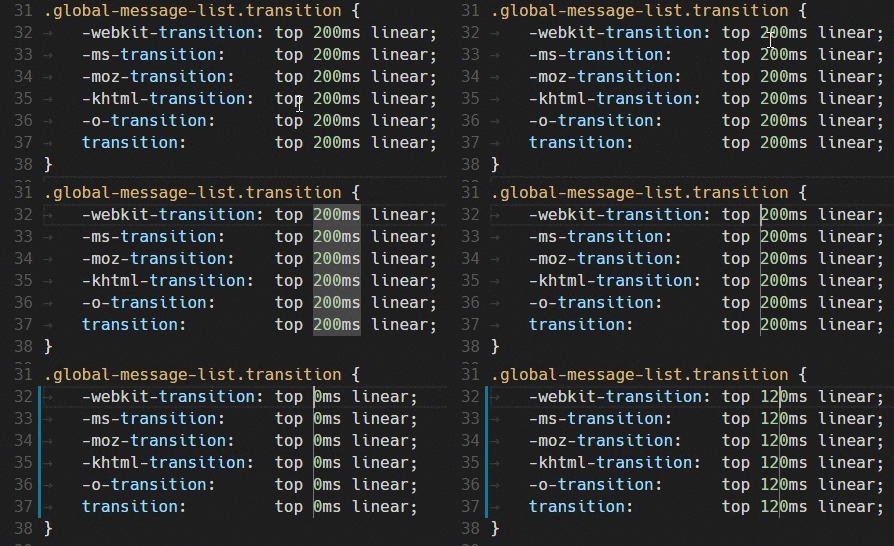
You can add additional cursors to all occurrences of the current selection with ⇧⌘L (Windows, Linux Ctrl+Shift+L).
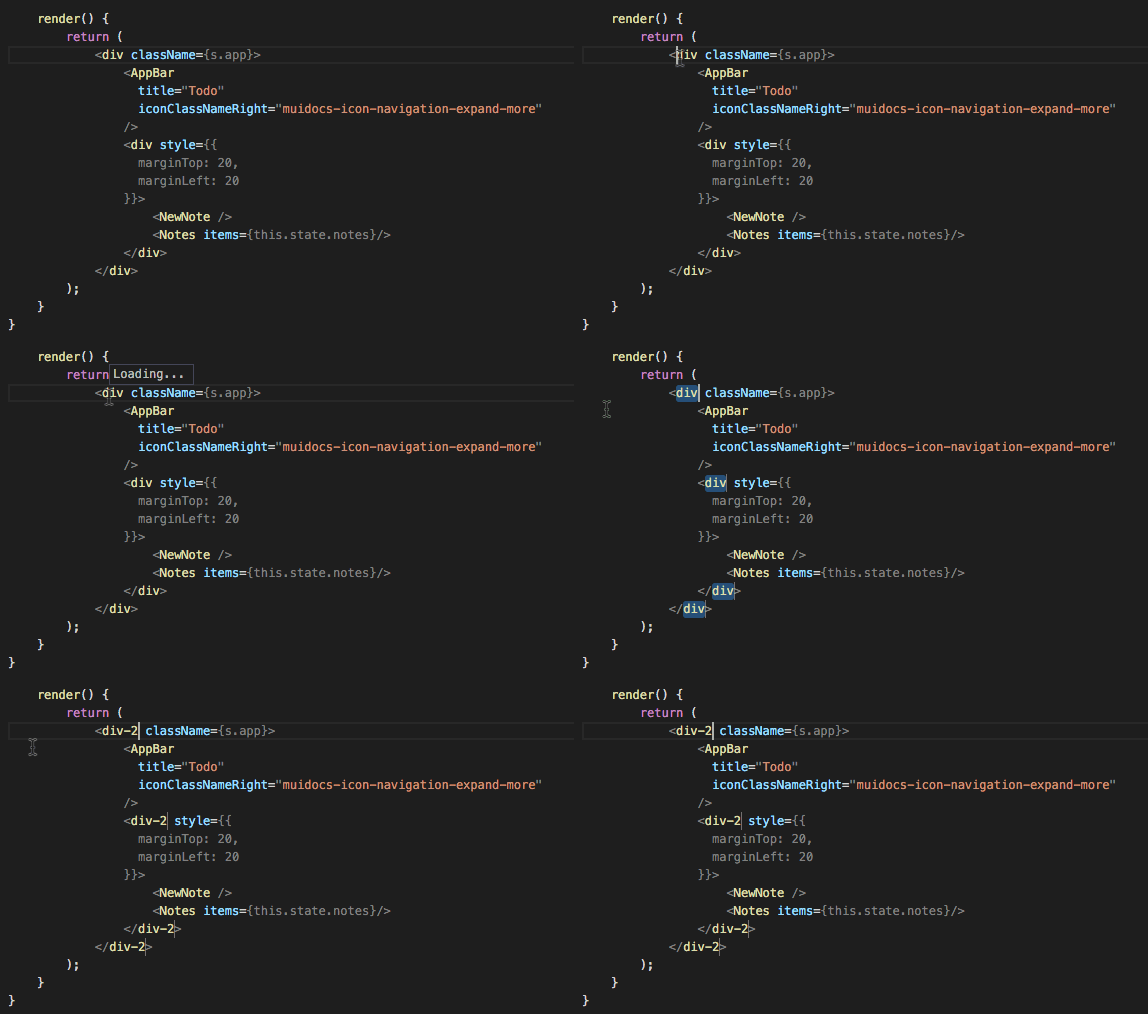
Note: You can also change the modifier to Ctrl/Cmd for applying multiple cursors with the editor.multiCursorModifier setting . See Multi-cursor Modifier for details.
If you do not want to add all occurrences of the current selection, you can use ⌘D (Windows, Linux Ctrl+D) instead. This only selects the next occurrence after the one you selected so you can add selections one by one.
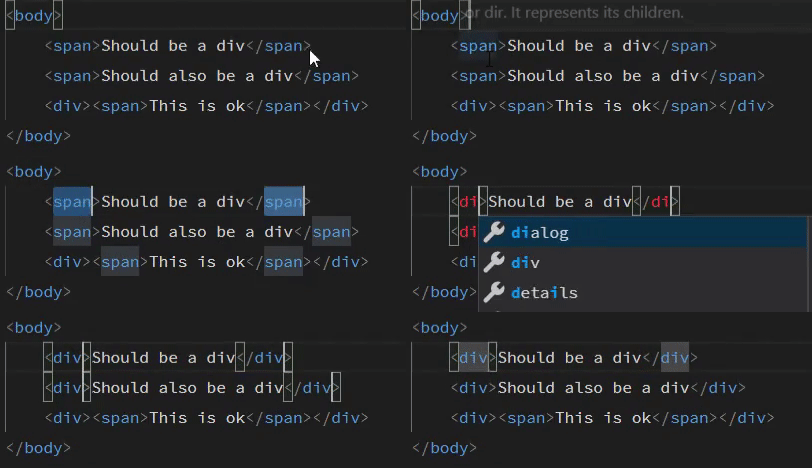
Column (box) selection
You can select blocks of text by holding Shift+Alt (Shift+Option on macOS) while you drag your mouse. A separate cursor will be added to the end of each selected line.
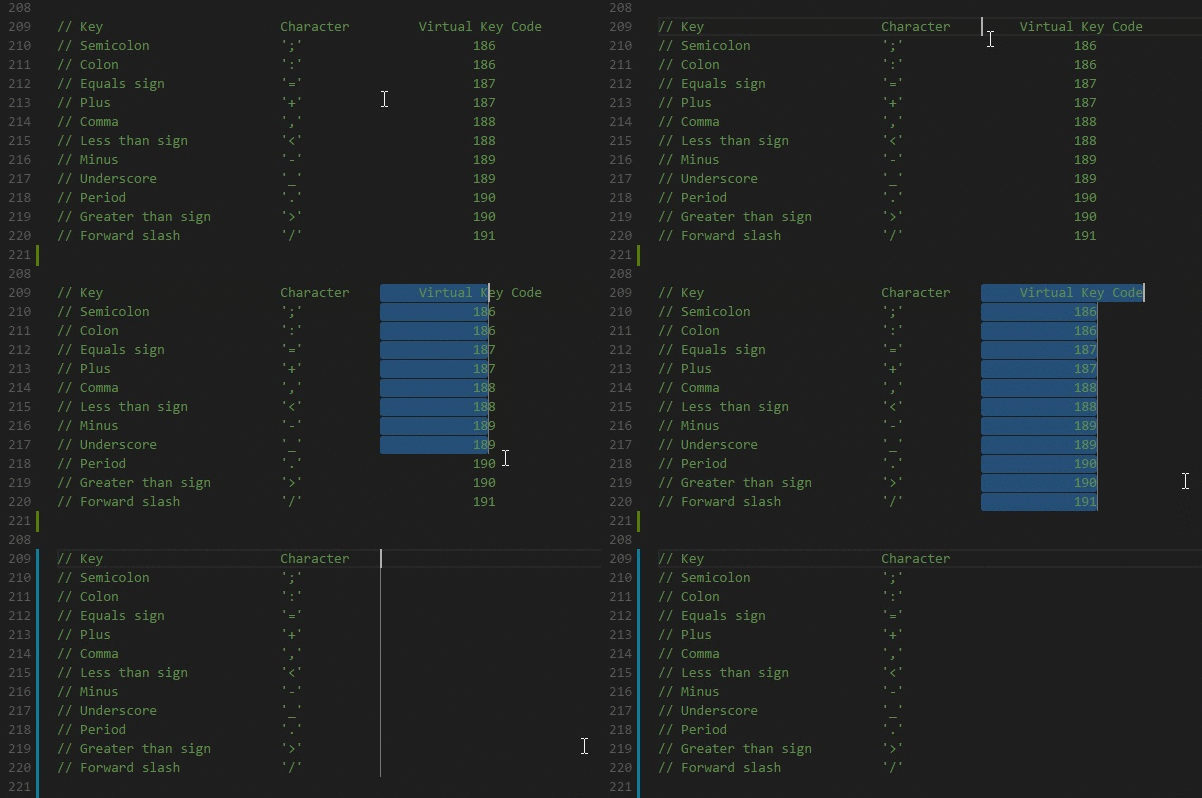
You can also use keyboard shortcuts to trigger column selection.
Vertical rulers
You can add vertical column rulers to the editor with the editor.rulers setting, which takes an array of column character positions where you'd like vertical rulers.
{
  "env": {
    "browser": true,
    "commonjs": true,
    "es6": true,
    "node": true
  },
  "parserOptions": {
    "ecmaVersion": 6,
    "sourceType": "module",
    "ecmaFeatures": {
      "jsx": true,
      "classes": true,
      "defaultParams": true
    }
  },
  "rules": {
    "no-const-assign": 1,
    "no-extra-semi": 0,
    "semi": 0,
    "no-fallthrough": 0,
    "no-empty": 0,
    "no-mixed-spaces-and-tabs": 0,
    "no-redeclare": 0,
    "no-this-before-super": 1,
    "no-undef": 1,
    "no-unreachable": 1,
    "no-use-before-define": 0,
    "constructor-super": 1,
    "curly": 0,
    "eqeqeq": 0,
    "func-names": 0,
    "valid-typeof": 1
  }
}
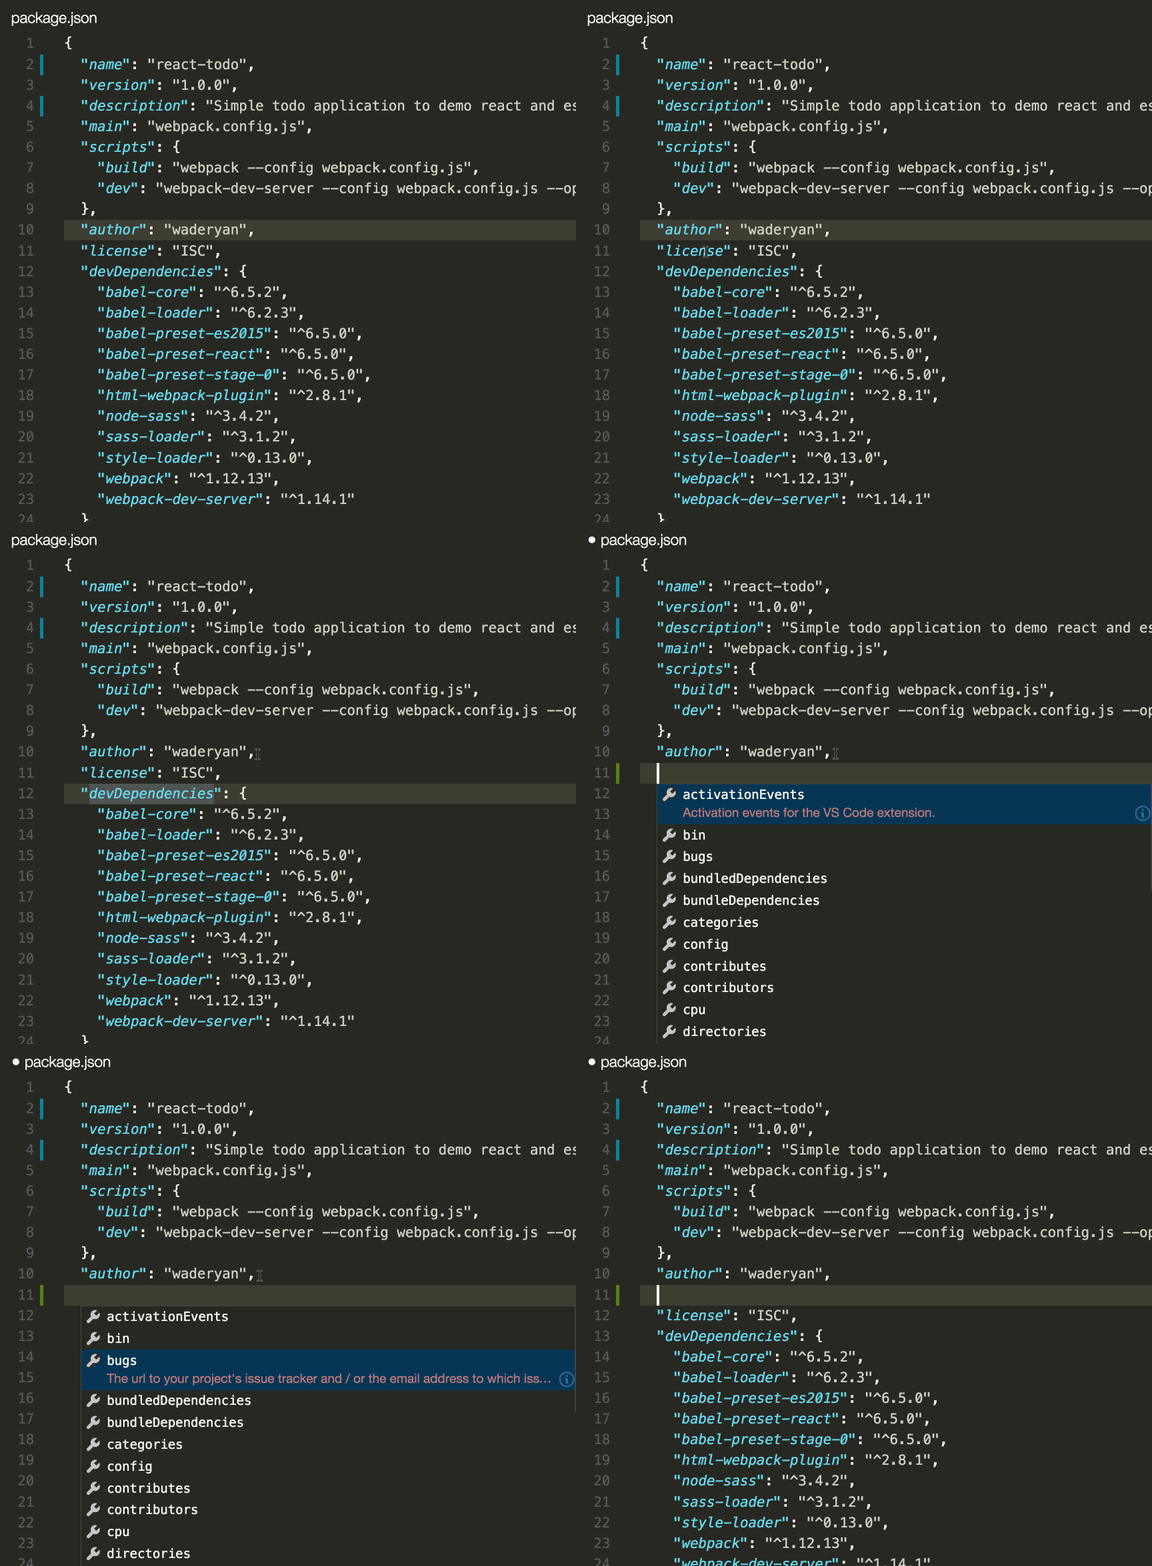
package.json
See IntelliSense for your package.json file.
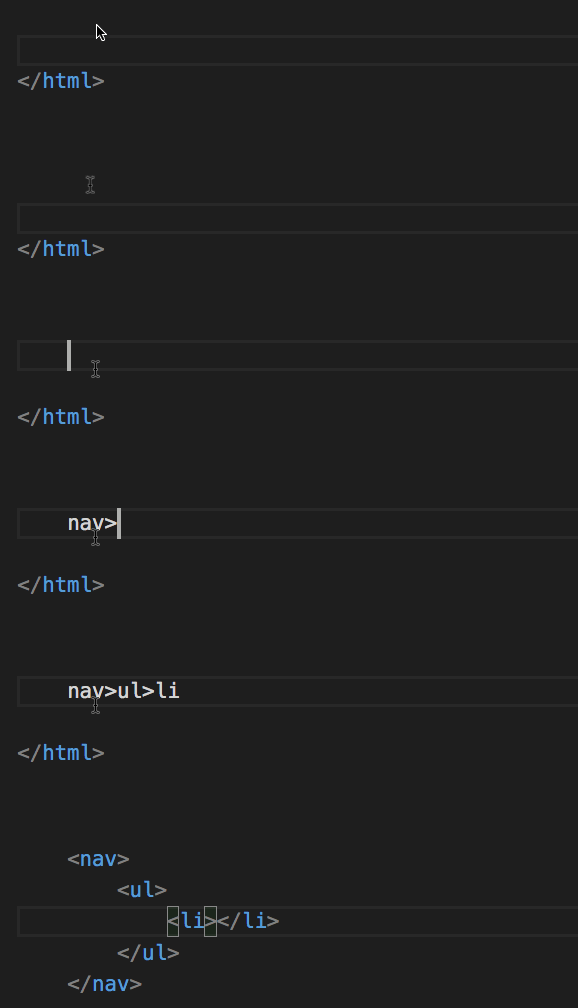
Emmet syntax
Snippets
Create custom snippets
File > Preferences > Configure Snippets, select the language, and create a snippet.
\trender() {",
        "\t\treturn ($2);",
        "\t}",
        "",
        "}"
    ]
},
See more details in Creating your own Snippets.
Git integration
Keyboard Shortcut: ⌃⇧G (Windows, Linux Ctrl+Shift+G)
Git integration comes "out-of-the-box" with VS Code. You can install other source control management (SCM) providers from the VS Code Extension Marketplace. This section describes the Git integration but much of the UI and gestures are common for other SCM providers.
Git blame
VS Code shows git blame information inline in the editor and in the Status Bar. Hover over the Status Bar item or inline hint to view detailed git blame information.
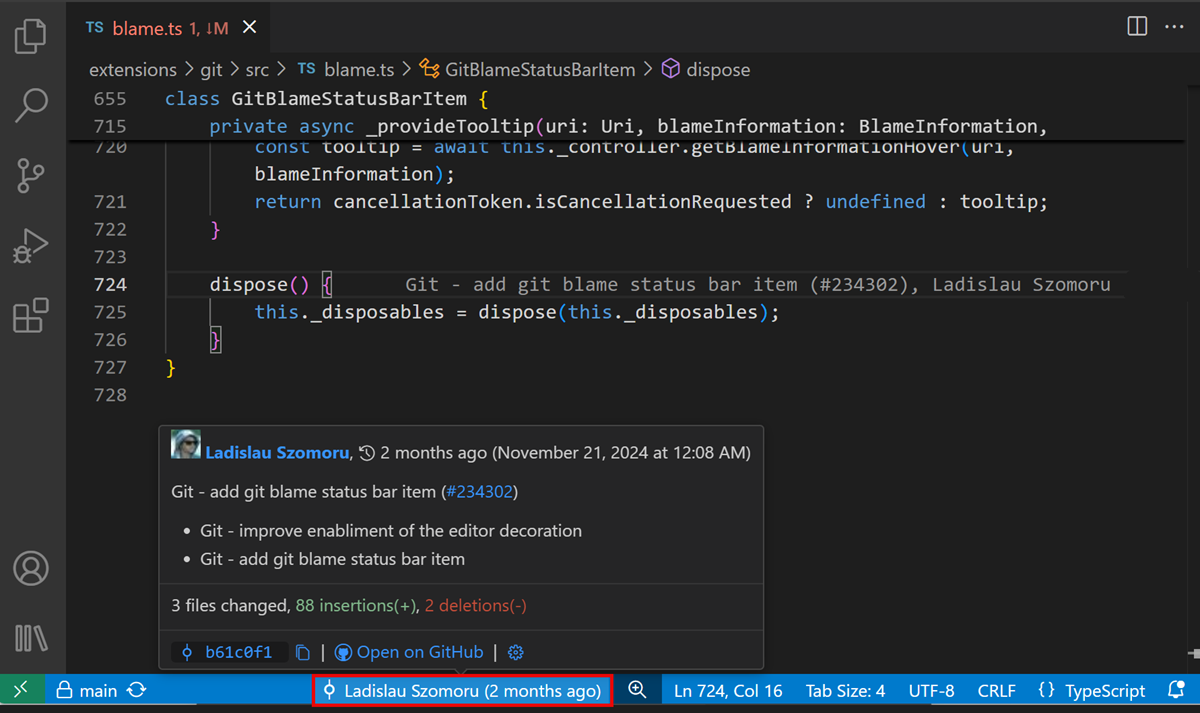
To enable or disable git blame information, use the Git: Toggle Git Blame Editor Decoration and Git: Toggle Git Blame Status Bar Item commands, or configure these settings:
- git.blame.statusBarItem.enabled (enabled by default)
- git.blame.editorDecoration.enabled
Learn more about Git blame support in VS Code and how to customize the layout.
Diffs
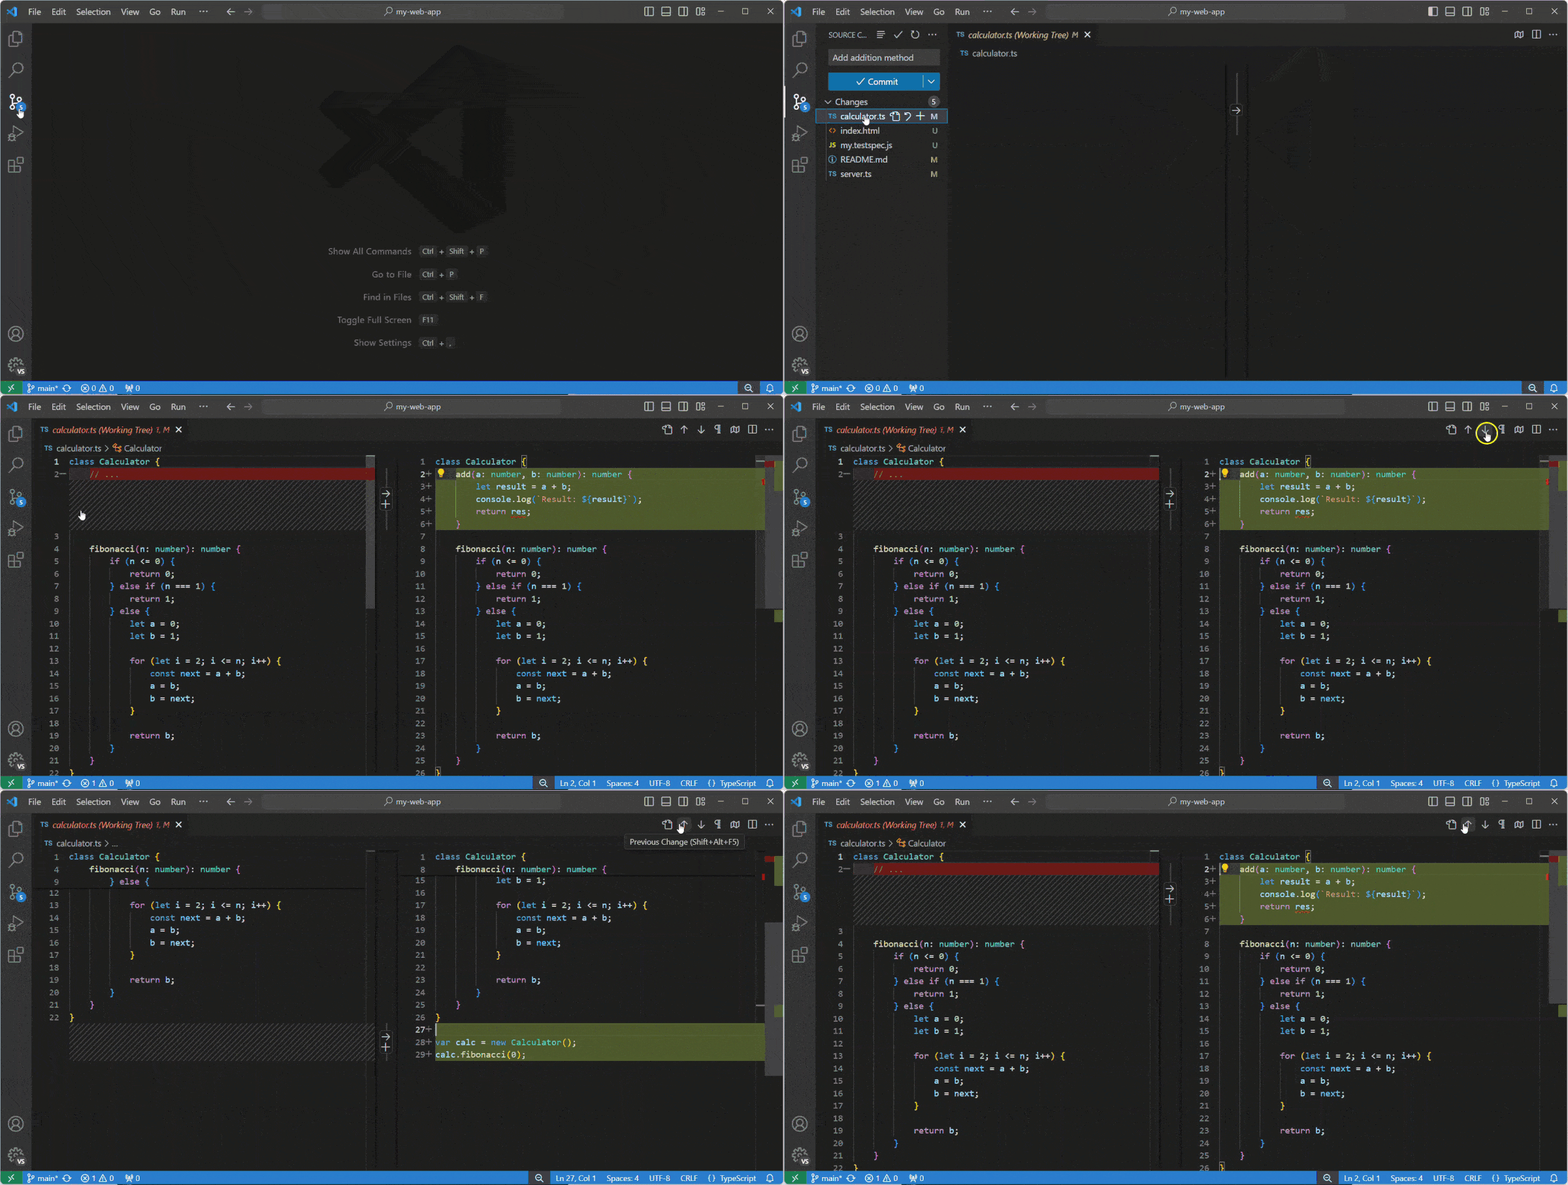
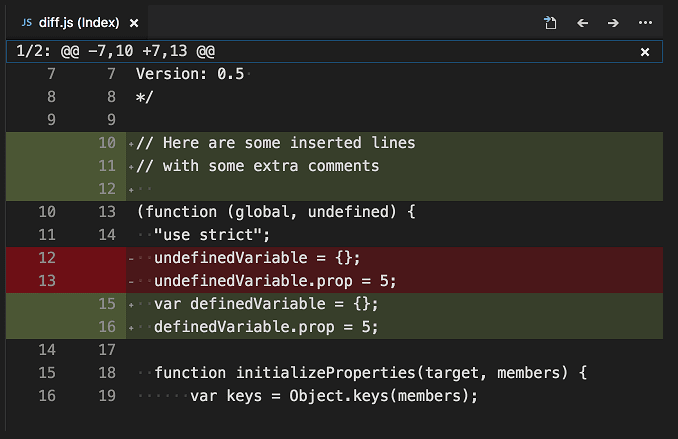
From the Source Control view, select a file to open the diff editor. Alternatively, select the Open Changes button in the top right corner to diff the current open file.
Views
The default view for diffs is the side by side view.
Toggle inline view by selecting the More Actions (...) button in the top right, and then selecting Inline View.
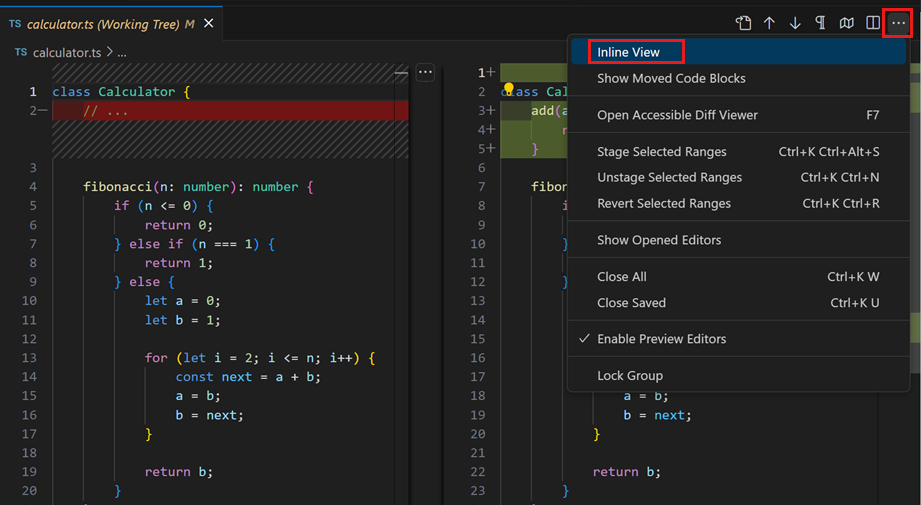
If you prefer to have the inline view as the default, configure the "diffEditor.renderSideBySide": false setting.
Accessible Diff Viewer
Navigate through diffs with F7 and ⇧F7 (Windows, Linux Shift+F7). This presents changes in a unified patch format. Lines can be navigated with arrow keys and pressing Enter jumps back in the diff editor and the selected line.
Edit pending changes
While you're viewing changes in the diff editor, you can make edits directly in the pending changes side of the diff editor.
Branches
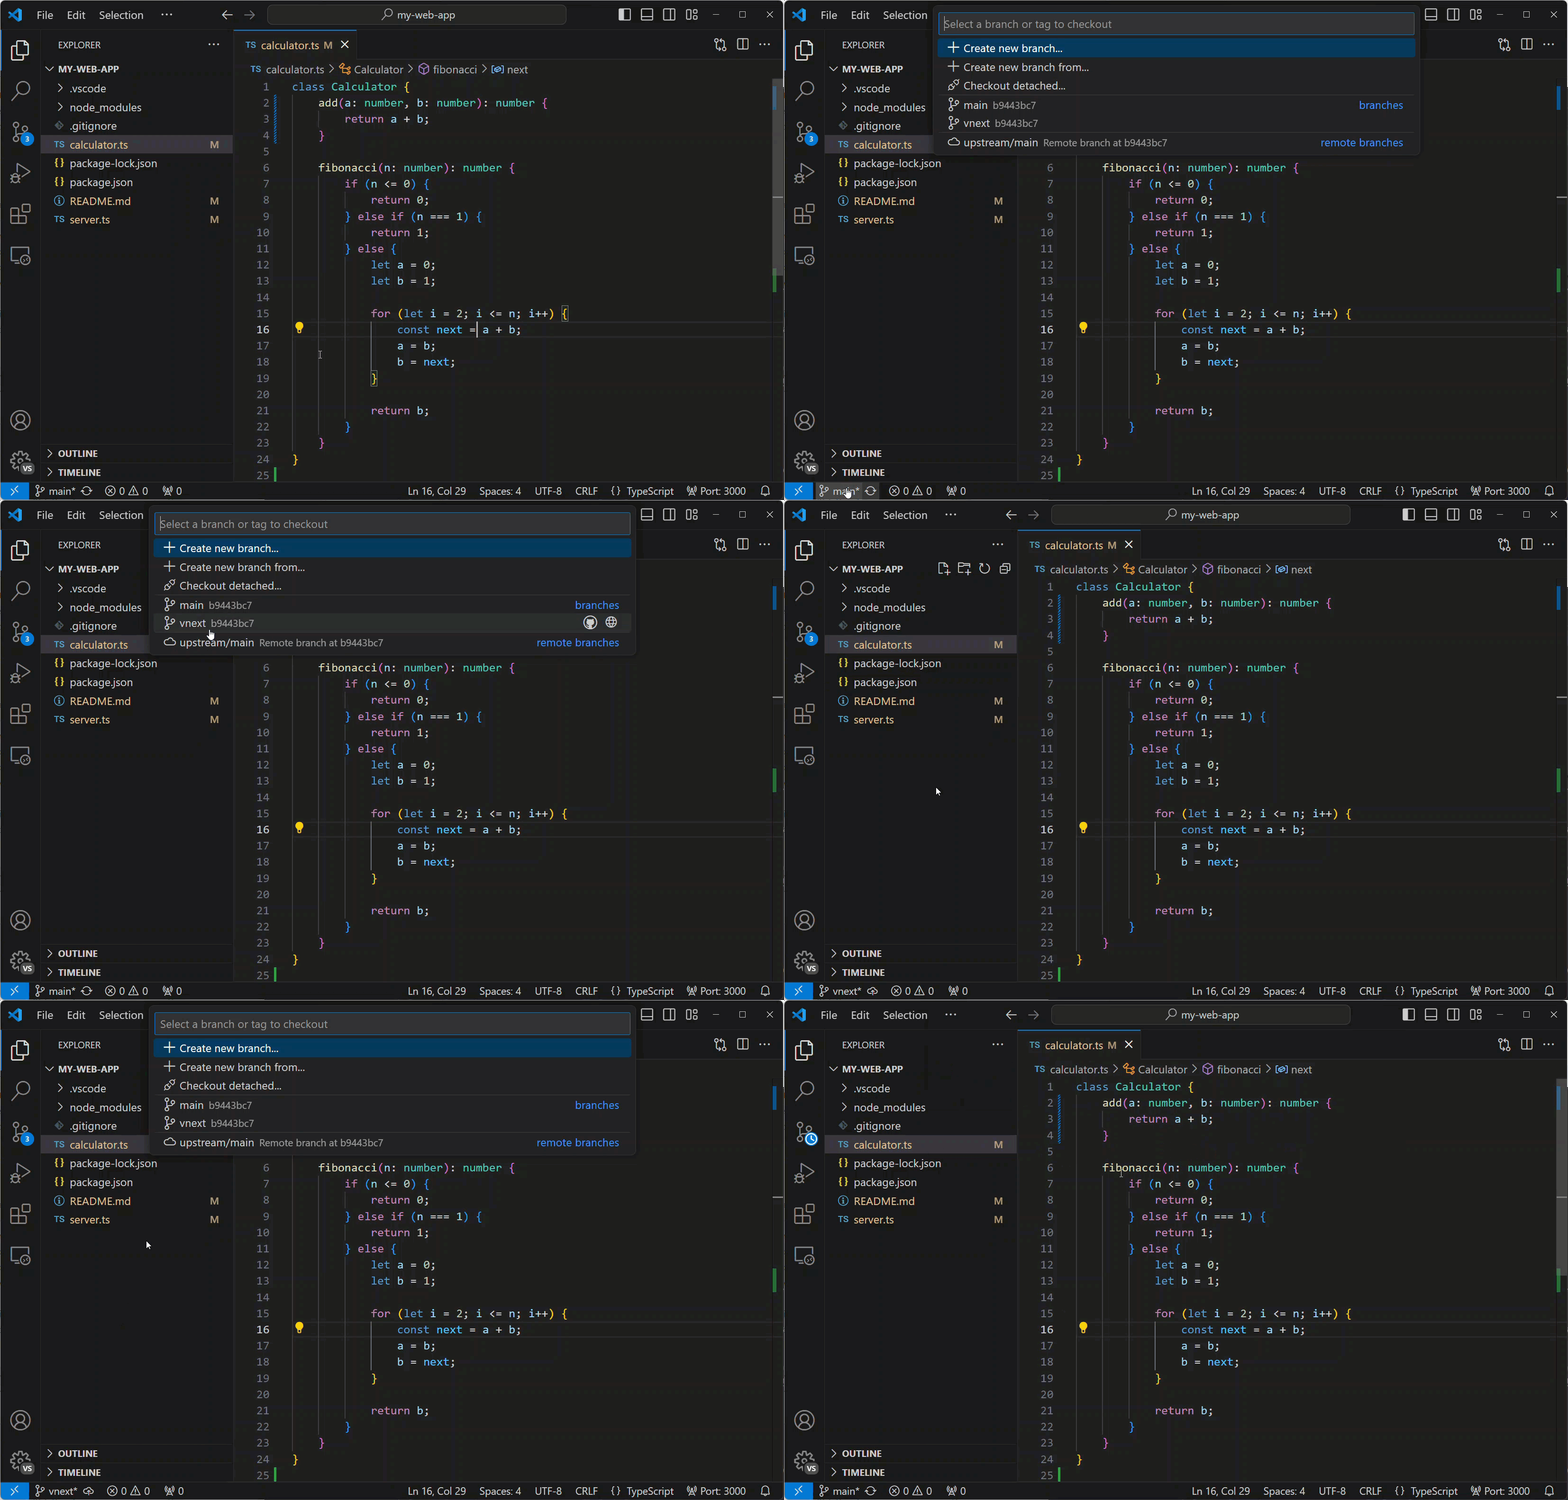
Easily switch between Git branches via the Status Bar.
Staging
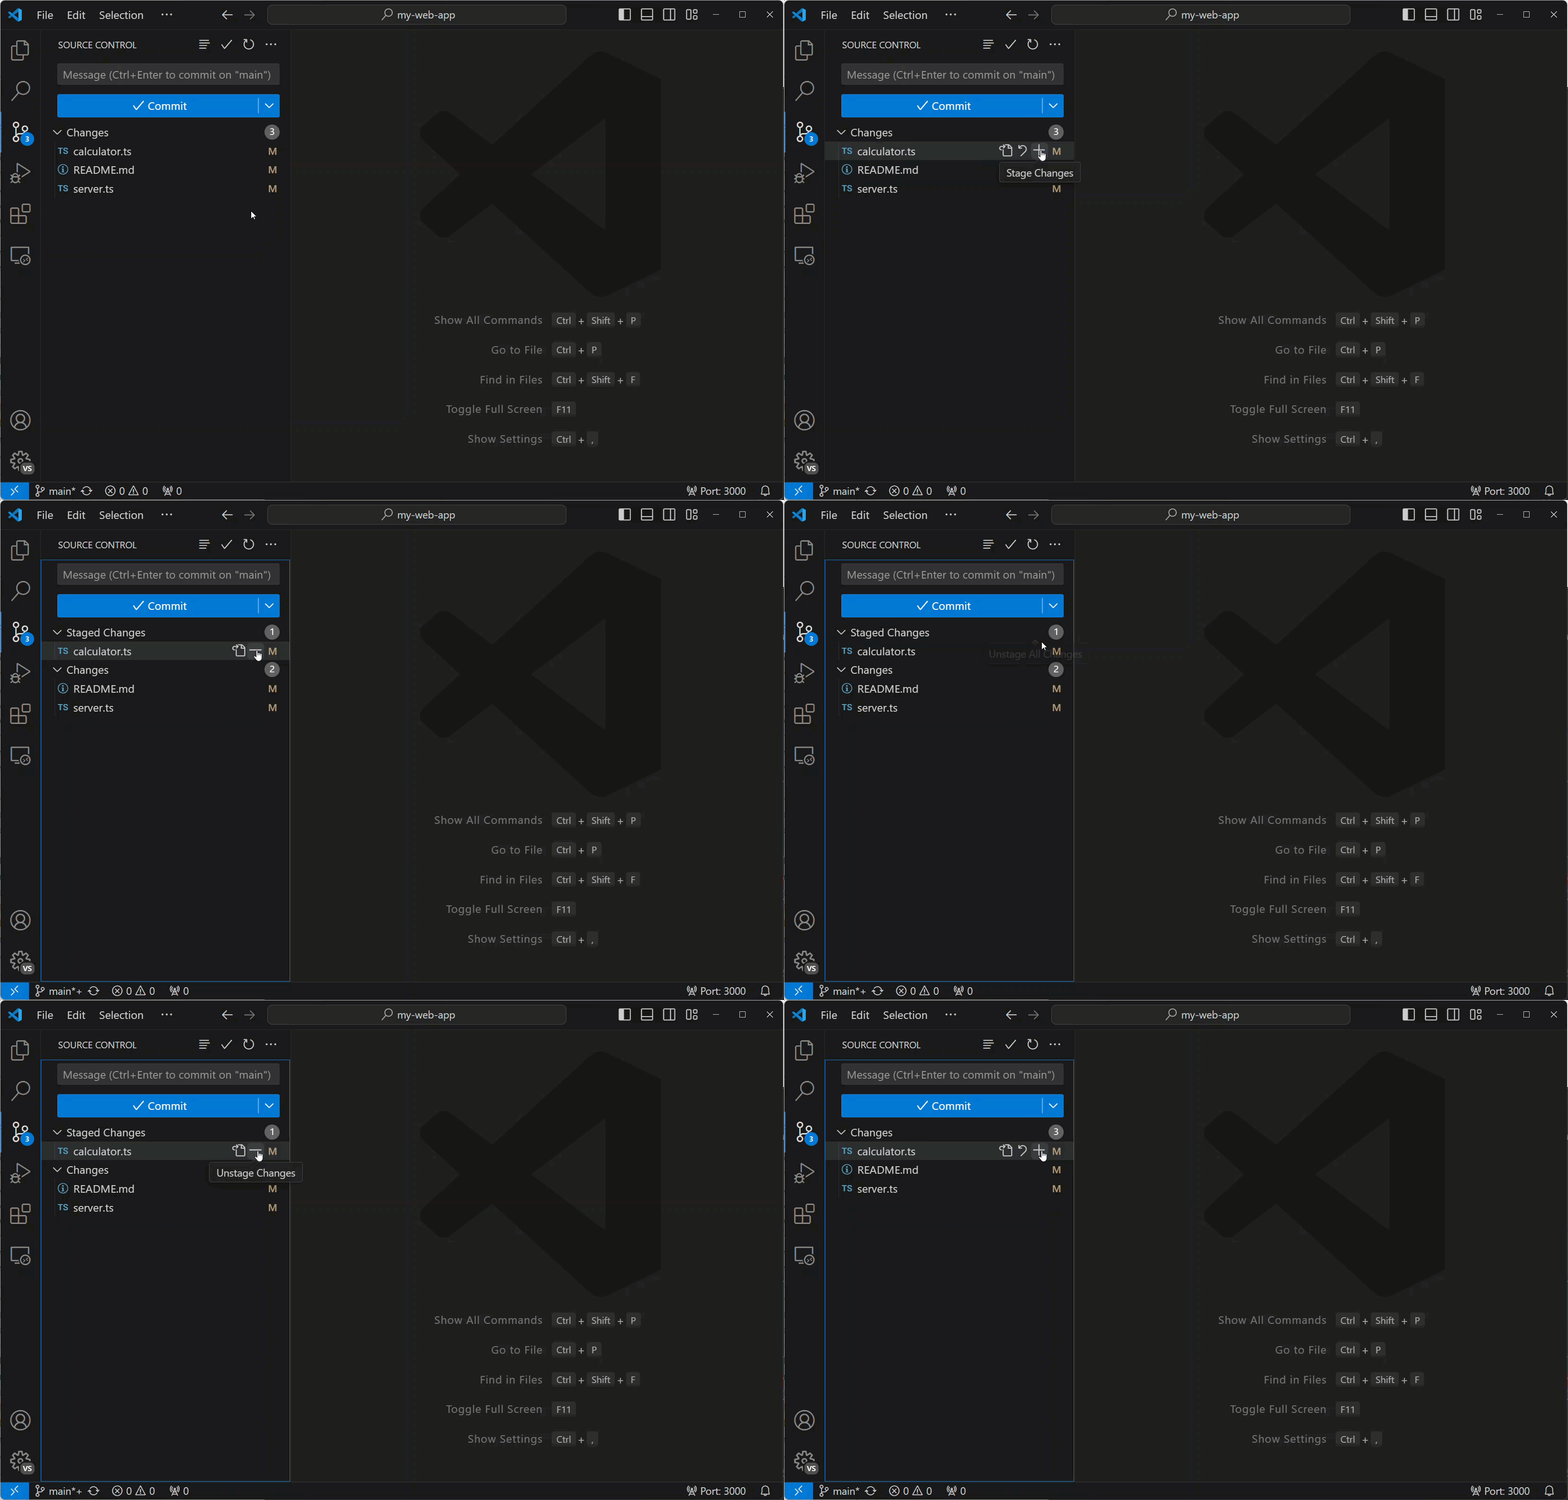
Stage file changes
Hover over the number of files and select the plus button to stage a file.
Select the minus button to unstage changes.
Stage selected
You can stage a portion of a file by making a text selection in a file and then choosing Stage Selected Ranges from the Command Palette or from the diff editor context menu (right-click).
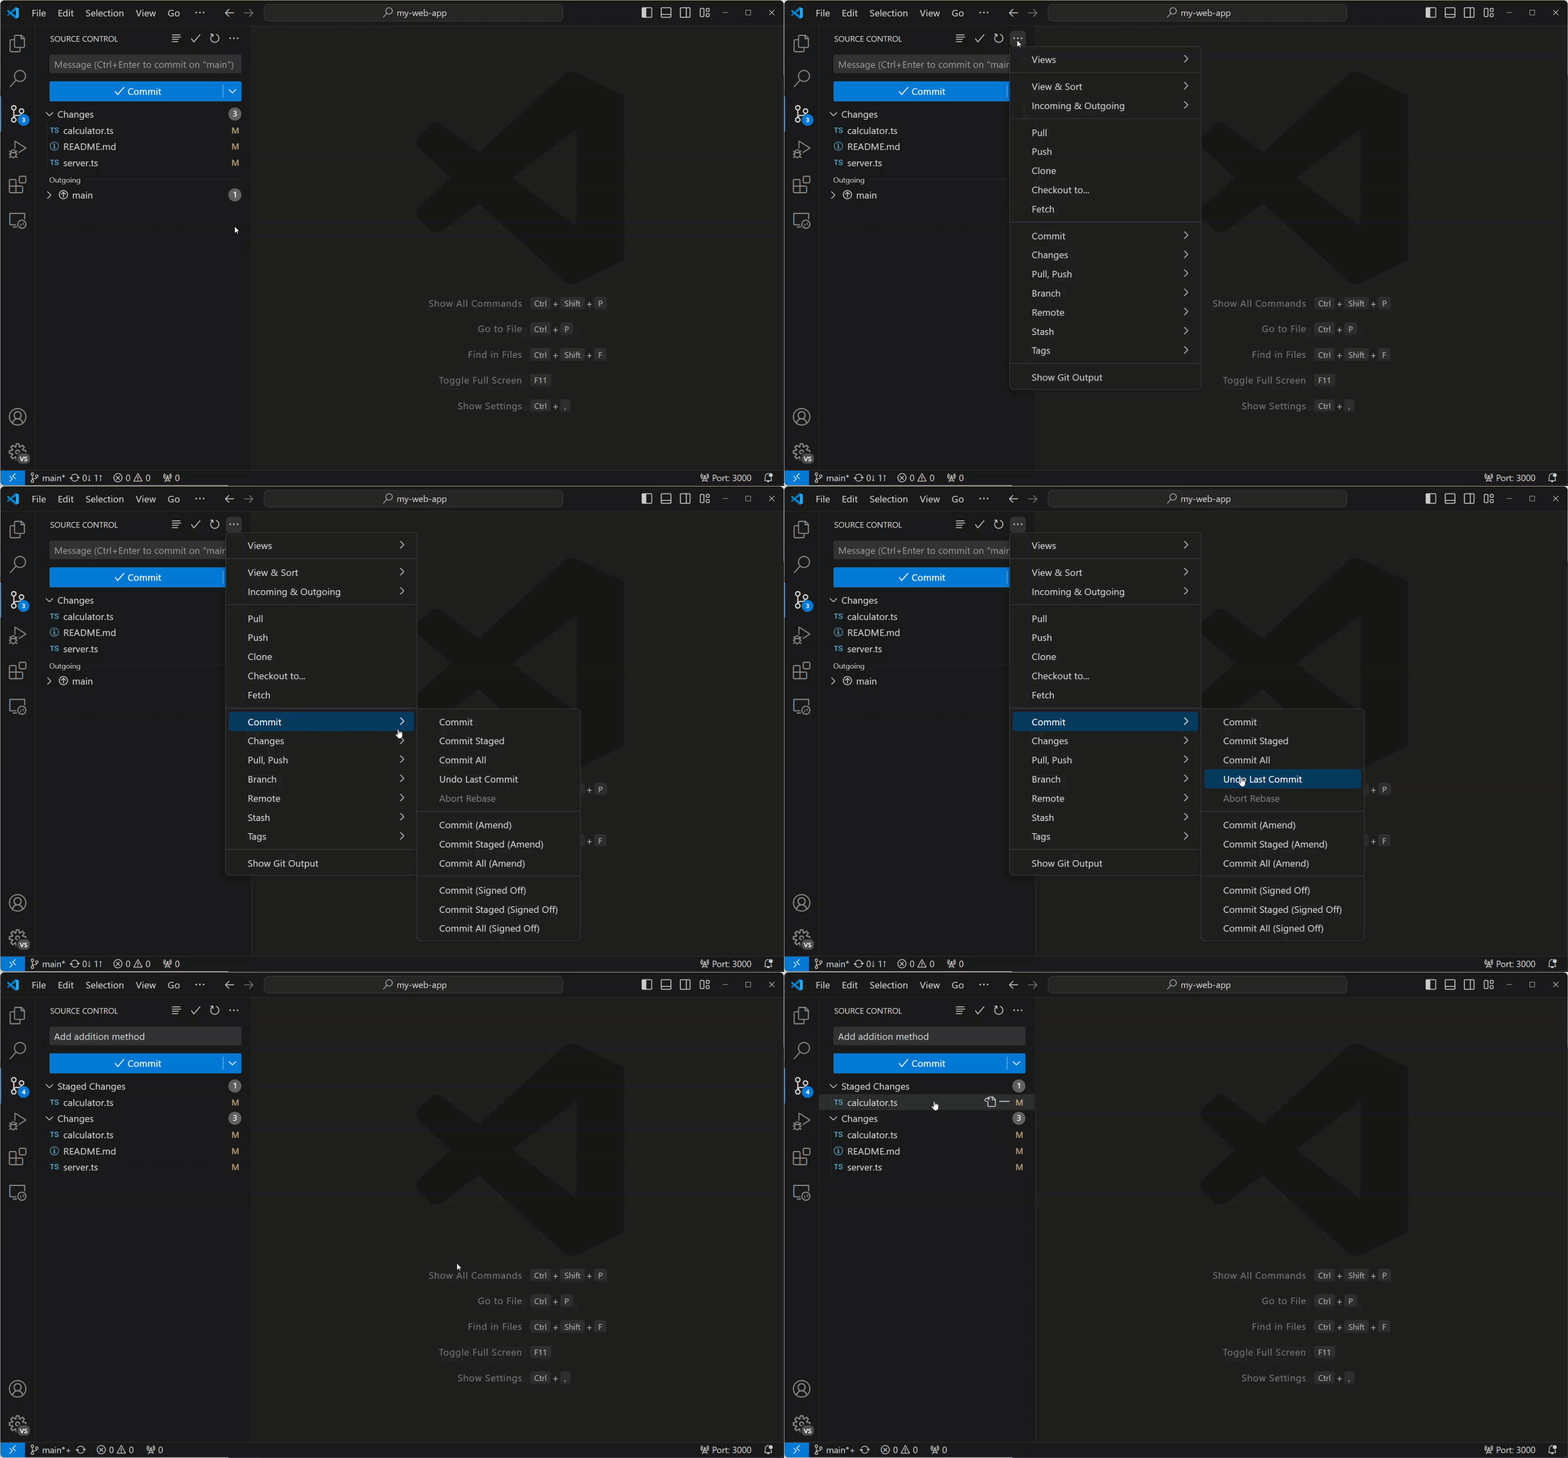
Undo last commit
Select the (...) button, and then select Commit > Undo Last Commit to undo the previous commit. The changes are added to the Staged Changes section.
See Git output
VS Code makes it easy to see what Git commands are actually running. This can be helpful when you're still learning Git or when you're debugging a difficult source control issue.
To view the Git output, select the (...) button in the Source Control view, and then select Show Git Output, use the Git: Show Git Output command, or use the Toggle Output command (⇧⌘U (Windows Ctrl+Shift+U, Linux Ctrl+K Ctrl+H)) and then select Git from the dropdown.
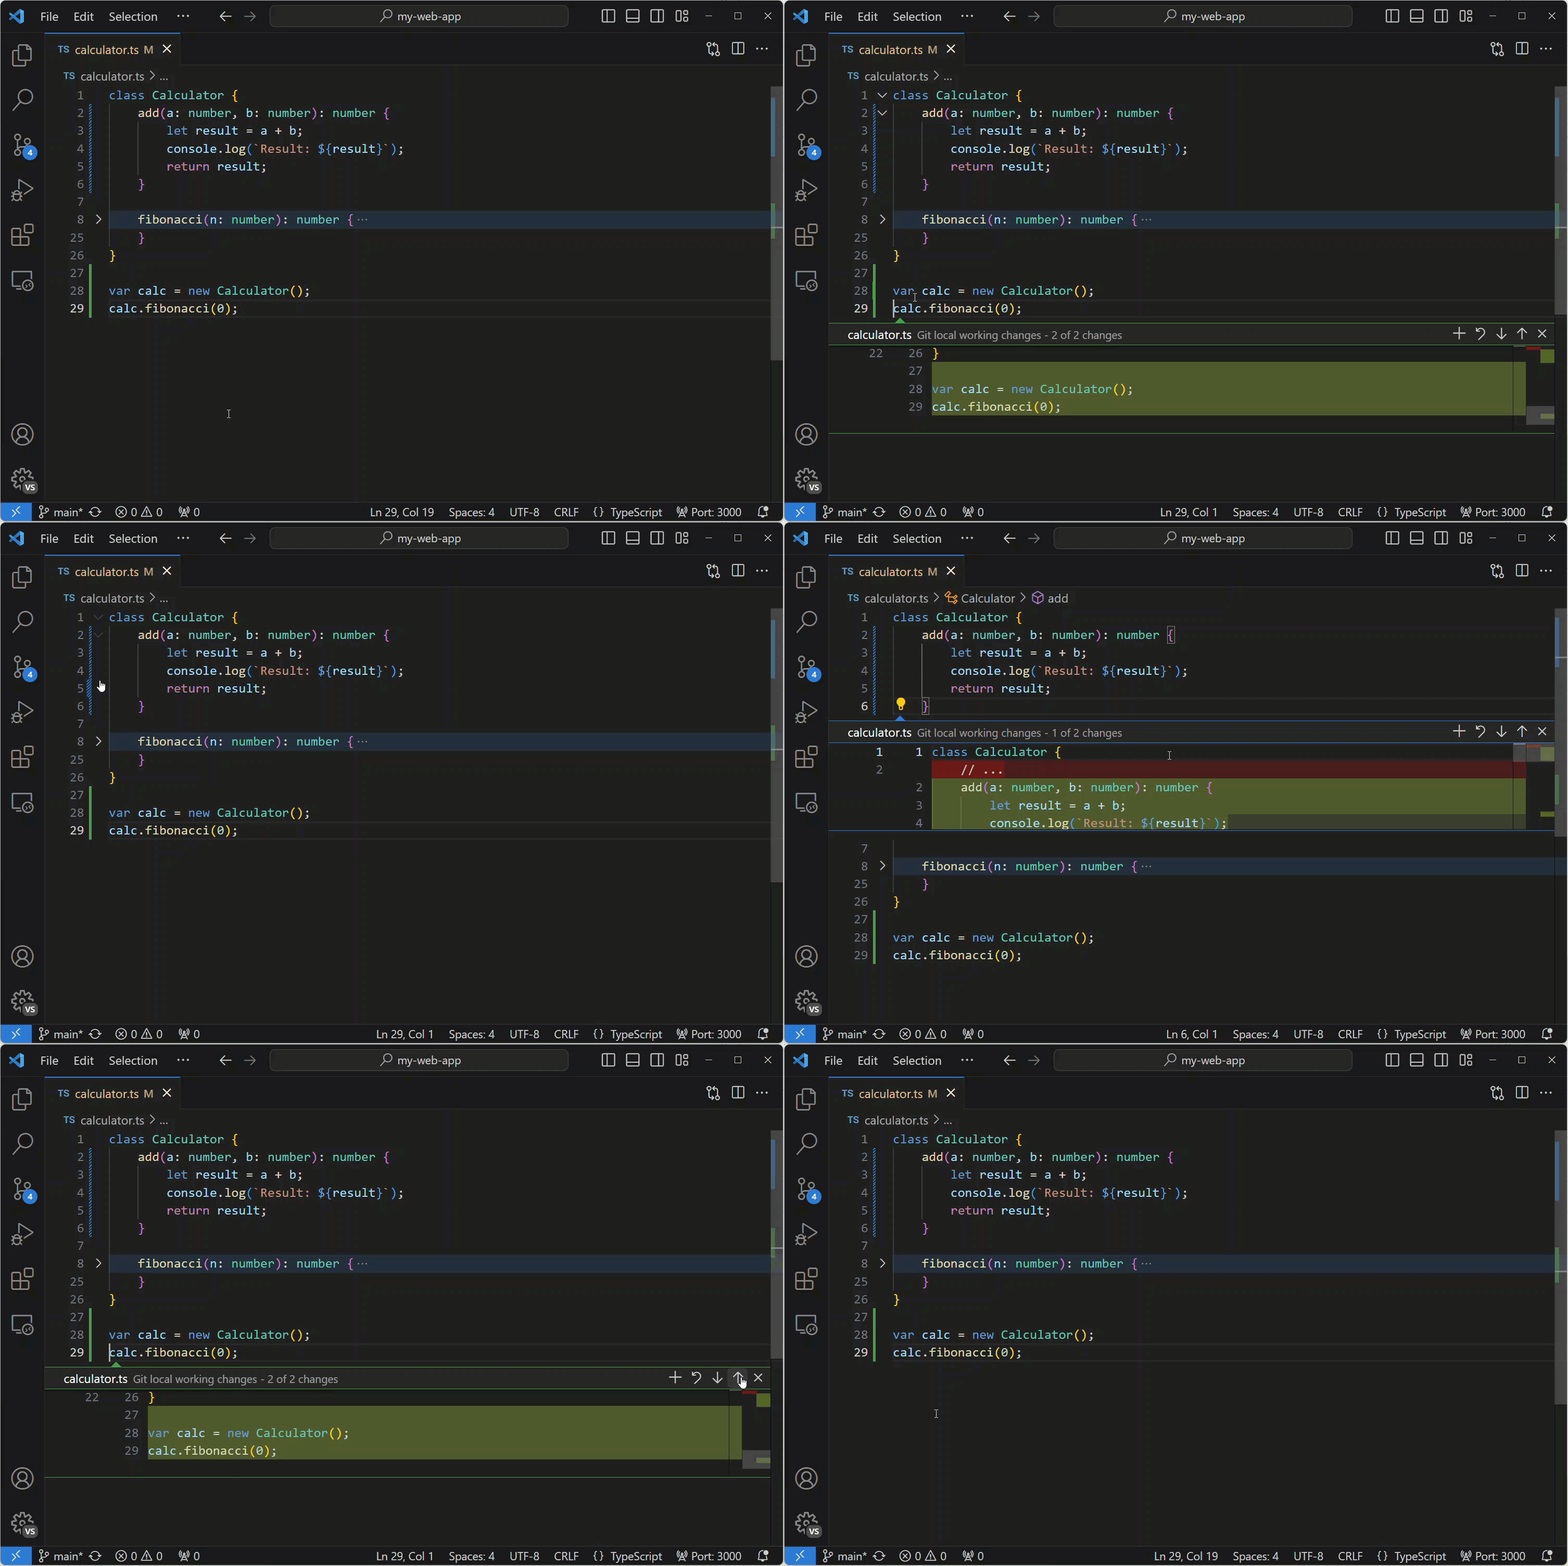
Gutter indicators
The editor provides visual cues in the gutter about where and which changes (added, changed, or remove lines) were made. See the source control documentation for more details.
Resolve merge conflicts
During a merge, go to the Source Control view (⌃⇧G (Windows, Linux Ctrl+Shift+G)) and make changes in the diff view.
You can resolve merge conflicts with the inline CodeLens which lets you Accept Current Change, Accept Incoming Change, Accept Both Changes, and Compare Changes.
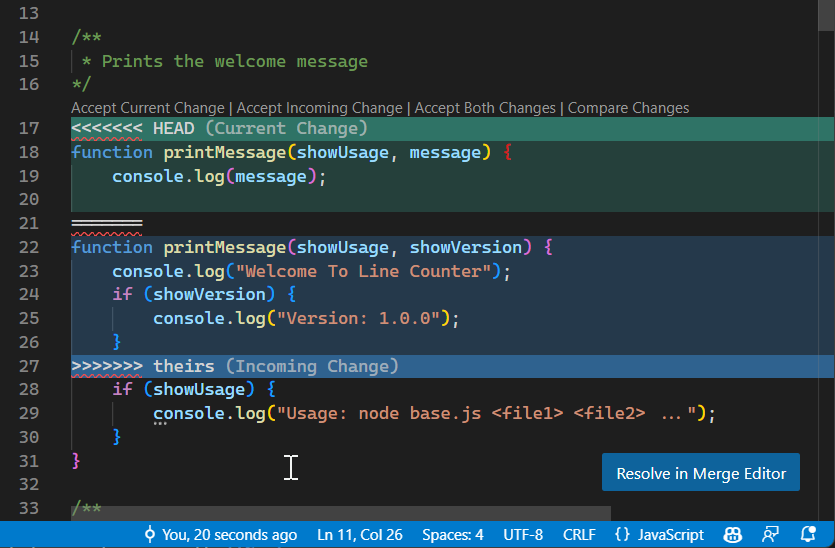
Learn more about resolving merge conflicts in the source control documentation.
Set VS Code as default merge tool
git config --global diff.tool vscode
git config --global difftool.vscode.cmd 'code --wait --diff $LOCAL $REMOTE'
Compare file with the clipboard
Keyboard Shortcut: ⌘K C (Windows, Linux Ctrl+K C)
Quickly compare the active file with the contents of the clipboard with the File: Compare Active File with Clipboard command in the Command Palette (⇧⌘P (Windows, Linux Ctrl+Shift+P)).
Debugging
Configure debugger
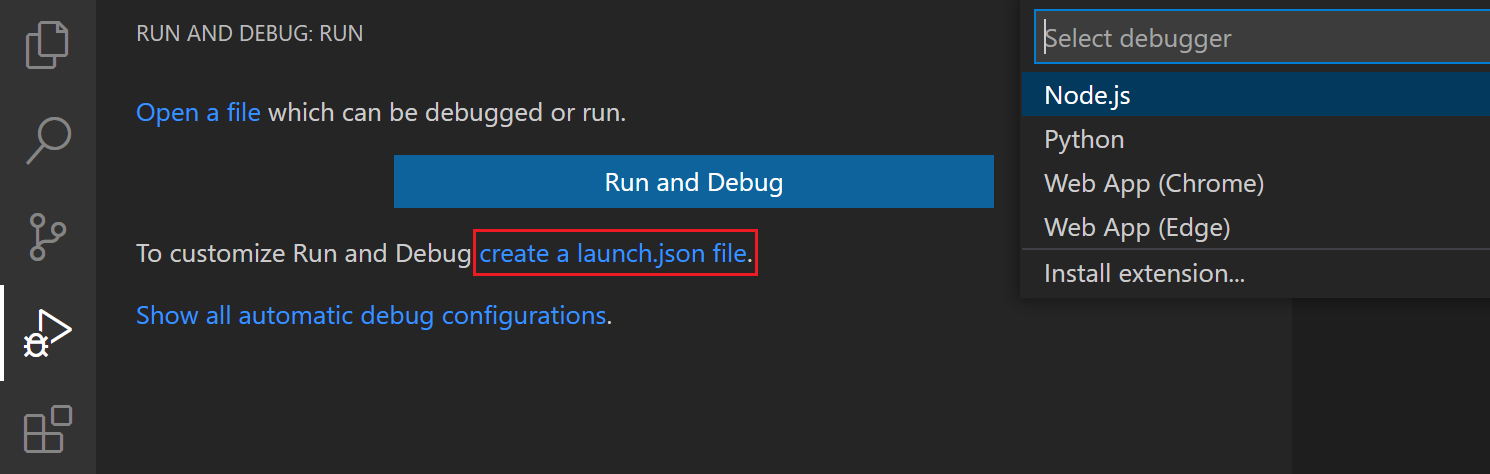
From the Run and Debug view (⇧⌘D (Windows, Linux Ctrl+Shift+D)), select create a launch.json file, which prompts you to select the environment that matches your project (Node.js, Python, C++, and more). This generates a launch.json file in your workspace that contains the debugger configuration.
Node.js support is built-in and other environments require installing the appropriate language extensions. See the debugging documentation for more details.
Breakpoints and stepping through
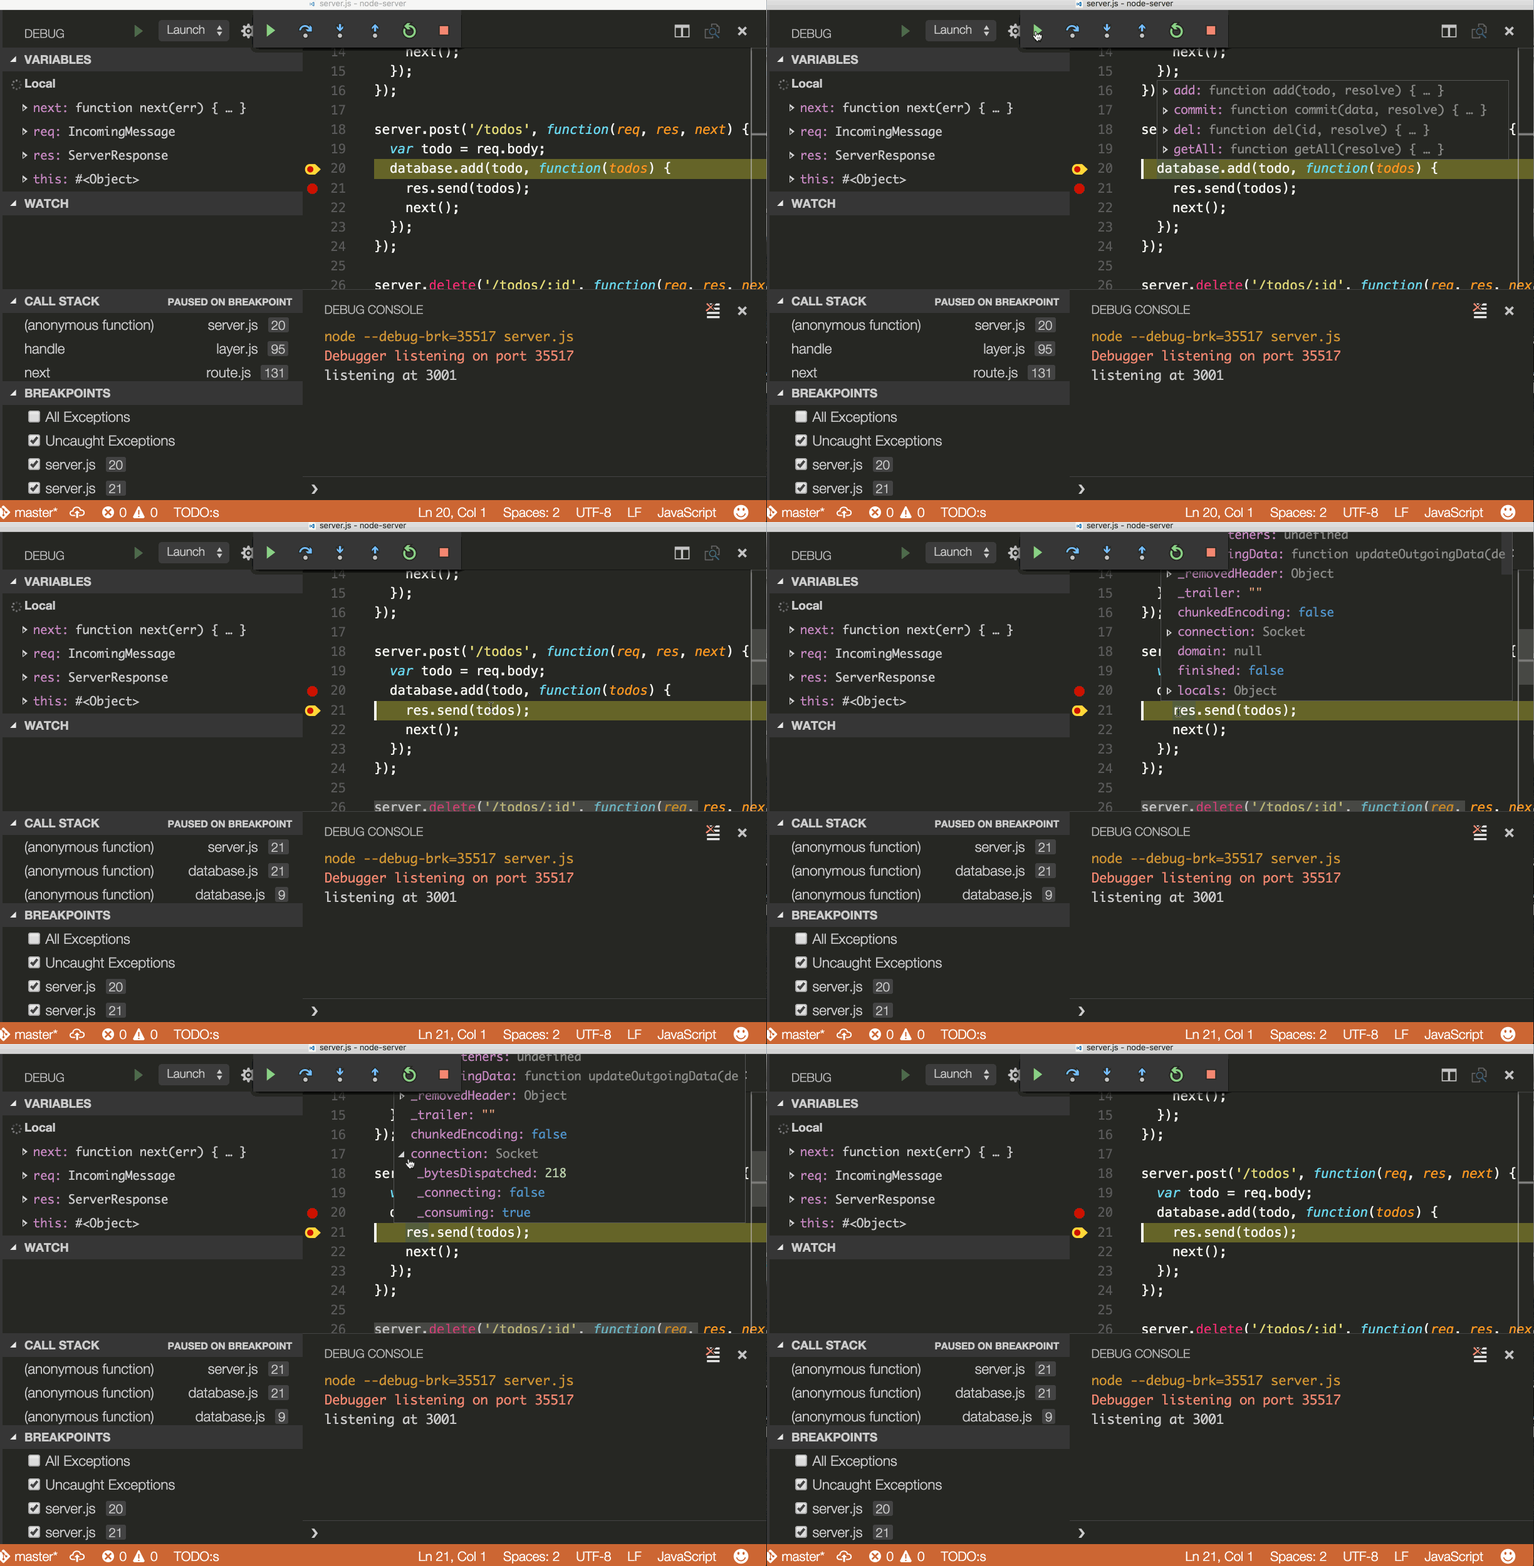
Toggle a breakpoint by selecting the editor margin or by using F9 on the current line. Breakpoints in the editor margin are normally shown as red filled circles.
Once a debug session starts, the Debug toolbar appears on the top of the editor and enables you to step through or into the code while debugging. Learn more about debug actions in the debugging documentation.
Data inspection
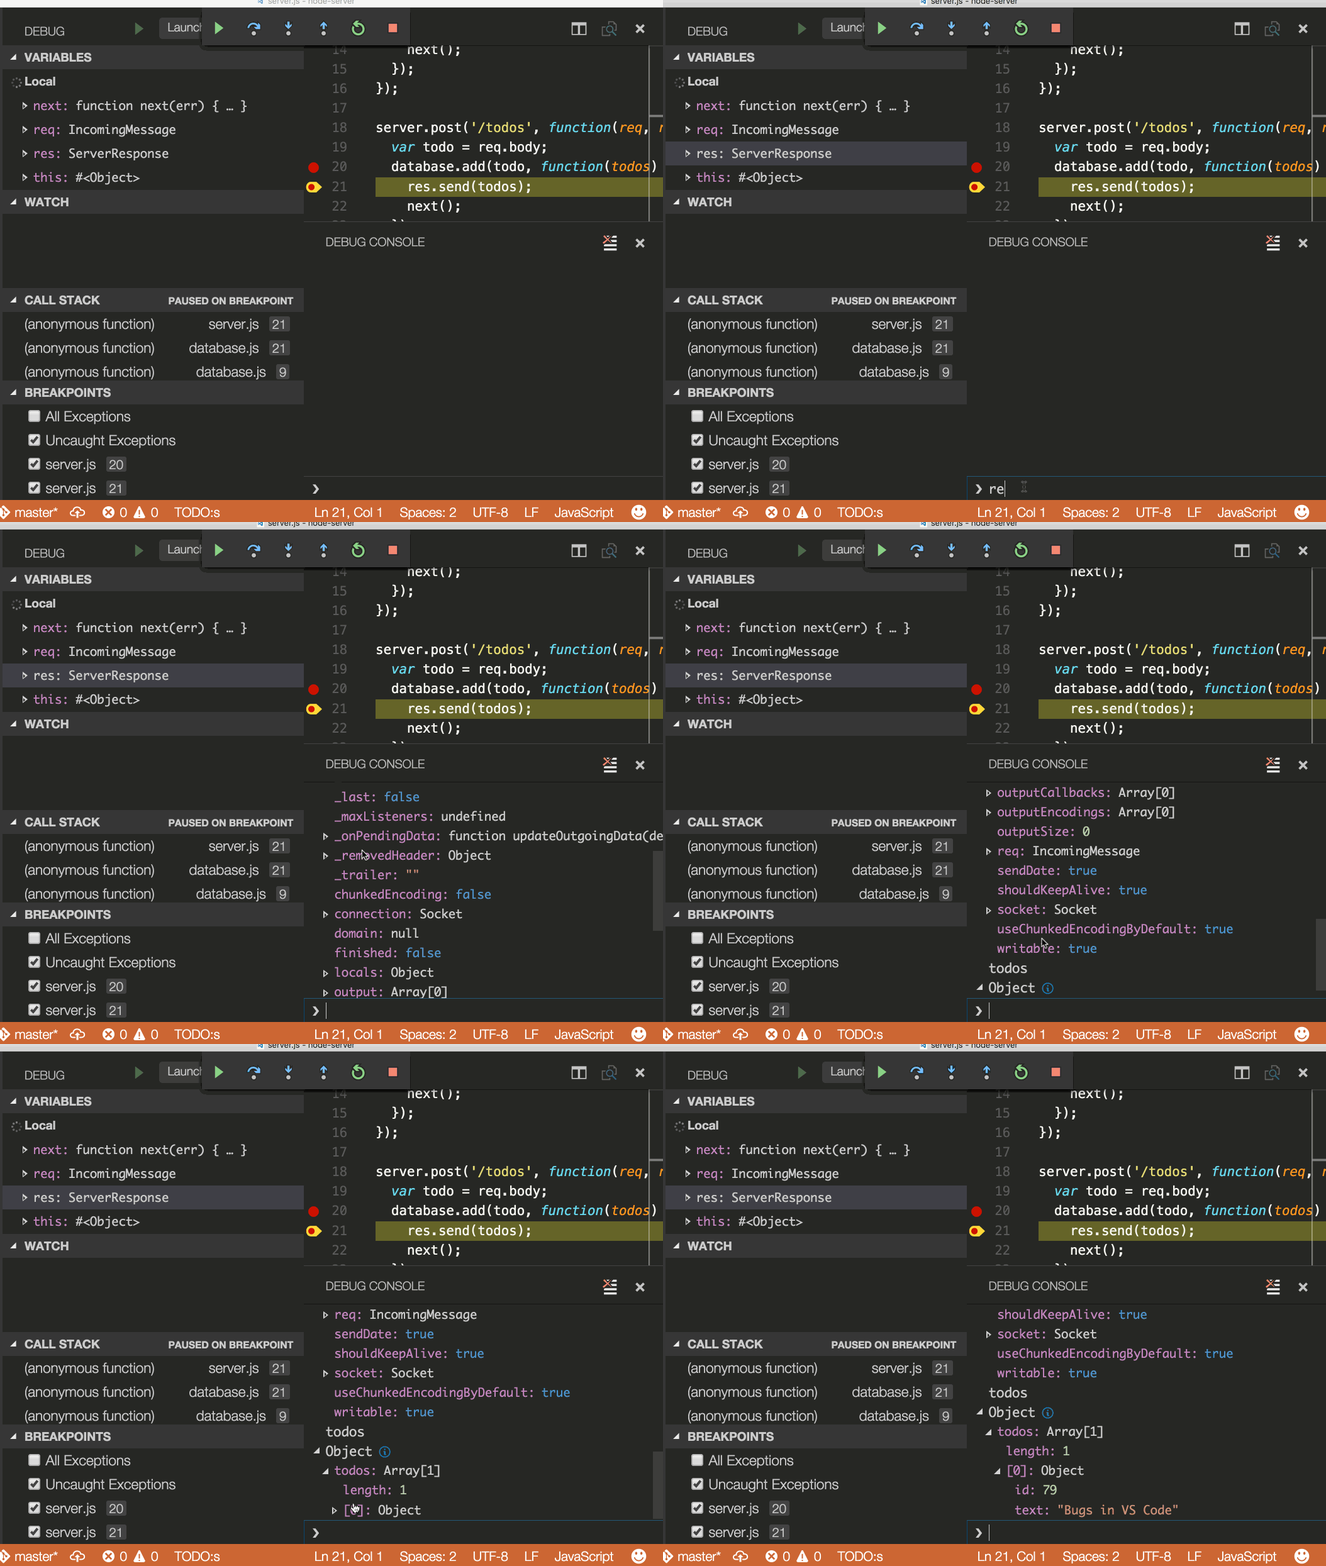
Variables can be inspected in the VARIABLES section of the Run and Debug view, by hovering over their source in the editor, or by using the debug console.
Logpoints
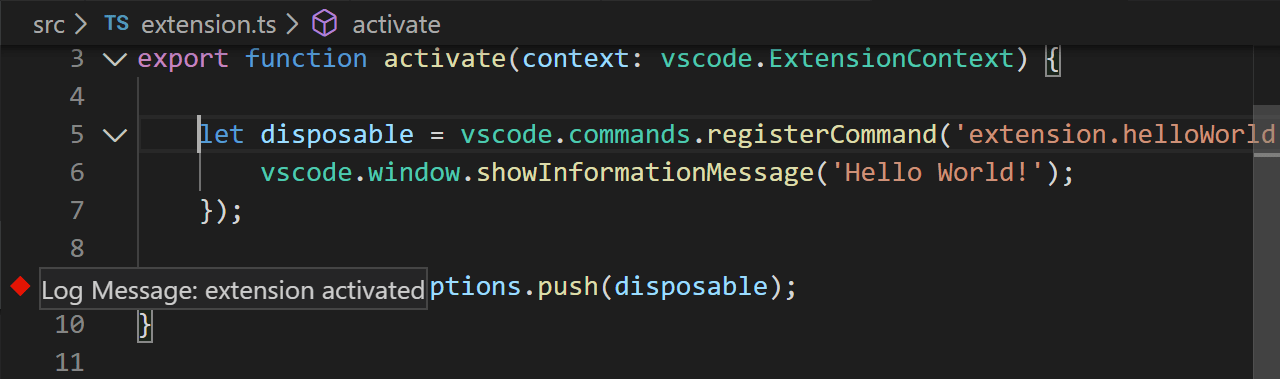
Logpoints act much like breakpoints but instead of halting the debugger when they are hit, they log a message to the console. Logpoints are especially useful for injecting logging while debugging production servers that cannot be modified or paused.
Add a logpoint with the Add Logpoint command in the left editor gutter and it will be displayed as a "diamond" shaped icon. Log messages are plain text but can include expressions to be evaluated within curly braces ('{}').
Triggered breakpoints
A triggered breakpoint is a breakpoint that is automatically enabled once another breakpoint is hit. They can be very useful when diagnosing failure cases in code that happen only after a certain precondition.
Triggered breakpoints can be set by right-clicking on the glyph margin, selecting Add Triggered Breakpoint, and then choosing which other breakpoint enables the breakpoint.
Task runner
Tasks in VS Code can be configured to run scripts and start processes so that these tools can be used from within VS Code without having to enter a command line or write new code.
Auto detect tasks
Select Terminal from the top-level menu, run the command Configure Tasks, then select the type of task you'd like to run.
This generates a tasks.json file with content like the following. See the Tasks documentation for more details.
{
  "key": "ctrl+h",
  "command": "workbench.action.tasks.runTask",
  "args": "Run tests"
}
Run npm scripts as tasks from the Explorer
From the Explorer view you can open a script in the editor, run it as a task, and launch it with the node debugger (when the script defines a debug option like --inspect-brk). The default action on click is to open the script. To run a script on a single click, set
npm.scriptExplorerAction
to run. Use the setting
npm.exclude
to exclude scripts in package.json files contained in particular folders.
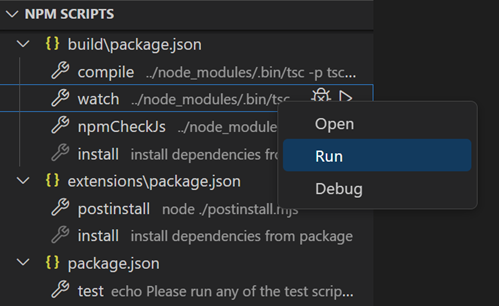
With the setting npm.enableRunFromFolder , you can enable to run npm scripts from the Explorer view context menu for a folder. The setting enables the command Run NPM Script in Folder... when a folder is selected. The command shows a Quick Pick list of the npm scripts contained in this folder and you can select the script to be executed as a task.
Portable mode
VS Code has a Portable mode which lets you keep settings and data in the same location as your installation, for example, on a USB drive.
Insiders builds
The Visual Studio Code team uses the Insiders version to test the latest features and bug fixes of VS Code. You can also use the Insiders version by downloading it here.
- For Early Adopters - Insiders has the most recent code changes for users and extension authors to try out.
- Frequent Builds - New builds every day with the latest bug fixes and features.
- Side-by-side install - Insiders installs next to the Stable build allowing you to use either independently.
8/12/2026