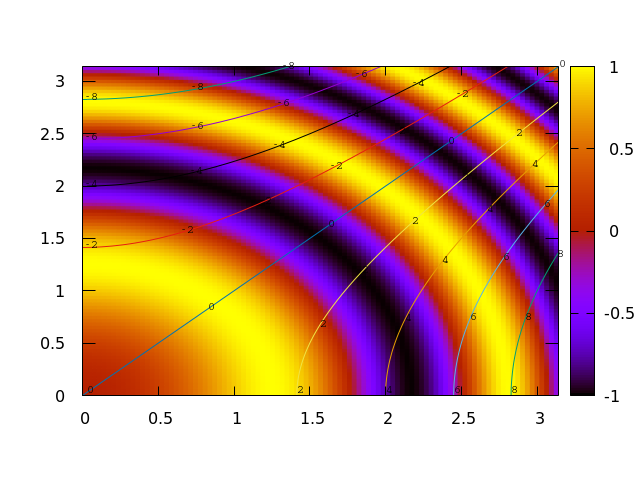
An image plot with a labeled contour plot. Labelled contours are a new feature in v.5.
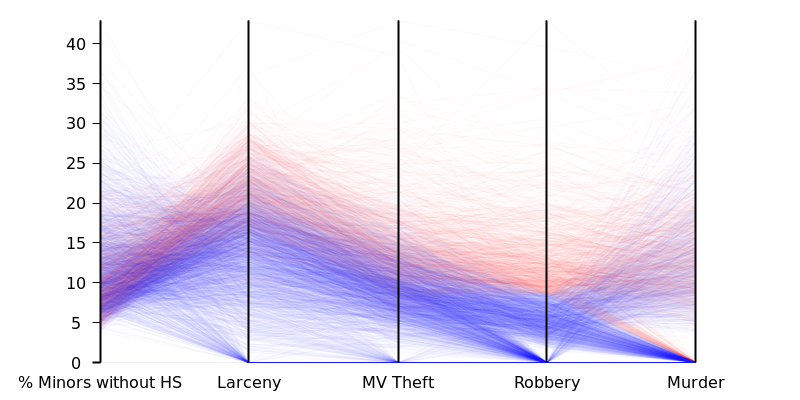
Parallel axis plots are brand new in gnuplot v.5. The book shows you what you can use them for, and how to make them look good.
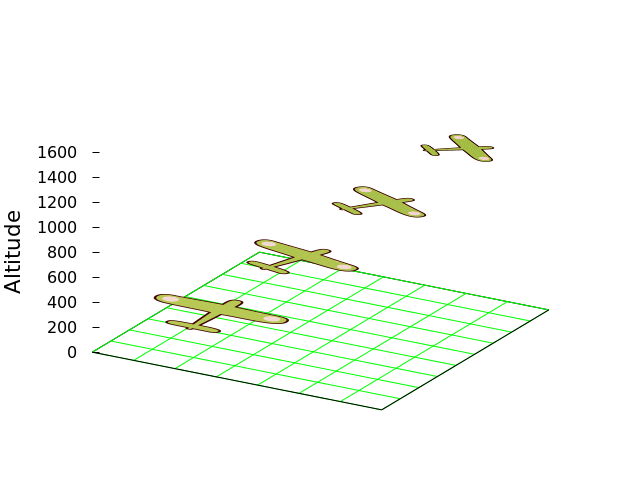
Gnuplot lets you plot with pictures, with control over the position and orientation in 3D space.
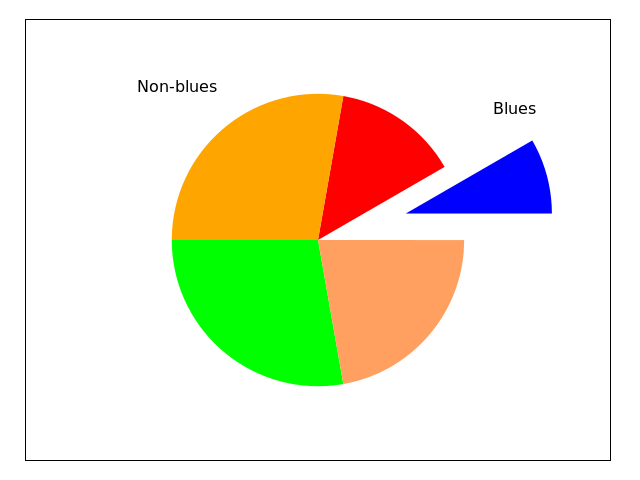
If you really want to make pie charts, this book will show you how (although we might not approve).
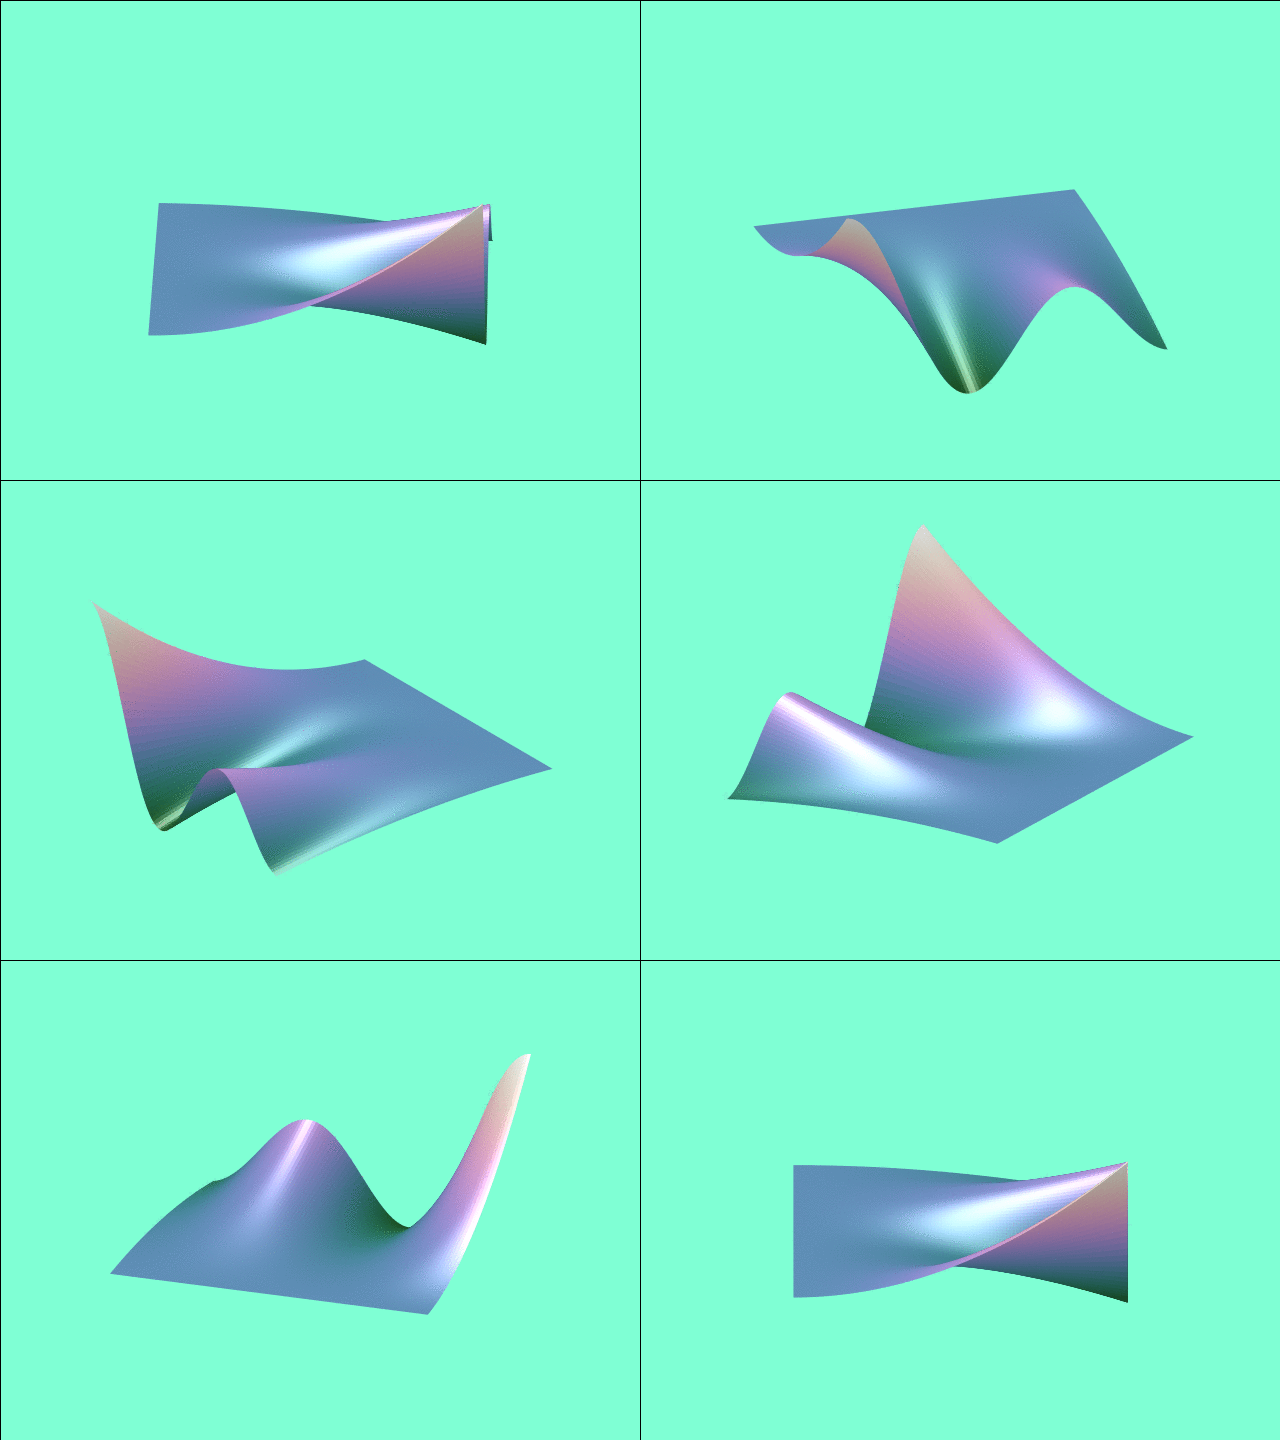
New in this version is ambient lighting, which you can control and combine with data coloring to render realistic surfaces.
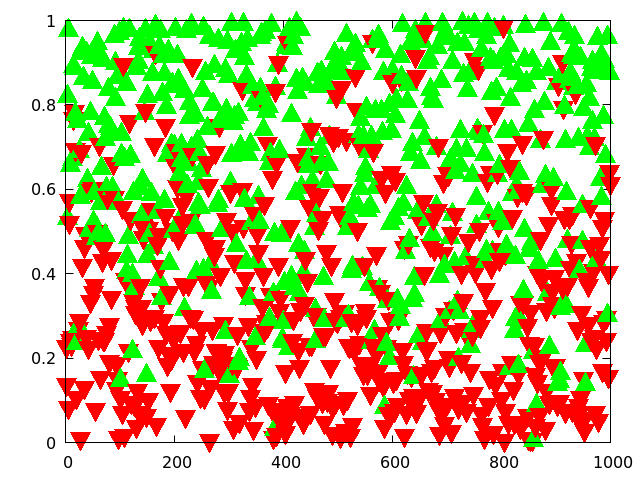
The book shows you various ways to let your data control the color, size, and type of symbol plotted.
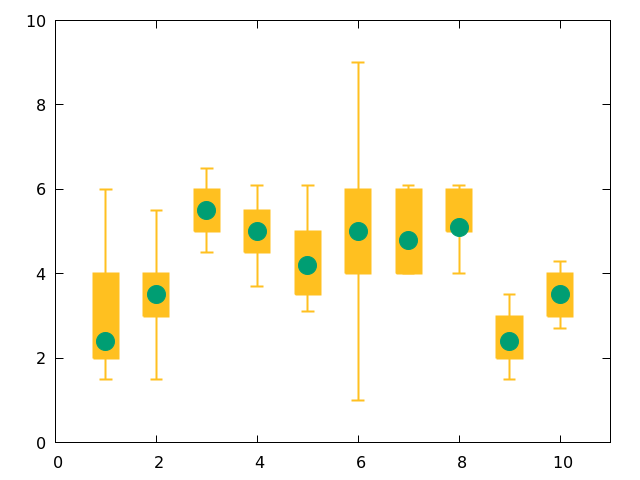
The book covers gnuplot’s extensive statistical and financial plotting and curve fitting.
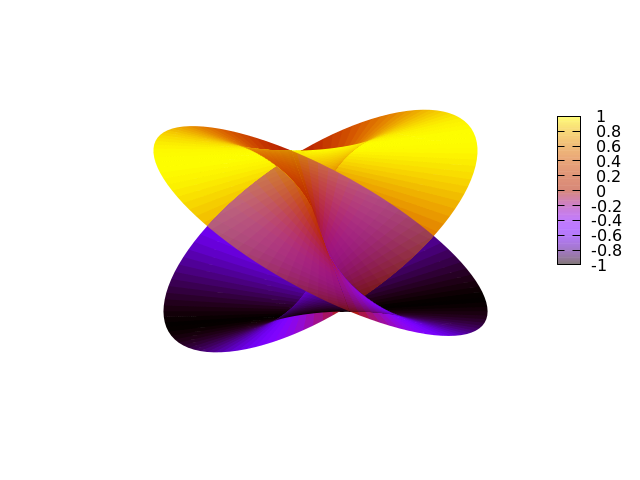
Intersecting surfaces. Careful use of gnuplot’s transparency makes things clear and beautiful.
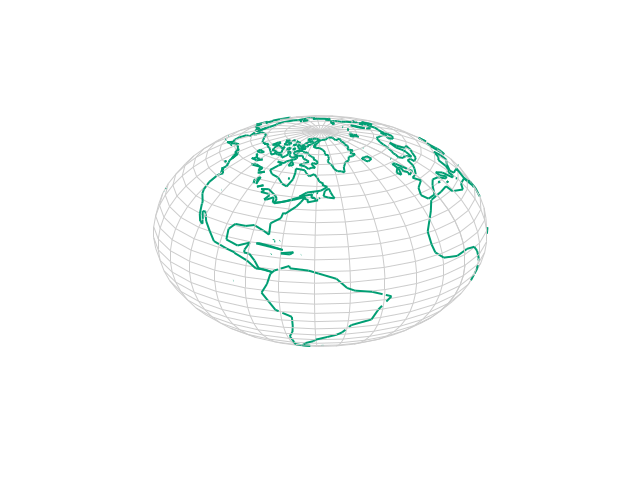
Gnuplot does mapping.
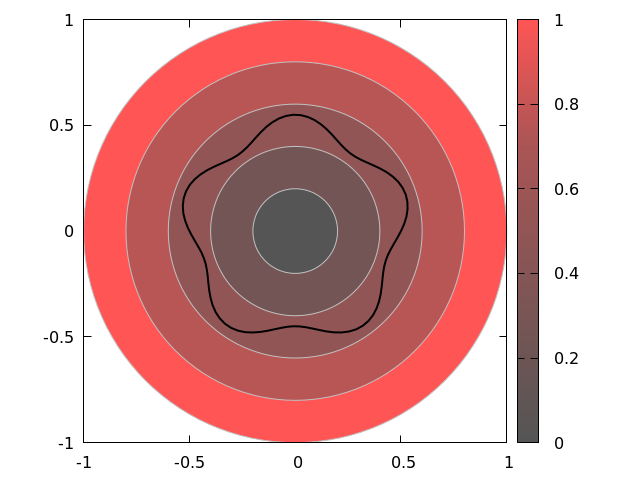
We’ll teach you about gnuplot’s various coordinate systems, including polar coordinates.
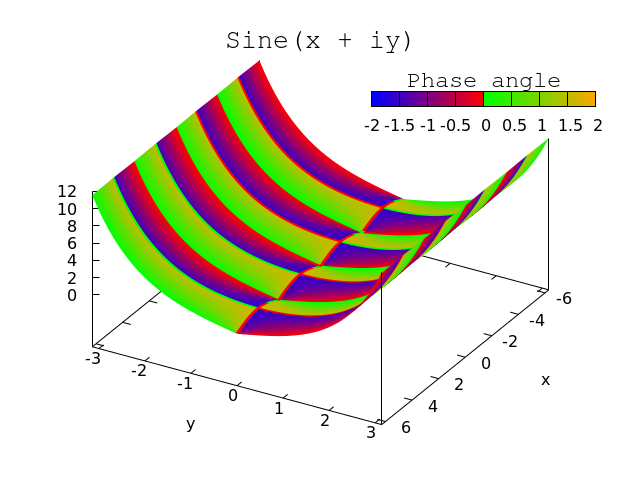
Gnuplot is comfortable with complex numbers.
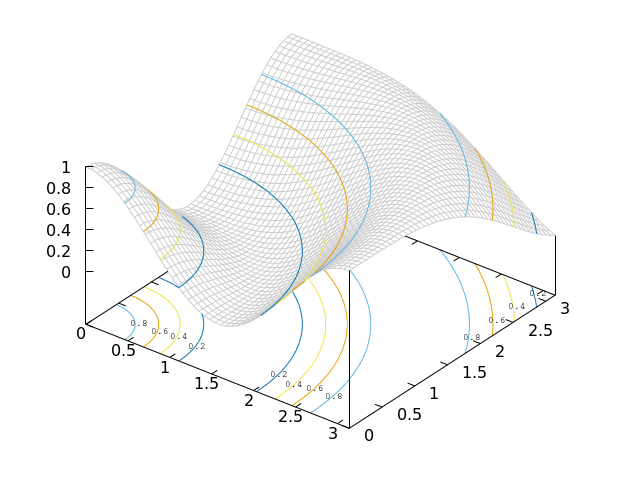
It’s surprisingly easy to draw contours embedded in a surface, with more contours projected onto a plane.
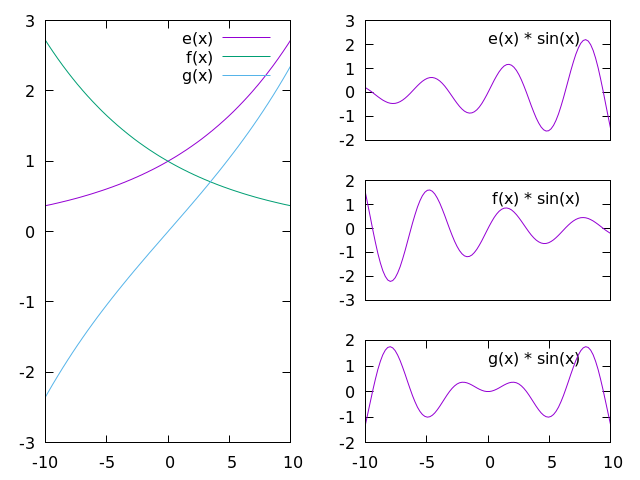
You’ll learn how to lay out multiple plots in any pattern, with no fuss.
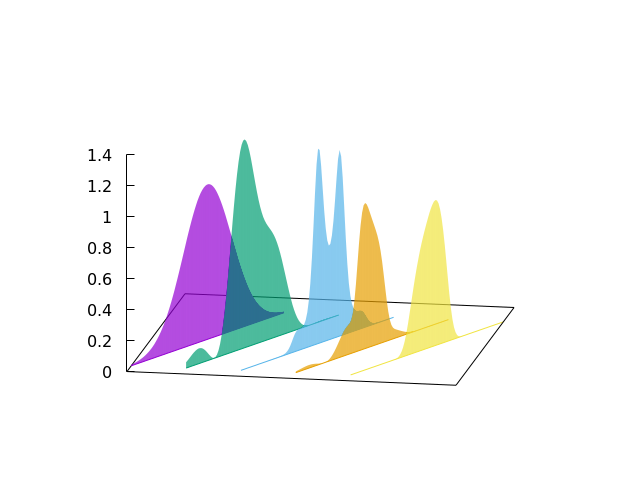
A simple script creates this 3D fence plot.
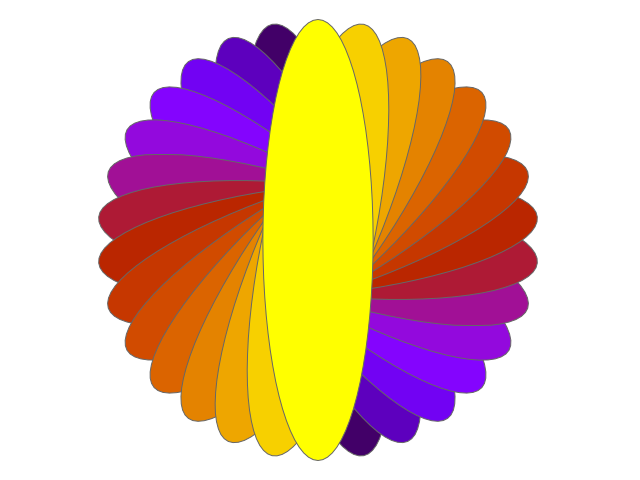
A few lines of code produced this algorithmically generated decoration.