pylab_examples example code: symlog_demo.py
(Source code, png, pdf)
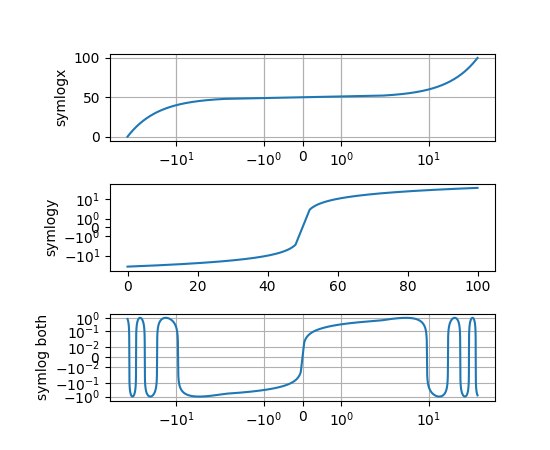
import matplotlib.pyplot as plt
import numpy as np
dt = 0.01
x = np.arange(-50.0, 50.0, dt)
y = np.arange(0, 100.0, dt)
plt.subplot(311)
plt.plot(x, y)
plt.xscale('symlog')
plt.ylabel('symlogx')
plt.grid(True)
plt.gca().xaxis.grid(True, which='minor')  # minor grid on too
plt.subplot(312)
plt.plot(y, x)
plt.yscale('symlog')
plt.ylabel('symlogy')
plt.subplot(313)
plt.plot(x, np.sin(x / 3.0))
plt.xscale('symlog')
plt.yscale('symlog', linthreshy=0.015)
plt.grid(True)
plt.ylabel('symlog both')
plt.subplots_adjust(hspace=0.5, left=0.2)
plt.show()
Keywords: python, matplotlib, pylab, example, codex (see Search examples)