
Sadly, we live in a world with many major ongoing wars, and the risk of additional wars breaking out is nonnegligible.
While the main focus should be on how we can avoid these wars, there is not much that we can do as investors to bring them to a just end in the short term.
However, we owe it to ourselves and clients to analyze how these geopolitical events affect portfolios, and how we can navigate these scenarios in the best tail-risk-adjusted return way.
On slightly longer horizons, wars can perhaps be avoided by purposefully diverging funding to countries and companies that cause them. The earlier we start to do that, the better it is for the world as a whole.
The Python case study in this article uses the Causal and Predictive Market Views and Stress Testing framework to analyze how current major wars affect multi-asset portfolios.
The Causal and Predictive Market Views and Stress Testing framework is a core method of the Fully General Investment Framework (FGIF), which is carefully presented in the Portfolio Construction and Risk Management book and the Applied Quantitative Investment Management course.
Thank you for reading Quantamental Investing. Subscribe to stay updated on new and exclusive content.
Python case study
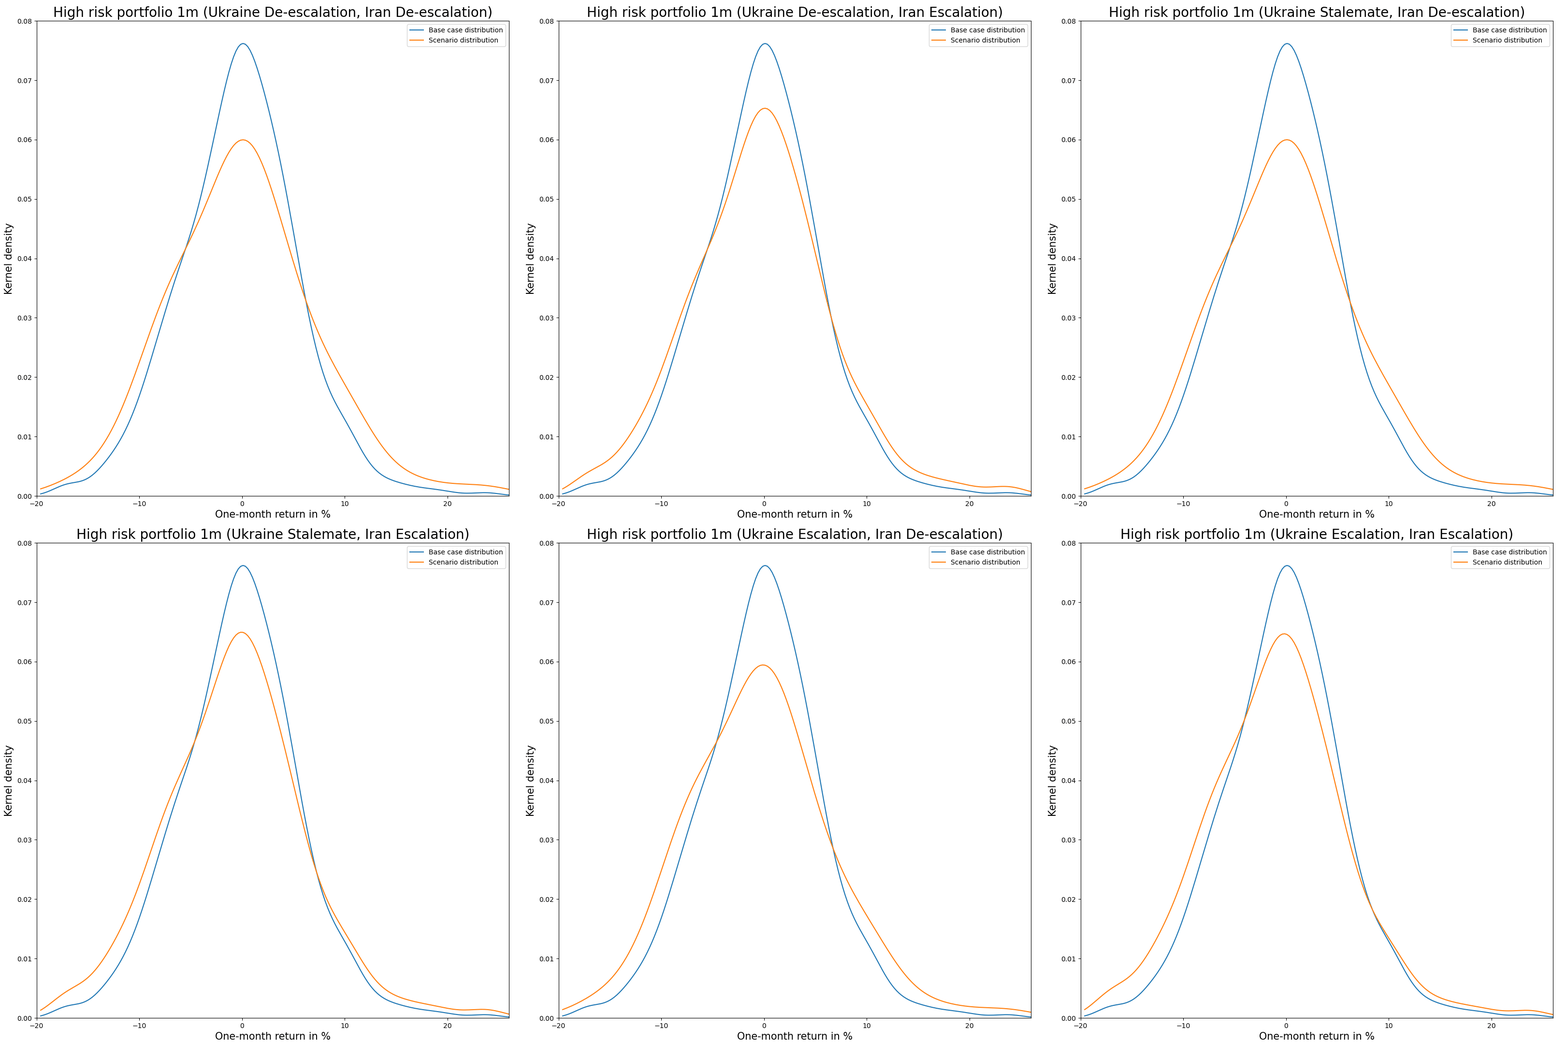
This Python case study uses the Multi-Asset Macro Model implementation of the Fully Flexible Resampling (FFR) method to simulate the P&L of IVV (S&P 500), HYG (US high-yield), LQD (US investment-grade), IEF (7-10y US government bonds), and GLD (gold) as well as the oil price and US tech returns.
We then calculate the effect of various war scenarios on several multi-asset portfolios that include gold.
The Bayesian network includes the war in Iran, the invasion of Ukraine, oil prices as well as a potential Taiwan war and its effect on US technology companies.
You can see an illustration of the Bayesian network below, and you can use the Investment Simulation and Investment Analysis modules to adjust the code with your own hypotheses and probabilities.
Essentially, we are evaluating different joint scenarios for the oil price and US technology companies caused by the above geopolitical events.
While the directional change in the portfolio’s P&L distribution is usually not a big surprise, the analysis allows us to quantify the effect and actually make informed investment decisions.
We use historical data from 30 July 2007 until and including 25 March 2026. The Python code that uses the Investment Simulation module and implements the Multi-Asset Macro Model version of the Fully Flexible Resampling (FFR) method can be found in the PDF just below.
If you enjoy these case studies and want to see more of them, please share the Quantamental Investing publication with people whom you think it might be relevant for. This will allow me to spend more time and energy on them and thereby provide more value for you. Note that there are 20% discounts for group subscriptions in case you want to expense it for you and your colleagues.
Comments
Nothing yet. Say the first thing.
Sign in to join the conversation.