
We’ve spent the better part of the last year building a curriculum for early-stage founders. It started as a favour to a friend and turned into Antidote, an accelerator programme we now run for a small cohort of founders building on Bitcoin, in fintech, and adjacent spaces. Twelve workshops. Many interactions with founders over the last few cycles. Enough conversations at whiteboards and over coffee that we’ve started to notice patterns.
The pattern we want to talk about today is this: almost every founder we meet is flying blind, and doesn’t know it.
They’ve launched. Users are signing up. Some of them are even paying. And when we ask “how’s it going?” we get one of two answers. The first is a vague “yeah, pretty good” — which usually means they don’t actually know. The second is a metric — MRR, sign-ups, page views — quoted with a strange mix of pride and anxiety. Which usually means they do know one number, and are hoping we don’t ask about the ones that would actually tell them if their business is working.
We want to unpack why this happens, and what to do about it. Also — because we couldn’t resist building a thing to solve the problem — we’ve made a tool that helps founders figure out which metrics they should actually care about at their stage. More on that in a bit.
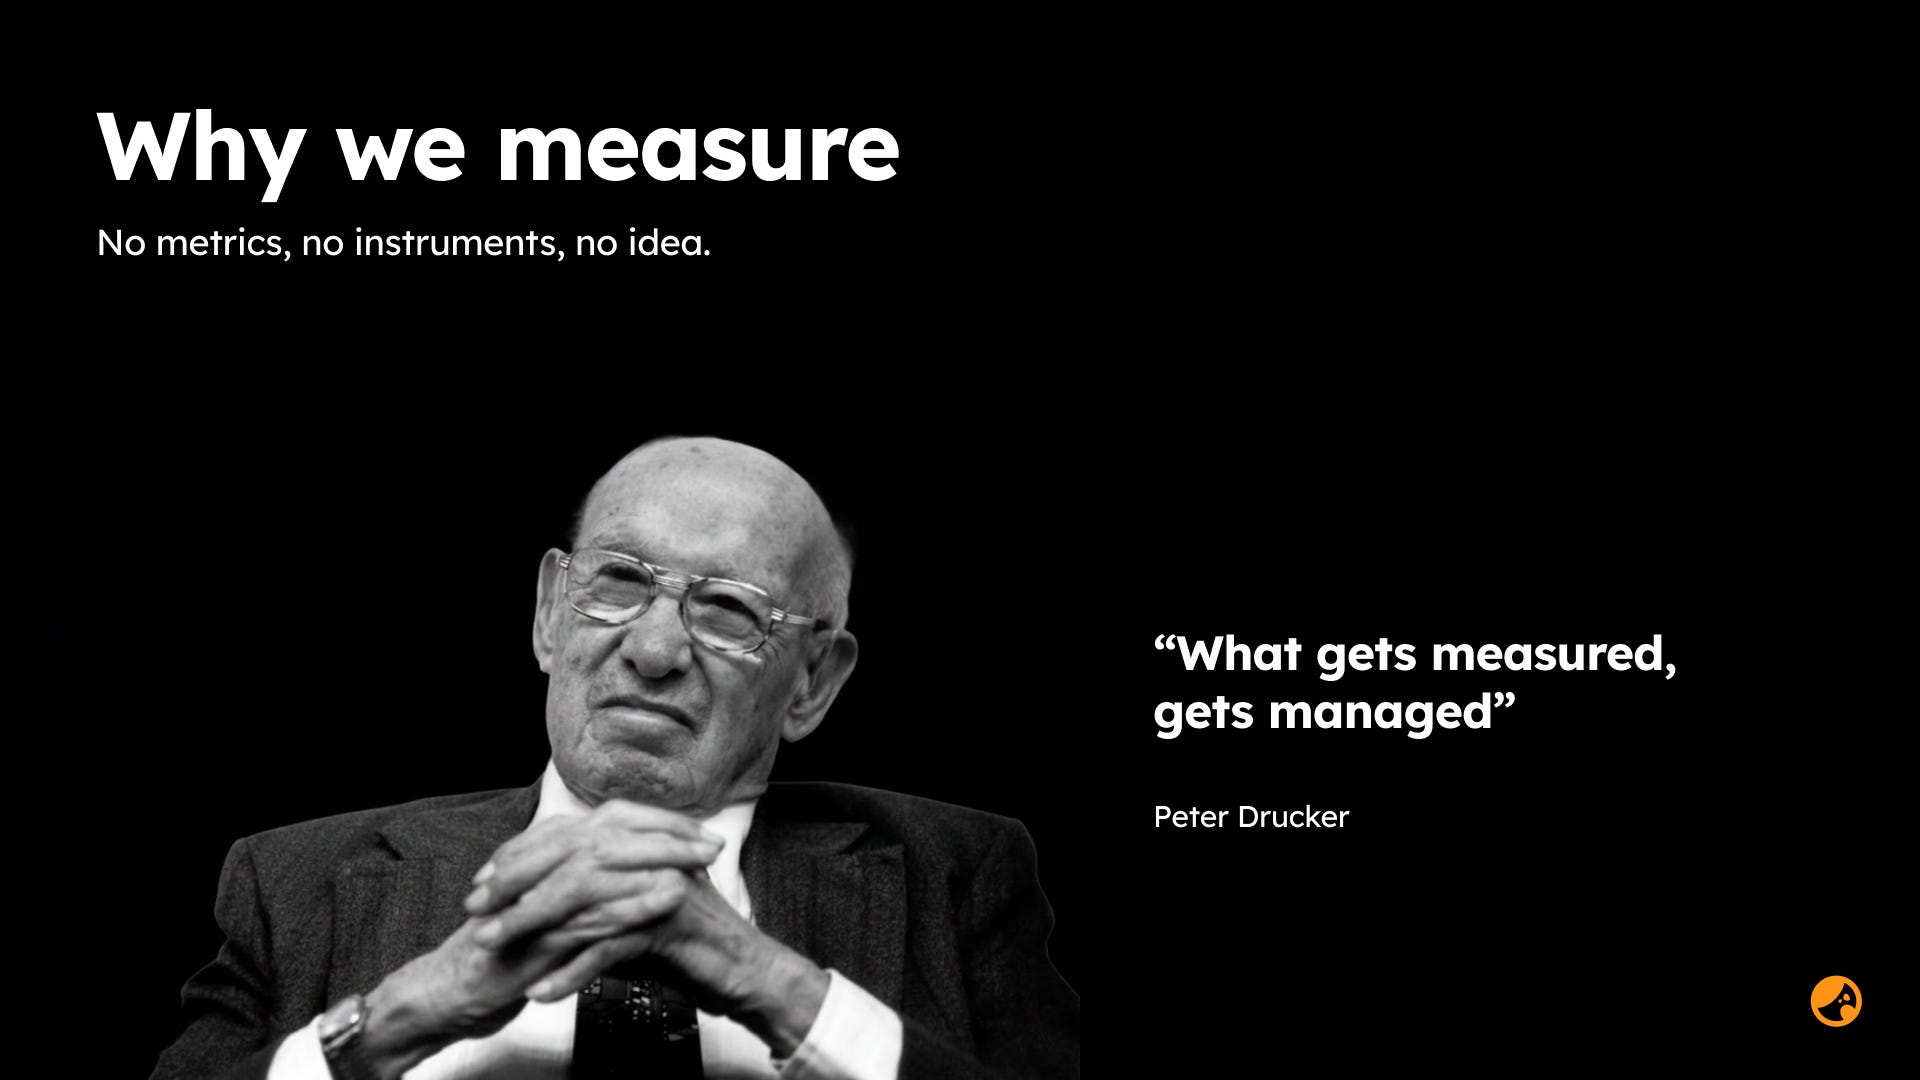
You’ve almost certainly heard the phrase “what gets measured, gets managed.” It’s usually attributed to Peter Drucker, and historians will tell you there’s no actual evidence he ever said it. (The closest documented source is a 1956 paper by a chap called V.F. Ridgway, and — plot twist — his point was the opposite: that measuring the wrong things causes real harm.)
Both are right. What you put a number on becomes what you focus on. Measure the wrong thing and you’ll improve the wrong thing. Measure the right thing and everything starts to click.
This is the whole game. And it’s harder than it sounds, because most founders skip the “figuring out what to measure” step entirely. They grab whatever number is easiest to pull from Stripe or Google Analytics, put it on a dashboard, and hope for the best.
Here’s the trap. A founder tracks one metric — let’s say retention — and stares at it every Monday morning. It’s flat. It stays flat. They keep tracking it. It stays flat. Eventually they either give up and stop looking, or they start tracking twelve other metrics, one of which will inevitably be up-and-to-the-right at any given moment, which they’ll use in their next investor update.
Both failure modes come from the same problem: you can’t move a metric by staring at it.
Retention, revenue, active users — these are lagging indicators. They tell you what already happened. They’re the scoreboard. Watching the scoreboard doesn’t help you win the game.
To actually move those numbers, you need to know what causes them to move. What did your best users do in their first week that your churned users didn’t? What percentage of new sign-ups actually complete the core action that makes the product worth paying for? What’s the ratio of people finding you organically vs. the ones you had to pay for?
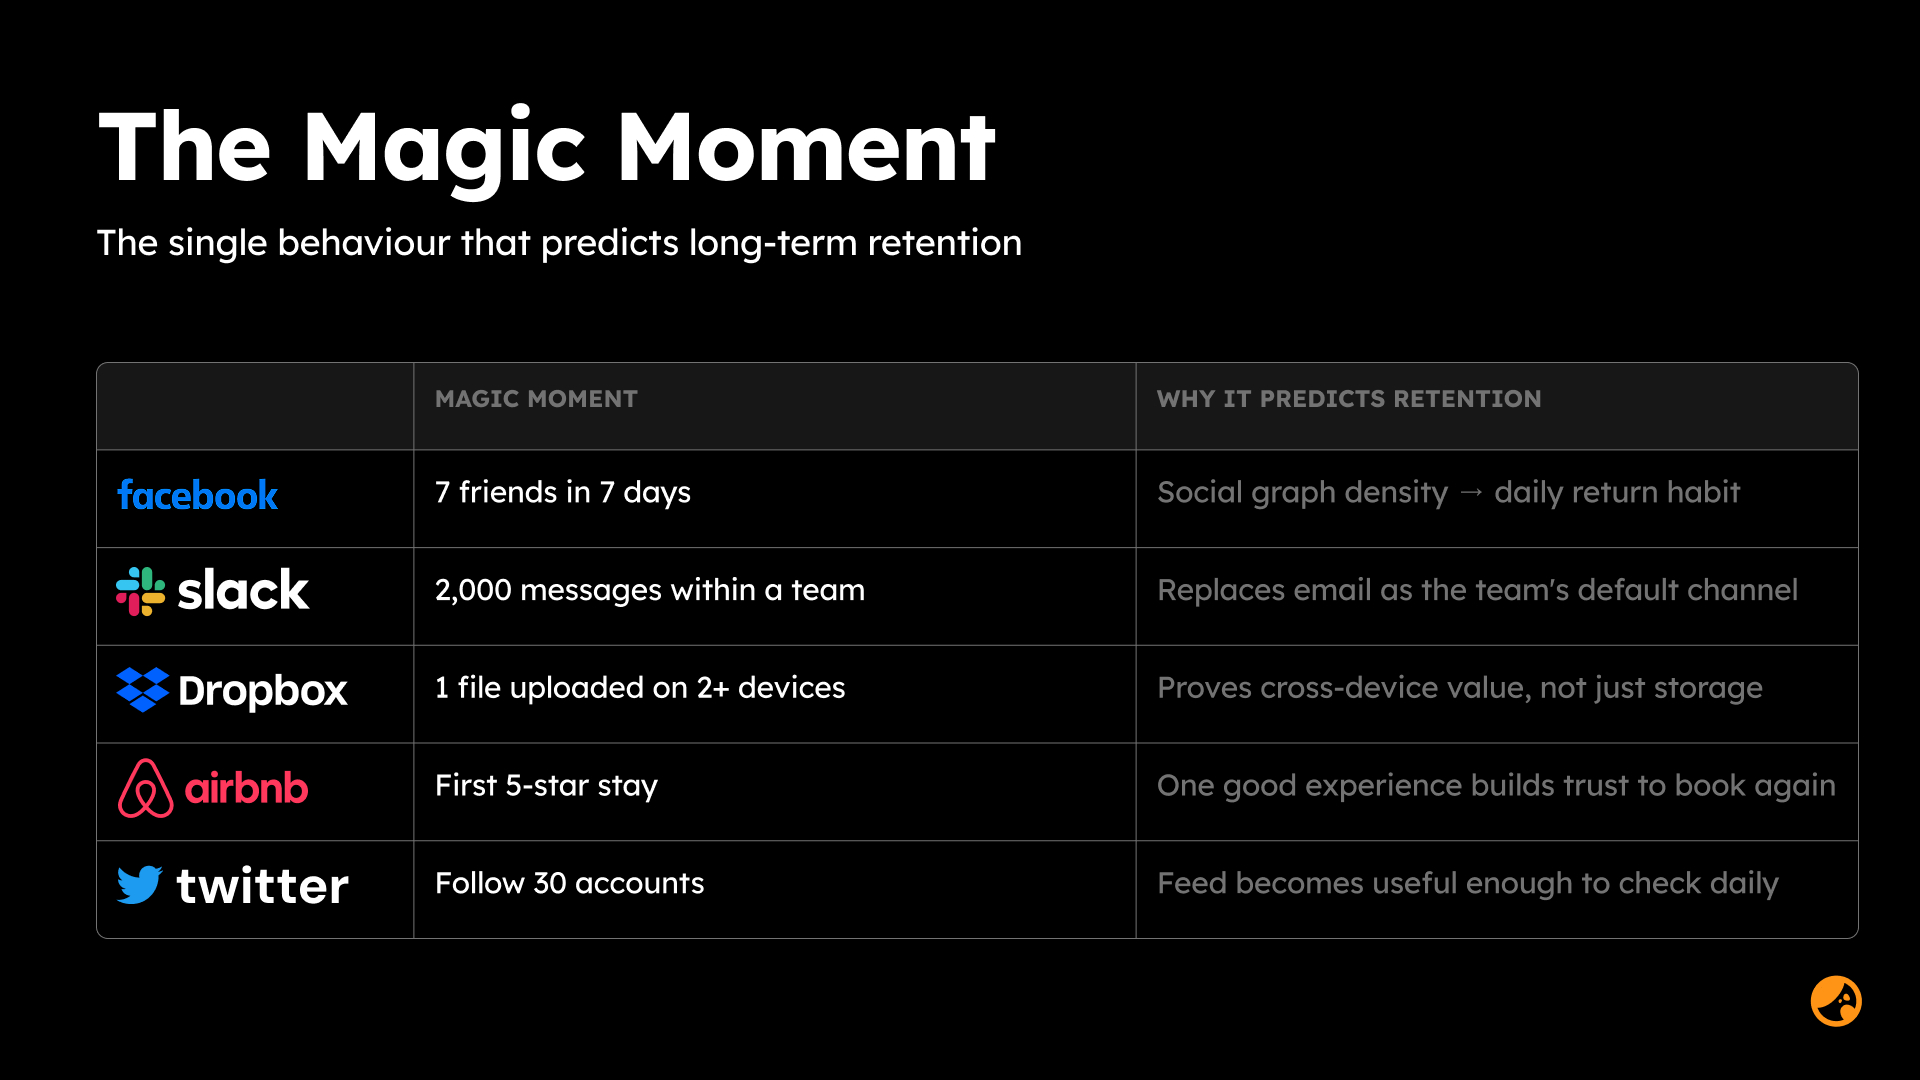
These are your secondary metrics — the leading indicators, the levers. And unlike your primary metric, you can move them, week by week, with product changes, onboarding tweaks, and small experiments.
The mantra we use with the Antidote cohort:
The number is the scoreboard. The levers are the game.
If you only take one thing away from this, take that.
Pick your primary metric — one number, not five — that tells you whether the business is actually working. For most B2B SaaS founders, that’s revenue (MRR or ARR). For most consumer founders, it’s weekly active users, growing month over month.
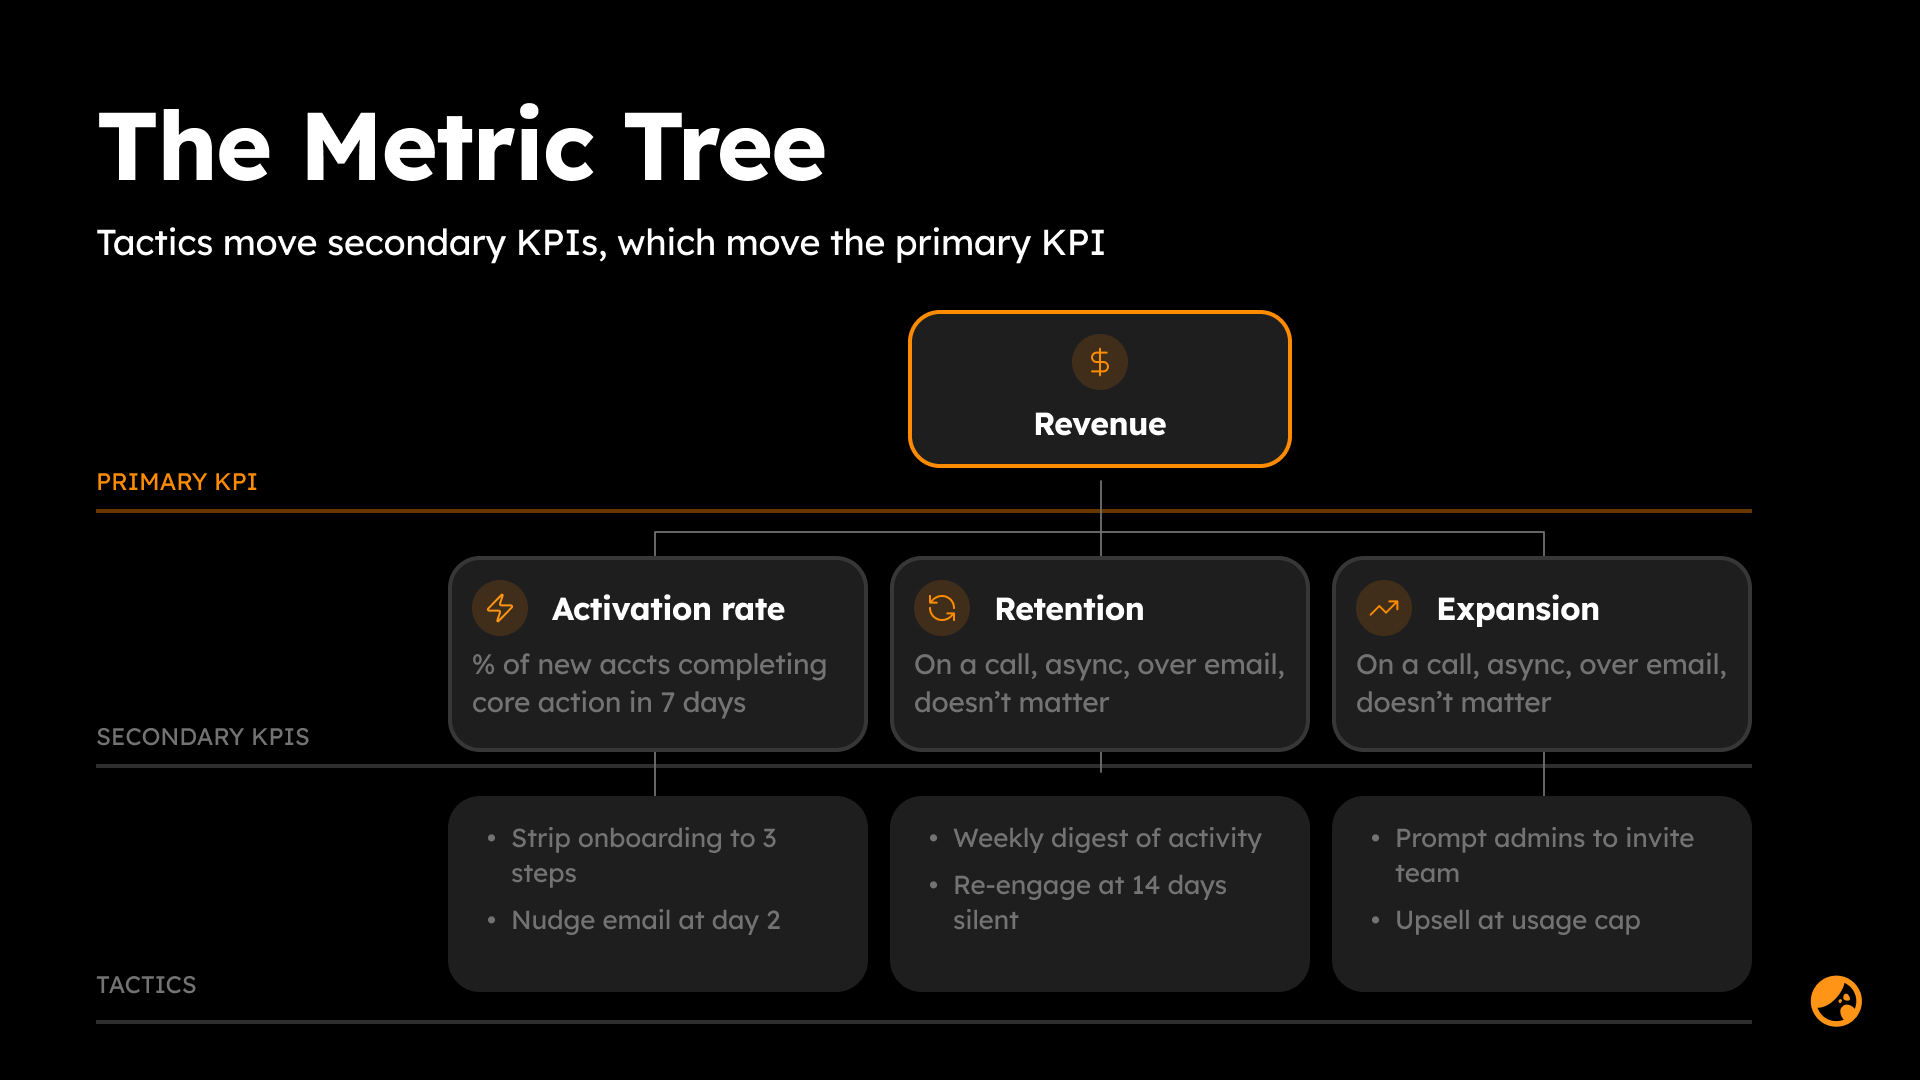
Now pick three to five secondary metrics that you believe cause the primary to move. For a B2B SaaS founder, that might be activation rate (percentage of new accounts that complete the core action in their first week), core-action completion rate (percentage of accounts doing the thing this week), and logo retention (percentage of accounts still paying this month). For a consumer founder: percentage of organic sign-ups, magic-moment conversion rate, and NPS.
Then — and this is the part most people skip — get in the habit of a weekly review. Same time. Same format. Three questions:
Did the primary move?
Why? Which secondary explains it?
What are we shipping this week to push it further?
Thirty minutes. Every week. Forever. This is the ritual that turns data into decisions.
Here’s the problem we run into with every cohort: telling founders “pick three to five secondary KPIs that move your primary” is easy. Actually helping them pick the right ones — that’s the hard bit, and it’s the bit that no framework really solves.
So we built one.
It’s called the KPI Finder, and it does exactly what you’d hope. You answer a handful of questions about your business — B2B or consumer, stage, revenue model, what your product is trying to do — and it spits out a curated stack of KPIs, tiered into three buckets:
Start Here — the metrics you should be tracking now
When You’re Ready — the ones that’ll be genuinely useful once you’re bigger, but will mislead you at your current stage
Avoid for Now — the ones that’ll make you feel good without telling you anything (looking at you, monthly active users when you have 200 sign-ups)
It’s opinionated, which is the whole point. Every KPI in the tool is grounded in the frameworks the accelerator teaches — a lot of which draws on the excellent resources from Y Combinator, Paul Graham’s writing, and years of listening to founders describe what they wish they’d measured earlier.
I’d genuinely love feedback. If you use it and it misses the mark for your business, or tells you something obvious you already knew, or (best case) actually helps — tell me. It’s a living tool and it gets better every time a founder pushes back on it.
If you’re building something early-stage on Bitcoin, in fintech, or adjacent — and you’ve read this far because you recognise yourself in the “flying blind” bit — you should probably apply to Antidote.
The next cohort opens for applications soon. It’s small on purpose, opinionated on purpose, and the KPI workshop above is one of twelve. If nothing else, you’ll walk out with a one-page metric tree for your company, and probably a healthier ritual around your Monday mornings.
Fly with instruments. Don’t stare at the scoreboard. Move the levers.
— Andy
No posts
Comments
Nothing yet. Say the first thing.
Sign in to join the conversation.