
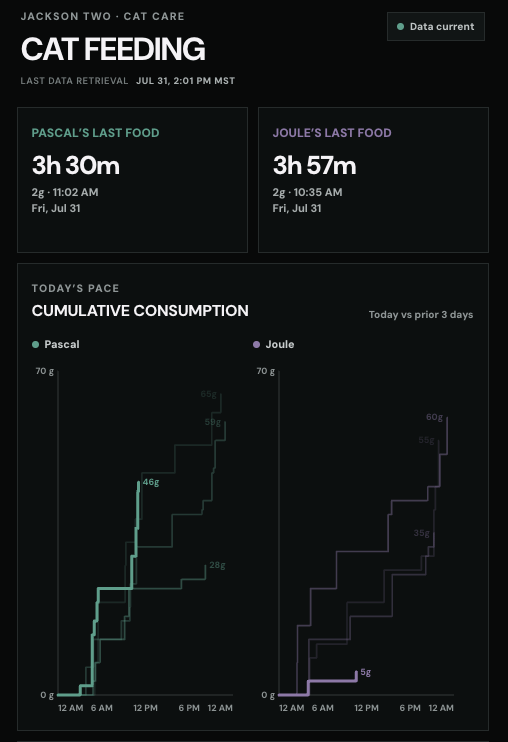
If you’ve been following me for any period of time you’ll know that I have an ongoing project: track food (and water) consumption of my two cats, Pascal and Joule. I’ve been around long enough to realize that the most valuable information for me to gather and stay knowledgeable about is their consumption behavior. It gives the context necessary to understand if they’re potentially ill, under hydrated (a real problem for cats), or have some other problem. I can also infer their daily behavior and notice any patterns.
You’ve probably encountered something similar with your pet. When you head in for a check-up or a one-off visit, the first question invariably turns into “tell me about your pet’s diet.” Historically, this has been notoriously difficult. If you let your pet graze, it is impossible to equate how much food you’ve put into their bowl to a measured amount to share with the veterinarian. If you feed them portioned canned food, it can be difficult to remember the size of the can itself, and it isn’t always guaranteed that your pet actually ate all the food.
Enter the SurePet Microchip Feeder Connect, a pet feeding bowl with a door that opens based on RFID scans of your pet’s microchip. Additionally, because it is the “Connect” there is an external hub that the feeder pushes its readings to. Those readings then get pushed up to the cloud (their servers) and are visible via a mobile app. So in essence, you have a full sensor loop: the feeder scans the pet and opens the door, it records the differential of weighed food in grams, that reading is pushed to the hub, which then pushes it to the cloud, and you’re served up insights within the app.
And worth saying, for me, this has worked seamlessly for years. The only part that hasn’t worked for me are the actual charts and analytical detail that they surface on their app. Like most sensor-oriented devices, the main behavior it exhibits are notifications of feeding events. So on my phone I’ll see “Joule ate 3 grams at 2:45 pm.” That’s potentially useful, but provides no aggregation or orientation. Their mobile app has more detailed charts, including daily, monthly, and some trend history. However, those charts are buried about 4 menus deep and do not provide any sort of comparative analysis.
The resulting experience was this: I never looked at the app and I turned off the notifications. I did get improvement when I did ad-hoc reviews of the data and I had a lot more insight when I went into vet appointments, but the day-to-day awareness I was craving was still absent.
So, in June of 2025, I decided things needed to change. It was time for me to take my cat’s data, develop a Tableau dashboard, and publish that dashboard as a live display in my kitchen. You can read the 2025 version here. At the time, at least for me, there were a few technical hurdles I had to overcome, none of which were related to collecting the data itself. The obstacles were: a source that Tableau could reasonably use to get updated data and embedding the dashboard on a webpage such that it could be viewed in my kitchen. Those were solved by using AI.
Now, in July of 2026, I’ve gone one step further. I’m now hosting the dashboard live on my own website with my home computer pushing the data to my hosting service once every hour. I’ve fully eliminated Tableau from the workflow and the need for the clunky authentication overhead.
The dashboard is viewable here and I encourage you to check it out if you’re interested.
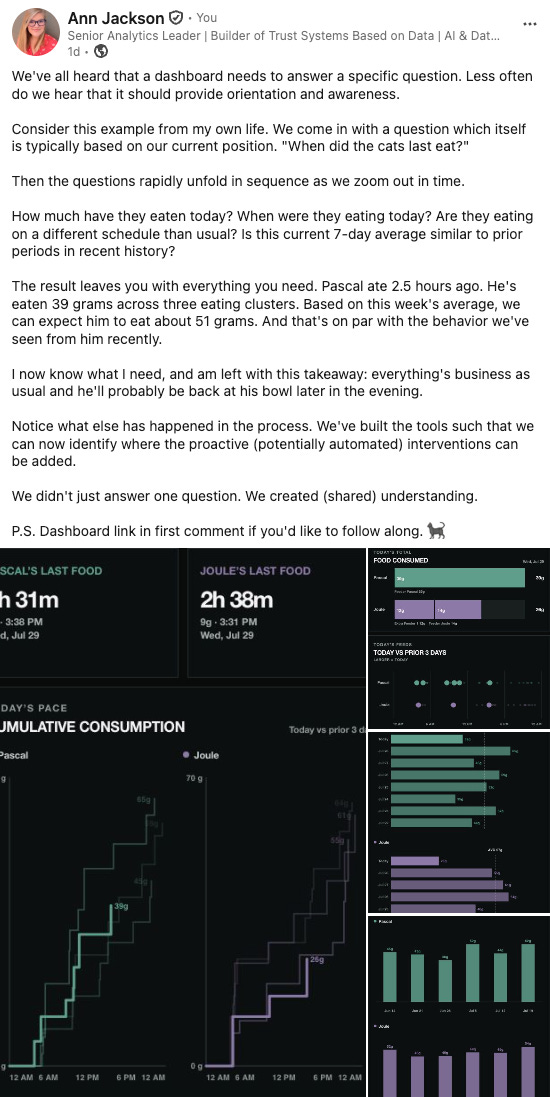
Worth saying here, I also published a short post on LinkedIn discussing the value of orientation dashboards, using this as an example. Here’s that post so you don’t have to switch apps.
To take it one step further, I’ve also gone through the process of making the code fully open source. Now, anyone who has the SurePet Connect system (microchip feeders + connect hub) can take these scripts and have the same dashboard as me. It includes two valuable components: a script that turns API calls into structured data via a CSV (great for Tableau/Excel/Google Sheets) and a JSON version if you decide to push it up to your own hosted dashboard. Here’s the Github repo.
At this point I have no idea how many people actually care, but I am excited to find out! I know for me that having this type of on demand insight into the cats has been beneficial. At the beginning of July, we were able to spot a stomach bug that Pascal had, watch the impact on his eating habits, and monitor him for improvement or regression.
No posts
Comments
Nothing yet. Say the first thing.
Sign in to join the conversation.