
Note from Ann: This is a meta-analysis completely generated by ChatGPT. I did not fact-check the findings, but I did check all the links. It is your responsibility to determine how much you trust the findings.
CENTRAL FINDING
A modern data analyst is best understood not as a user of a particular software tool, but as an intermediary between organizational reality, recorded data, and a decision. The durable professional value lies in establishing reliable understanding: what happened, whether the evidence can be trusted, what it means, and what should happen next.
Research basis. U.S. Bureau of Labor Statistics and O*NET occupational data, supplemented by current university curricula, professional certifications, vendor documentation, and workforce research. Because the United States does not maintain a standalone federal occupation called “Data Analyst,” workforce estimates are presented as ranges and proxies rather than a single definitive count.
Executive Summary
• “Data analyst” is not a clean federal occupational category. O*NET places Business Intelligence Analysts under the broader Data Scientists code, while substantially similar work appears across management, market research, operations research, finance, systems, and domain-specific analyst occupations.
• A defensible way to size the profession is to distinguish a narrow quantitative core from a broad analyst-adjacent envelope. May 2025 BLS counts imply roughly 400,000 workers in a narrow Data Scientist + Operations Research Analyst + Statistician core, while seven analyst-heavy occupations together exceed 3.0 million workers.
• Analysts may be centralized in enterprise data/BI teams, embedded within functions such as Finance or Marketing, or distributed through a federated model that combines central standards with domain ownership.
• The work is sociotechnical. O*NET emphasizes reporting, dashboard and system maintenance, trend analysis, testing, communication, decision support, and recommendations-not simply chart production or coding.
• The most visible tools in 2025 U.S. BI-analyst job postings were SQL, Power BI, Python, Tableau, SAP, Excel, R, cloud platforms, and enterprise software. These are posting mentions, not usage rates.
• The field is degree-biased but educationally heterogeneous. O*NET respondents most often expect a bachelor’s degree, while university programs range from business analytics and dimensional modeling to statistics, optimization, machine learning, and computing.
• AI is lowering the cost of individual analytical actions-querying, coding, cleaning, first-pass visualization, explanation, and documentation. This shifts professional differentiation toward problem formulation, measurement judgment, system understanding, verification, and decision communication.
1. Defining the Profession and Sizing the Workforce
The first difficulty in describing the data-analyst profession is taxonomic: the U.S. Bureau of Labor Statistics does not publish a standalone occupation titled “Data Analyst.” O*NET’s Business Intelligence Analyst occupation is one of the closest formal matches, but its wage and employment series are tied to the broader Data Scientists occupation. At the same time, “data analyst” work is distributed across many other occupational families.[1]
For that reason, a single headcount such as “there are X data analysts in America” creates false precision. A more useful approach is to define the boundary explicitly and show the resulting range. The employment estimates below use May 2025 Bureau of Labor Statistics Occupational Employment and Wage Statistics counts.[2]
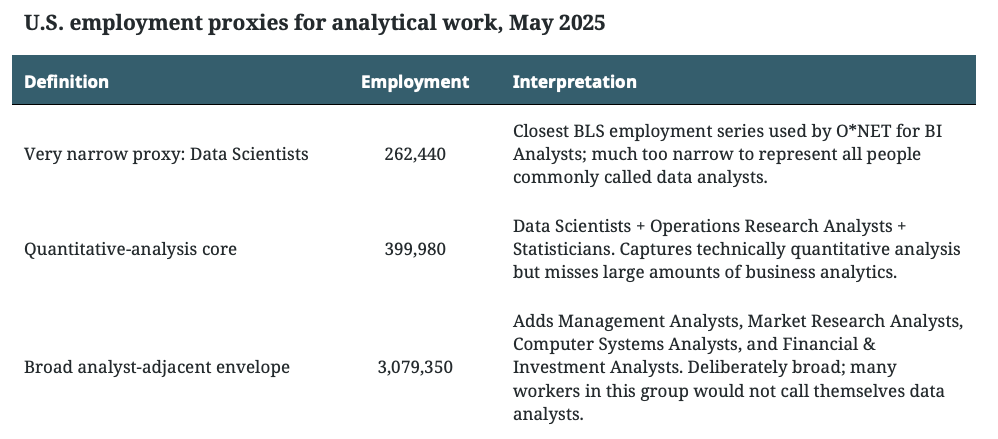
The broadest defensible conclusion is therefore that narrowly defined analytical occupations contain hundreds of thousands of U.S. workers, while several million Americans work in occupations where data analysis is a central or substantial component. Beyond them is a still larger population of “analytical workers”: accountants, marketers, operators, product managers, healthcare professionals, sales leaders, and other office workers who perform meaningful analysis without belonging to an analytics occupation.
A useful working definition
A modern data analyst can be defined as a professional intermediary between organizational reality, recorded data, and a decision. The work includes acquiring evidence, structuring it, interrogating it, validating it, interpreting it, communicating it, and connecting it to action. O*NET’s BI Analyst task inventory includes standard and custom reporting, maintaining BI tools and dashboards, analyzing trends, specifying outputs, testing whether intelligence meets defined needs, and synthesizing evidence into recommendations.[3]
2. Where Data Analysts Live in the Organization
Organizational placement often explains more about an analyst’s actual job than the title itself. Modern data teams commonly follow one of three structures: centralized, decentralized/embedded, or federated. In centralized models, analysts sit together in a BI, Data & Analytics, Enterprise Analytics, Center of Excellence, or CDO/CIO organization. In embedded models, analysts belong directly to functions such as Finance, Marketing, Product, or Operations. Federated models combine a central group that owns standards, platforms, and governance with analysts located closer to business domains.[4]
The BI-analyst proxy is itself distributed across industries. O*NET reports 28% in professional, scientific, and technical services; 19% in finance and insurance; 11% in information; 10% in management of companies and enterprises; and the remaining 32% across other industries, including healthcare and administrative/support services.[5]
Domain knowledge is part of the analytical instrument
The same technical skill set can produce very different professions depending on context. A marketing analyst may focus on acquisition, attribution, segmentation, and customer behavior. A product analyst may focus on funnels, retention, feature adoption, cohorts, and experiments. A finance analyst may emphasize plan-versus-actual performance, forecasting, profitability, and business cases. An operations analyst may examine staffing, throughput, capacity, inventory, and service levels. In healthcare, analysis may require detailed knowledge of claims, utilization, reimbursement, or clinical quality. BLS makes a similar point for computer systems analysts: industry-specific knowledge can matter enough that hospital analysts need healthcare-program knowledge and financial-industry analysts need finance knowledge.[6]
3. What the Work Actually Involves
The textbook workflow-receive a clean dataset, analyze it, discover an insight, visualize it, and present the finding-is usually an incomplete picture. Real analytical work often begins with an ambiguous request and proceeds through definition, sourcing, reconciliation, validation, investigation, interpretation, communication, and maintenance.
A typical project may involve clarifying what a stakeholder actually means; locating the relevant data; discovering conflicting definitions of the same metric; choosing or negotiating a legitimate definition; joining and restructuring data; validating results against another system; investigating anomalies; separating data artifacts from real-world changes; revising the analysis; producing a consumable artifact; documenting limitations; and then maintaining or modifying that artifact as new questions appear.
O*NET’s work context reinforces that this is not primarily a solitary coding job. Ninety-five percent of BI Analyst respondents report using email every day; 95% say teamwork is at least important, with 81% rating it very or extremely important; 91% rate exactness as very or extremely important; 64% encounter strict deadlines at least weekly; and one-third report working more than 40 hours in a typical week.[7]
Typical units of work and project scale
There is no strong national dataset that reports analyst project duration, so the following ranges should be treated as practitioner-oriented estimates rather than government benchmarks:
• A small ad-hoc request may take 30 minutes when trusted metrics and reusable data already exist, or several days when definitions and data access have to be resolved.
• A diagnostic investigation-such as explaining a decline in conversion, utilization, throughput, or retention-often spans several days to a few weeks because it requires comparison, segmentation, validation, and hypothesis testing.
• A change to a mature dashboard may take hours; a new dashboard that requires new measures, data preparation, QA, publishing, security, and stakeholder iteration is commonly a multi-week analytical product.
• A governed KPI suite, semantic model, operational reporting environment, or cross-functional measurement system can become a multi-month initiative.
The implication is important: the calendar time of analytics is frequently dominated by data availability, unclear definitions, reconciliation, quality assurance, stakeholder alignment, and organizational dependencies-not by the mechanical difficulty of producing a chart.
The preparation burden also remains substantial. In Alteryx’s 2025 survey of 1,400 analysts and data workers, 76% reported relying on spreadsheets for data preparation and 45% reported spending more than six hours per week on cleansing and preparation. Because the study is vendor-sponsored and specifically sampled data workers with organizational AI exposure, its figures are better interpreted directionally than as estimates for the entire U.S. workforce.[8]
The problems analysts are actually solving
Analytical work can be usefully organized into six problem types:
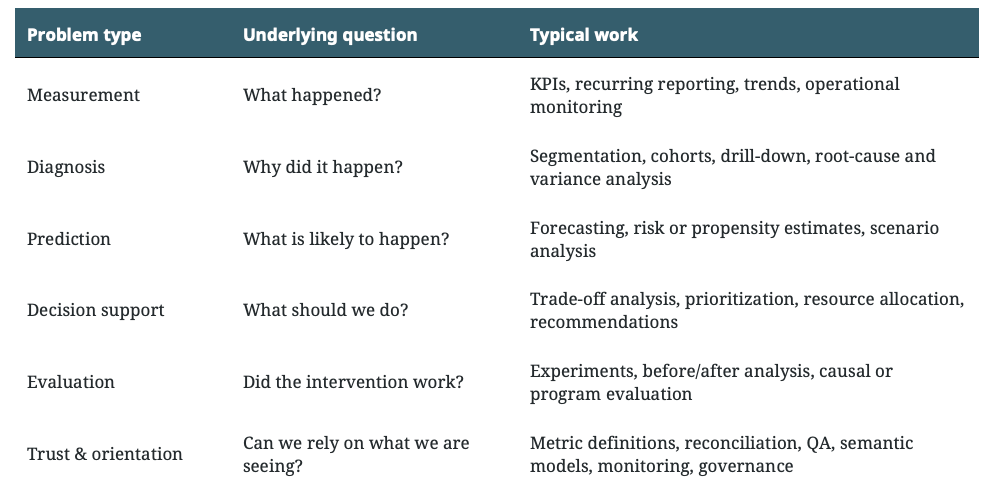
The last category-trust and orientation-is especially easy to understate. Much analytical labor is devoted not to discovering a spectacular hidden truth, but to establishing what is known, what changed, how much confidence to place in it, and where to look next. O*NET’s own task inventory explicitly includes testing intelligence against defined needs and synthesizing findings to support recommendations.[9]
4. The Major Analyst Archetypes and Role Boundaries
The profession is more coherent when viewed as a set of overlapping archetypes rather than a single standardized role.
• Reporting and BI analysts build and maintain recurring information products: metrics, dashboards, executive reporting, and operational visibility.
• Embedded business or domain analysts work inside Finance, Operations, Marketing, HR, healthcare, and other functions. Their comparative advantage is often domain understanding as much as technical depth.
• Product and growth analysts work closer to digital behavior, funnels, retention, cohorts, feature measurement, and experimentation.
• Decision and operations analysts are more likely to use forecasting, simulation, optimization, resource allocation, and operations-research methods.
• Research and quantitative analysts lean further into statistics, experimental methods, surveys, economics, risk, or specialized modeling.
• Technical BI analysts increasingly overlap with analytics engineering through reusable transformations, semantic models, testing, version control, and production-quality analytical infrastructure.
Modern data-team frameworks explicitly separate-but acknowledge overlap among-data analysts, BI analysts, analytics engineers, data scientists, data engineers, data product managers, and governance roles. Smaller organizations may collapse several of these responsibilities into one person.[10]
Common neighboring roles
A Business Analyst traditionally begins with the business process: requirements, workflows, systems, stakeholders, and organizational change. A Data Analyst begins closer to evidence: querying, cleaning, measuring, analyzing, visualizing, and interpreting data. A BI Analyst is often a particularly business-facing version of the data analyst, with heavier responsibility for recurring reporting, dashboards, KPIs, and intelligence delivery. An Analytics Engineer focuses on making analytical data reusable and dependable through transformations, modeling, testing, documentation, and semantic structure. A Data Scientist typically extends further into statistical modeling, prediction, machine learning, and algorithm development.
These boundaries are not clean. Microsoft’s current Power BI Data Analyst profile, for example, expects practitioners to work with business stakeholders and analytics/data engineers while preparing data, modeling it, visualizing and analyzing it, and managing and securing Power BI assets.[11]
5. The Tool Stack in 2026
The modern analyst stack spans data access, preparation, storage, modeling, analysis, presentation, and operationalization. O*NET’s employer-posting data provides one of the clearest current signals of what employers explicitly request.[12]
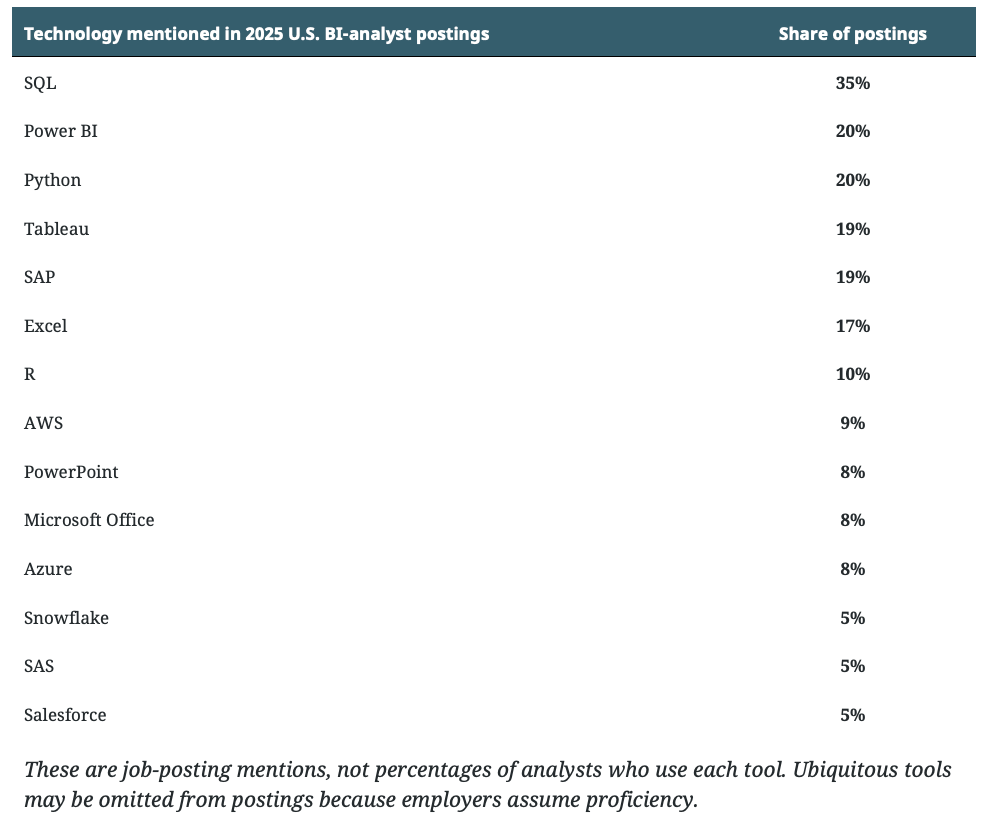
The tool stack is better understood in layers than as a list of competing products:
• Access and acquisition: SQL, APIs, exports, spreadsheets, and operational-system connections.
• Preparation and transformation: SQL, Power Query, Python/R, Alteryx, dbt, and warehouse-native transformations.
• Storage and platform: cloud warehouses, lakehouses, relational databases, and enterprise platforms such as Snowflake, Databricks, BigQuery, SQL Server, and Redshift.
• Modeling and semantics: dimensional models, Power BI semantic models, Tableau data sources, dbt models/metrics, governed definitions, and metadata.
• Analysis: SQL, spreadsheets, notebooks, statistical software, and increasingly conversational or agentic interfaces.
• Presentation and distribution: Tableau, Power BI, Looker, spreadsheets, slides, reports, and purpose-built analytical applications.
• Operationalization: alerts, subscriptions, workflows, APIs, embedded analytics, applications, and AI-assisted interfaces.
O*NET’s broader software inventory also includes Git, Jira, ERP and CRM systems, databases, cloud services, presentation software, GIS, medical systems, and many other categories. This breadth is a clue that “data analyst” describes a relationship to information more than proficiency with any single application.[13]
6. Education, Credentials, and Entry Paths
Formal education
The profession remains degree-biased. In ONET’s education survey for Business Intelligence Analysts, 68% of respondents reported that a bachelor’s degree is required for a new hire, 23% reported a master’s degree, and 5% reported an associate degree. ONET classifies the occupation in Job Zone Four, indicating considerable preparation.[14]
The educational pipeline is nevertheless heterogeneous. Computer systems analysts commonly come from computer science or information systems, but BLS notes that some employers hire people with business or liberal-arts degrees when they also have relevant skills. That pattern generalizes well to analytics: people commonly enter from business, finance, economics, marketing, mathematics, statistics, computer science/MIS, social science, and domain-specific programs.[15]
Higher education now includes explicit Business Analytics and Data Analytics programs. NCES classifies Business Analytics as the application of data-science methods to business challenges and includes topics such as machine learning, optimization, algorithms, probability, logistics, strategy, consumer behavior, marketing, and visual analytics.[16]
Program design varies. Arizona State University’s BS in Business Data Analytics emphasizes data gathering, cleansing, integration, modeling, warehousing, dimensional modeling, visualization, data mining, and predictive analytics.[17] Georgia Tech’s MS in Analytics combines computing, statistics, operations research, business, visualization, machine learning, regression, forecasting, simulation, and optimization.[18] WGU’s competency-based BS explicitly balances programming, mathematics, and business influence, including communication, systems thinking, change management, design thinking, and storytelling.[19]
Alternative education and certification
A mature nontraditional ecosystem now exists alongside degree programs. These credentials tend to signal different things rather than serving as interchangeable substitutes for one another.
• Google Data Analytics Certificate: an entry-level pathway requiring no prior degree or experience; covers analytical process, SQL, R/Python, Tableau, communication, and AI-assisted analytics.[20]
• Microsoft PL-300 Power BI Data Analyst Associate: platform-specific preparation spanning data preparation, modeling, visualization/analysis, usability/storytelling, and management/security; current objectives were updated for April 20, 2026.[21]
• Salesforce Certified Tableau Data Analyst: frames the practitioner around understanding a business problem, identifying data to explore, and delivering actionable insights using Tableau products.[22]
• Databricks Certified Data Analyst Associate: platform-oriented assessment covering governed data discovery, SQL, cleaning, modeling, query execution, and visualization in the Databricks Data Intelligence Platform.[23]
• SnowPro Advanced: Data Analyst: validates advanced SQL, preparation/loading, transformations, UDFs, descriptive/diagnostic/predictive analysis, and presentation of data to meet business requirements.[24]
• IIBA Certification in Business Data Analytics (CBDA): less tool-centric, with domains covering research questions, data sourcing, analysis, interpretation/reporting, influence on business decisions, and organization-level analytics strategy.[25]
These credentials are therefore best viewed as different signals. A university degree signals broad preparation; an entry certificate provides a coherent on-ramp; Power BI or Tableau certification signals platform competence; Databricks or Snowflake certification signals data-platform competence; and IIBA signals business-analysis methodology. None alone demonstrates mastery of ambiguous real-world analytical judgment.
7. Continued Learning and Professional Development
Analytics has an unusual continuing-education problem: some knowledge changes quickly while other knowledge has a very long half-life.
• Platform and tool knowledge decays quickly. Vendor documentation, release notes, Microsoft Learn, Salesforce Trailhead, Databricks Academy, Snowflake learning resources, and product communities help practitioners maintain operational currency. The PL-300 objectives, for example, were revised again in 2026.[26]
• Applied practice builds fluency. Public datasets, challenge communities, notebooks, portfolio work, and realistic business exercises are useful because they force the analyst to interrogate something rather than merely memorize features.
• Foundational analytical disciplines have longer half-lives. Statistics, experimental design, causal inference, forecasting, dimensional modeling, visualization, and communication are often better developed through books, university courses, workshops, and sustained practice.
• Domain learning is often underestimated. Understanding the physical, financial, operational, clinical, or customer process that generated the data is frequently what prevents technically correct analysis from becoming substantively wrong.
The learning asymmetry
The easiest analytical education to find is usually procedural: how to write a JOIN, create a calculated field, use DAX, build a bar chart, call a pandas function, or pass a certification exam. The harder material concerns analytical judgment: selecting the right denominator, establishing a valid comparison, respecting ordinality, testing whether a metric measures the intended construct, distinguishing signal from data artifact, evaluating uncertainty, or deciding what evidence would actually change a decision.
PROFESSIONAL-DEVELOPMENT GAP
The analytics ecosystem contains abundant tool instruction and much less explicit instruction in analytical judgment. Those are not the same competency.
8. Compensation, Career Progression, and Professional Identity
Because “Data Analyst” is not a clean federal occupation, there is no single national salary benchmark that maps neatly to the profession. Adjacent BLS occupations illustrate the spread: May 2024 median annual pay was $76,950 for market research analysts, $91,290 for operations research analysts, $101,190 for management analysts, $103,790 for computer systems analysts, and $112,590 for data scientists. These occupations differ materially, so the range is more informative as context than as a salary estimate for a generic data analyst.[27]
Career progression also moves sideways as much as upward. A junior analyst may become a senior or principal analyst, analytics manager, product analyst, BI engineer, analytics engineer, data scientist, operations-research analyst, analytics product manager, strategy/operations leader, or domain leader. Maturity is often expressed less as greater software fluency than as greater ownership of ambiguous decisions, reusable analytical systems, and organizational consequences.
9. The Hidden Population: Analytical Workers
The identifiable professional analyst is only one part of the analytical workforce. A second, much larger population performs analytical work without “analyst” being the core occupational identity: a finance manager in Excel, a marketing manager interrogating campaign data, an operations leader exporting Salesforce records, a product manager exploring event telemetry, a healthcare administrator examining utilization, or an executive asking a conversational analytics system a question.
As analytical interfaces become easier to use, these workers can perform more analytical operations without becoming professional analysts. This expands the audience for analytical standards, semantic governance, quality controls, visualization principles, and AI-assisted analytical guidance far beyond the occupational population that carries “analyst” in a job title.
10. AI and the Future of the Profession
AI is changing the economics of analytical production more quickly than it is changing the underlying need for reliable evidence. It can lower the cost of writing SQL, translating natural language into Python, cleaning awkward data, generating first-pass charts, documenting logic, explaining formulas, and proposing hypotheses. At the same time, legacy work patterns remain visible: the Alteryx survey found widespread AI-reported productivity benefits alongside continued heavy dependence on spreadsheets for preparation.[28]
The result is not a simple disappearance of the analyst. It is a shift in which parts of the role remain scarce.
A likely bifurcation
One branch of analyst work is increasingly automatable: receive a ticket, pull data, create a report, make a chart, and send the result. Conversational analytics and agentic systems can progressively absorb portions of that workflow.
The more durable branch is broader: understand the system; decide what should be observed; encode business meaning; establish trustworthy metrics; recognize ambiguity; investigate deviations; validate evidence; design useful analytical products; connect findings to decisions; and improve the observational system based on what happens next. In this form, the analyst is less a scarce operator of software and more an analytical systems thinker.
Contemporary data-team structures are already broadening in this direction. IBM’s 2025 framework includes analytics engineering, data products, governance, and business-oriented data roles alongside traditional analysts, scientists, and engineers.[29]
The durable professional moat
O*NET’s competency model emphasizes critical thinking, judgment and decision-making, complex problem solving, systems analysis and evaluation, communication, mathematical reasoning, monitoring, attention to detail, and dependability. These capabilities suggest a durable professional core that is not reducible to software operation.[30]
• Problem formulation: turning fuzzy curiosity or organizational discomfort into an investigable question.
• Measurement judgment: understanding constructs, definitions, grain, time, comparison, categorization, and uncertainty.
• Epistemic judgment: knowing what the evidence does and does not justify.
• System understanding: knowing what process generated the data and how changes propagate through it.
• Decision communication: creating enough shared understanding that people can orient themselves and act.
11. The Professionalization Gap
Analytics has professionalized production more successfully than it has professionalized analytical judgment. There are widely recognized credentials for Power BI, Tableau, Snowflake, Databricks, business analysis, statistics, and data science. There is far less agreement about how to certify integrated competence in measurement, comparative reasoning, semantic structure, visual reasoning, uncertainty, causal thinking, analytical product design, organizational context, and decision quality.
That integrated competency is typically accumulated through experience, mentorship, domain exposure, repeated contact with real decisions, and sustained study. The unevenness of that learning helps explain why two people with similar tool credentials can produce analytical work of very different quality.
Conclusion: The Output Is Reliable Understanding
The profession is easiest to misunderstand when it is defined by artifacts. Dashboards, SQL queries, notebooks, spreadsheets, statistical models, and presentations are outputs of analytical work, but they are not its fundamental purpose.
The deeper function is to establish a defensible relationship between what is happening in an organization and what the organization believes is happening. Analysts create measurements, reconcile definitions, expose patterns, test explanations, communicate uncertainty, preserve context, and build recurring systems for observation.
A CONCISE DEFINITION
The data analyst’s real product is reliable understanding. Analytical artifacts are the mechanisms through which that understanding is produced, tested, stored, and transmitted.
That framing also clarifies the significance of AI. If software can increasingly produce queries, charts, explanations, and even complete analytical interfaces, the central quality question becomes less “Can the system make an analytical artifact?” and more “What intelligence governs what it chooses to measure, compare, trust, explain, and recommend?”
The answer to that question will shape not only the future of the data-analyst occupation, but the analytical quality of a much larger population of workers who are gaining the ability to interrogate organizational data directly.
Research Notes and Limitations
This brief uses the O*NET Business Intelligence Analyst occupation as a recurring proxy because it closely matches common “data analyst” work, while explicitly avoiding the assumption that it represents the entire profession. Employment estimates combine BLS occupations to show how the answer changes with the boundary used. The broad envelope is intentionally inclusive and should not be interpreted as a count of workers who personally identify as data analysts.
Job-posting technology percentages describe the share of postings that explicitly mention a technology, not the percentage of practitioners who use it. Project-duration estimates are synthesized practitioner ranges because federal occupational datasets do not report the duration of typical analytical tickets or projects. Vendor-sponsored workforce surveys are identified as such and used directionally.
[1] U.S. Department of Labor, O*NET OnLine, “Business Intelligence Analysts (15-2051.01),” updated 2026. https://www.onetonline.org/link/summary/15-2051.01. Accessed August 9, 2026.
[2] U.S. Bureau of Labor Statistics, “National employment and wage data by occupation, May 2025,” Occupational Employment and Wage Statistics. https://www.bls.gov/news.release/ocwage.t01.htm. Accessed August 9, 2026.
[3] U.S. Department of Labor, O*NET OnLine, “Business Intelligence Analysts: Tasks and Detailed Work Activities.” https://www.onetonline.org/link/details/15-2051.01. Accessed August 9, 2026.
[4] Alice Gomstyn and Alexandra Jonker, “Modern data teams: Key roles, structures and challenges,” IBM Think, December 15, 2025. https://www.ibm.com/think/topics/how-to-structure-a-modern-data-team. Accessed August 9, 2026.
[5] U.S. Department of Labor, O*NET OnLine, “Industries: Business Intelligence Analysts.” https://www.onetonline.org/link/industry/15-2051.01. Accessed August 9, 2026.
[6] U.S. Bureau of Labor Statistics, Occupational Outlook Handbook, “Computer Systems Analysts,” last modified August 28, 2025. https://www.bls.gov/ooh/computer-and-information-technology/computer-systems-analysts.htm. Accessed August 9, 2026.
[7] U.S. Department of Labor, O*NET OnLine, “Business Intelligence Analysts: Work Context,” updated 2026. https://www.onetonline.org/link/details/15-2051.01. Accessed August 9, 2026.
[8] Alteryx, “2025 State of the Data Analyst,” 2025. https://www.alteryx.com/resources/report/2025-state-of-the-data-analyst. See also Alteryx newsroom summary: https://www.alteryx.com/about-us/newsroom/press-release/new-research-reveals-that-ai-brings-productivity-gains-but-reliance-on-spreadsheets-puts-data-quality-at-risk. Accessed August 9, 2026. Vendor-sponsored survey; results should be interpreted directionally rather than as a national workforce estimate.
[9] U.S. Department of Labor, O*NET OnLine, “Business Intelligence Analysts: Tasks and Detailed Work Activities.” https://www.onetonline.org/link/details/15-2051.01. Accessed August 9, 2026.
[10] IBM Think, “Modern data teams: Key roles, structures and challenges,” December 15, 2025. https://www.ibm.com/think/topics/how-to-structure-a-modern-data-team. Accessed August 9, 2026.
[11] Microsoft Learn, “Study guide for Exam PL-300: Microsoft Power BI Data Analyst,” last updated March 20, 2026; skills measured as of April 20, 2026. https://learn.microsoft.com/en-us/credentials/certifications/resources/study-guides/pl-300. Accessed August 9, 2026.
[12] U.S. Department of Labor, O*NET OnLine, “Employer-Based In Demand Software Skills: Business Intelligence Analysts,” based on Lightcast U.S. job postings from January 1-December 31, 2025. https://www.onetonline.org/link/demand/15-2051.01. Accessed August 9, 2026.
[13] U.S. Department of Labor, O*NET OnLine, “Business Intelligence Analysts (15-2051.01),” updated 2026. https://www.onetonline.org/link/summary/15-2051.01. Accessed August 9, 2026.
[14] U.S. Department of Labor, O*NET OnLine, “Business Intelligence Analysts: Education and Job Zone,” updated 2026. https://www.onetonline.org/link/summary/15-2051.01. Accessed August 9, 2026.
[15] U.S. Bureau of Labor Statistics, Occupational Outlook Handbook, “Computer Systems Analysts,” last modified August 28, 2025. https://www.bls.gov/ooh/computer-and-information-technology/computer-systems-analysts.htm. Accessed August 9, 2026.
[16] National Center for Education Statistics, Classification of Instructional Programs, “Business Analytics.” https://nces.ed.gov/ipeds/cipcode/. Accessed August 9, 2026.
[17] Arizona State University, “Business Data Analytics, BS,” 2026-2027 program description. https://degrees.asu.edu/bachelors/major/ASU00/BABDABS/business-data-analytics. Accessed August 9, 2026.
[18] Georgia Institute of Technology, “Master of Science in Analytics Curriculum.” https://www.analytics.gatech.edu/curriculum/msa-curriculum. Accessed August 9, 2026.
[19] Western Governors University, “Bachelor of Science in Data Analytics.” https://www.wgu.edu/online-it-degrees/data-analytics-bachelors-program.html. Accessed August 9, 2026.
[20] Google, “Google Data Analytics Certificate.” https://grow.google/certificates/data-analytics/. Accessed August 9, 2026.
[21] Microsoft Learn, “Study guide for Exam PL-300: Microsoft Power BI Data Analyst,” last updated March 20, 2026; skills measured as of April 20, 2026. https://learn.microsoft.com/en-us/credentials/certifications/resources/study-guides/pl-300. Accessed August 9, 2026.
[22] Salesforce Trailhead, “Tableau Data Analyst Certification Prep Guide.” https://trailhead.salesforce.com/content/learn/modules/cert-prep-tableau-data-analyst/get-started-with-tableau-data-analyst-certification-prep. Accessed August 9, 2026.
[23] Databricks, “Databricks Certified Data Analyst Associate Exam Guide,” October 2025. https://www.databricks.com/sites/default/files/2025-10/databricks-certified-data-analyst-associate-oct-2025.pdf. Accessed August 9, 2026.
[24] Snowflake, “SnowPro Advanced: Data Analyst.” https://learn.snowflake.com/en/certifications/snowpro-advanced-dataanalyst/. Accessed August 9, 2026.
[25] International Institute of Business Analysis (IIBA), “CBDA Competencies” and “Certification in Business Data Analytics.” https://www.iiba.org/business-analysis-certifications/business-data-analytics-certification/cbda-competencies/. Accessed August 9, 2026.
[26] Microsoft Learn, “Study guide for Exam PL-300: Microsoft Power BI Data Analyst,” last updated March 20, 2026; skills measured as of April 20, 2026. https://learn.microsoft.com/en-us/credentials/certifications/resources/study-guides/pl-300. Accessed August 9, 2026.
[27] U.S. Bureau of Labor Statistics, Occupational Outlook Handbook pages for Market Research Analysts, Management Analysts, Computer Systems Analysts, Operations Research Analysts, and Data Scientists; May 2024 median pay and 2024-2034 projections. https://www.bls.gov/ooh/. Accessed August 9, 2026.
[28] Alteryx, “2025 State of the Data Analyst,” 2025. https://www.alteryx.com/resources/report/2025-state-of-the-data-analyst. See also Alteryx newsroom summary: https://www.alteryx.com/about-us/newsroom/press-release/new-research-reveals-that-ai-brings-productivity-gains-but-reliance-on-spreadsheets-puts-data-quality-at-risk. Accessed August 9, 2026.
[29] IBM Think, “Modern data teams: Key roles, structures and challenges,” December 15, 2025. https://www.ibm.com/think/topics/how-to-structure-a-modern-data-team. Accessed August 9, 2026.
[30] U.S. Department of Labor, O*NET OnLine, “Business Intelligence Analysts: Skills, Work Activities, and Work Styles,” updated 2026. https://www.onetonline.org/link/summary/15-2051.01. Accessed August 9, 2026.
Comments
Nothing yet. Say the first thing.
Sign in to join the conversation.