
[Indexes are updated weekly, make certain to check the date above to know you are looking at current actionable charts]
I hope you have been taking advantage of one of the greatest bulls in history. I for one am grateful that I have participated. Think about the backdrop for a moment (It gets lost on me if I don’t think about it once in a while). We have a presidency that might be he most pro business in history, along with his BBB and tax cuts. This all at a time when mutli trillion dollar themes are all starting out at once (AI,Robotics,Space,Defence2.0,Genomics). Then even within those themes you have huge game changing sub themes (AI data centers in Space…AI data centers in the ocean as just two examples) You’re not bullish enough.
7/4 update-
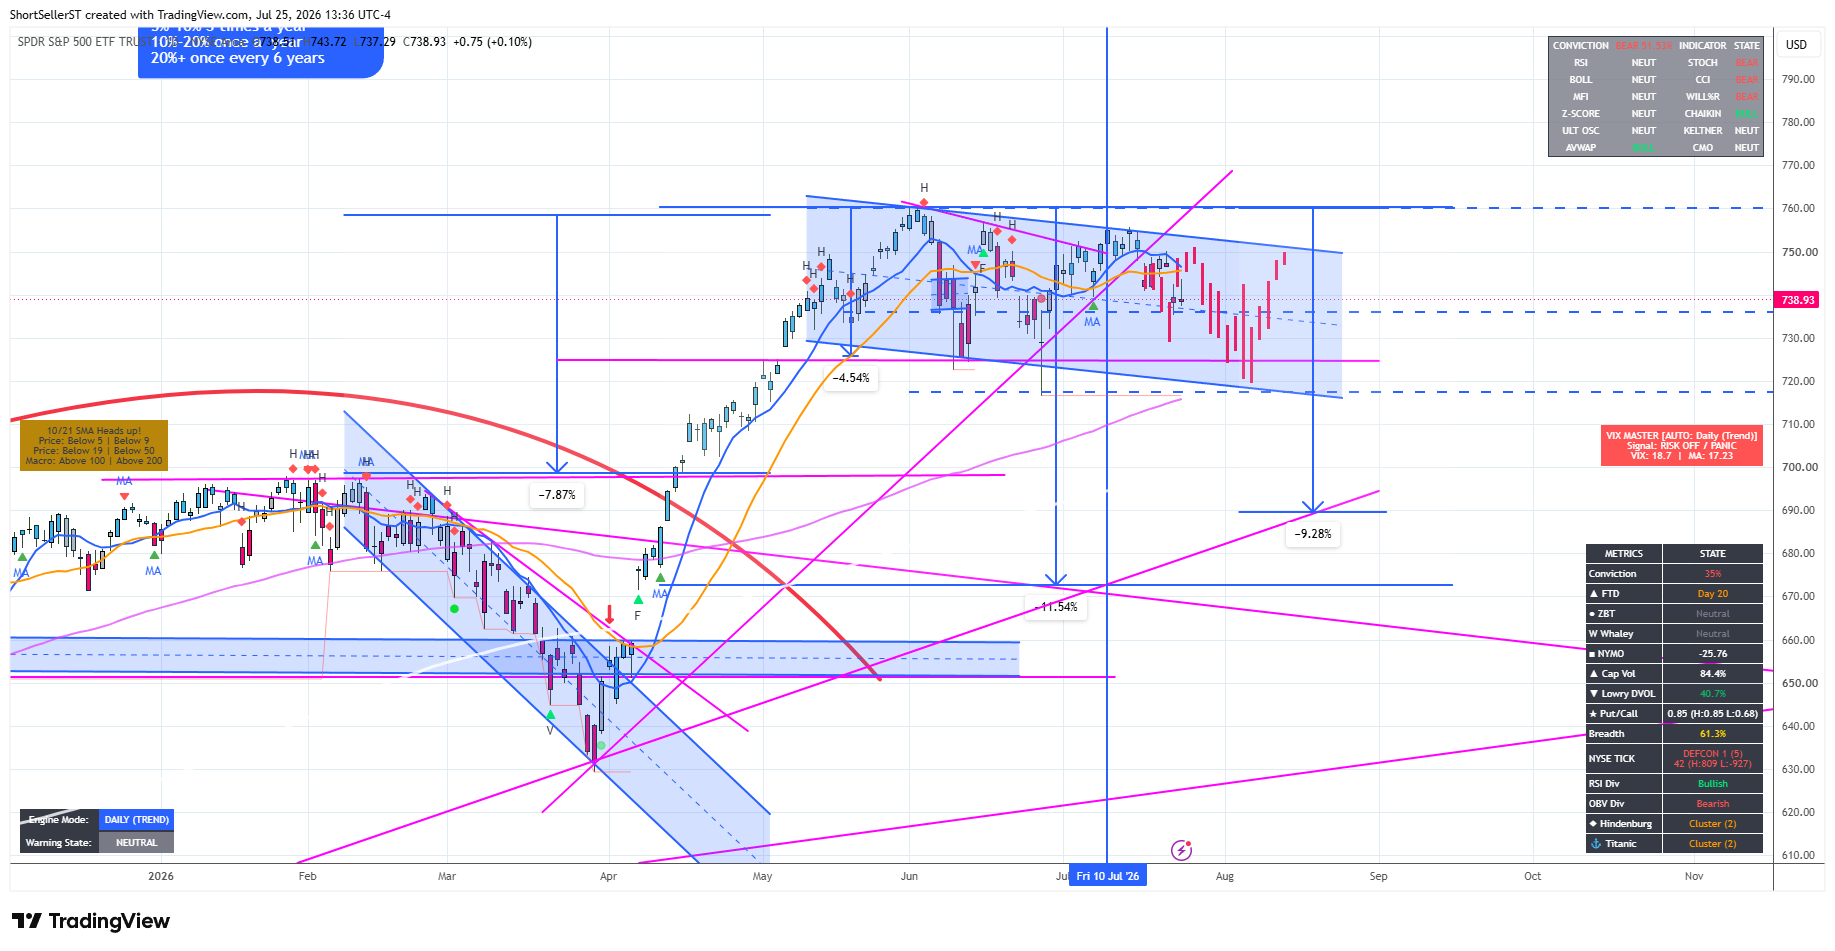
SPY - (Daily chart) Still a longer term bullish posture, but two levels I am watching below - (not my base case) the recent low of the wedge (5ish% from ATH’s), and if lost on a weekly close the UTL below could be in play (11%ish from ATH’s). We have now reclaimed the 9/19/50 MA’s with the 10/21 MA cross still on a sell signal, but the 10/21 looks like it could uncross any day. Next challenge for bulls is that we’re still under the DTL, if even by a hair. Currently have a lot of cash until i’m comfortable that S.Korea, KOSPI and SMH (Semi’s) have bottomed. I am starting to find values in other areas of interest though (ASTS, SMTI and others (see my portfolio updates latter).
Friday might have been the washout flush in the AI trade. We likely get the bounce next week, as many broken charts try to reclaim lost TL’s. This is when we will learn if it’s just a dead cat bounce, or a sustainable bottom. I don’t have enough conviction either way as it’s still a crowded trade. I am sticking to my rule (even if technicals dont support it) that when a large TAM leader is down 20-35% it’s often an opportunity in hindsight…that means i’m nibbling
7/12 Update - We broke out of flag and 760 next and likely much higher…nothing bearish here
7/18 Update- Got last weeks roadmap wrong, and now seeing something like this playing out. It isn’t just losing that UTL, or the ugly gap down/close down candle either. There is something amiss when the overleveraged Seohak boys start blowing up, and the contagion spills over into our AI/SEMI (recall I LOVE SMH leadership) trade. When you have these stocks now down 25%- 60%, and they can’t even get up off the floor, that feels not like a bottom to me. When I saw AAOI panic drop to like 90 in the pre-market I surely thought maybe we’re bottoming, but that lackluster close and all day fade across the sector suggests more pain cometh.
I have been nibbling only, we need them to base, or to see a definitive bottom…patience.
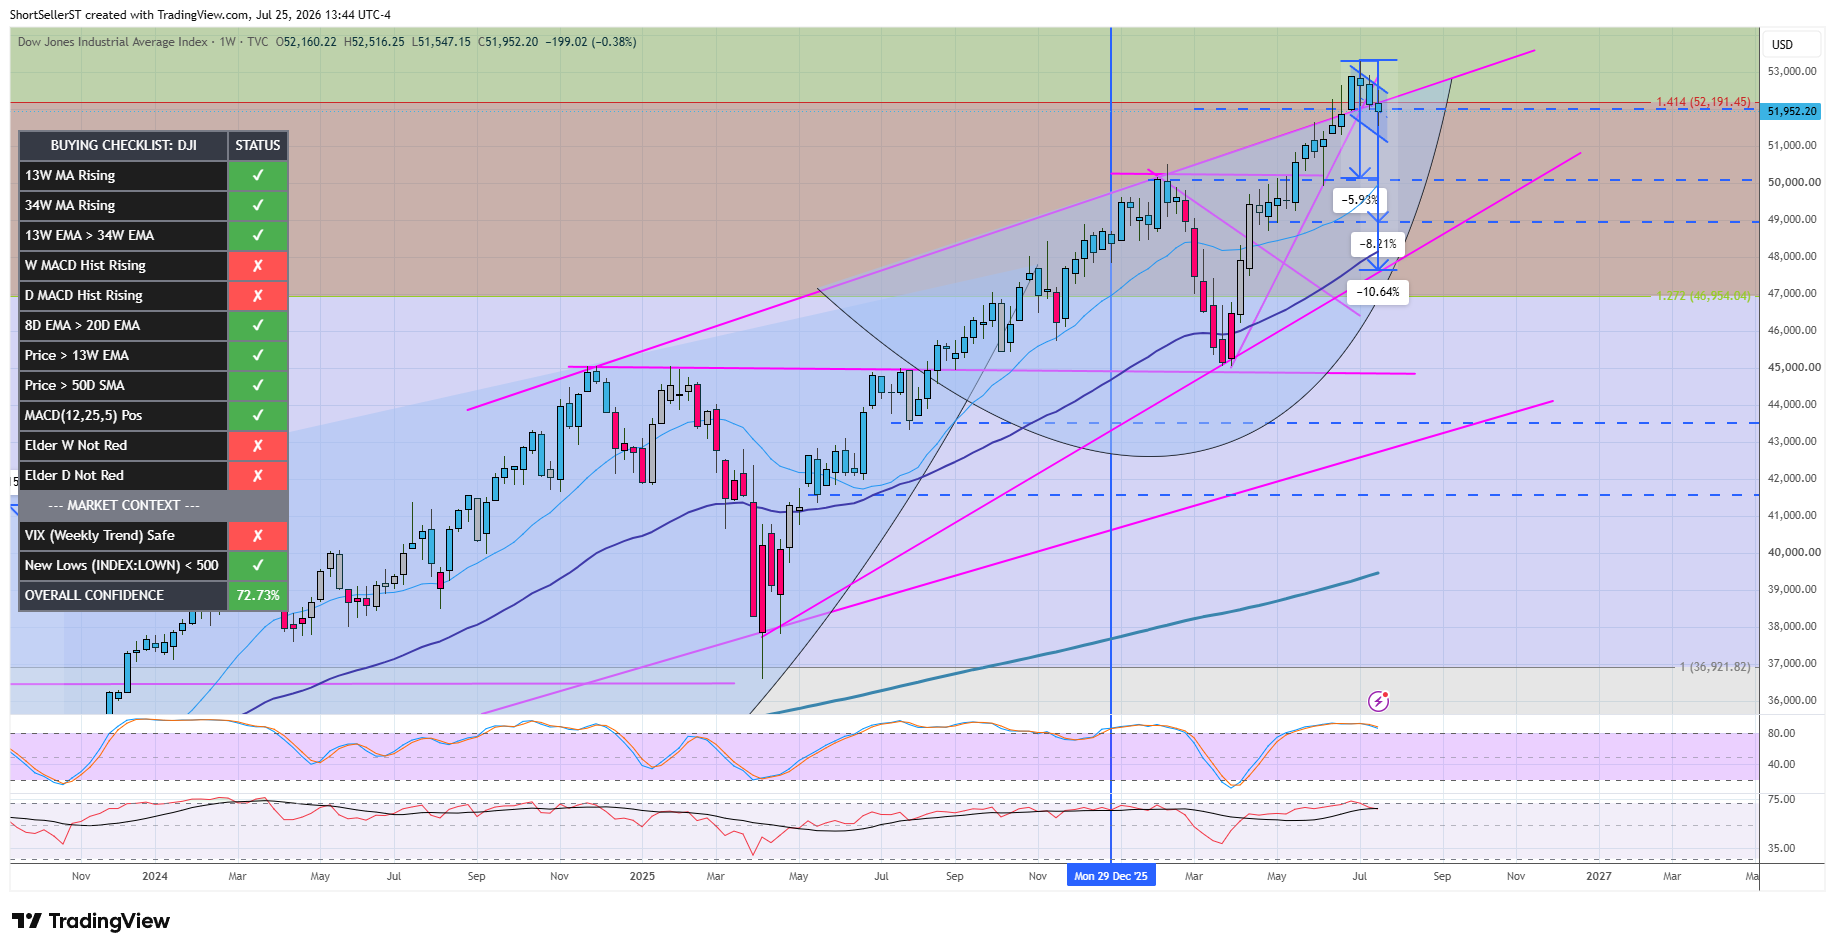
7/25 Update - The indexes big lie - looking at this you would think rip roaring bull market, but we all know the damage under the hood continues to be horrific. I haven’t removed my red bars and the market is actually following it thus far, - still think we have more work below. This view is only negated on a close up and out of this channel
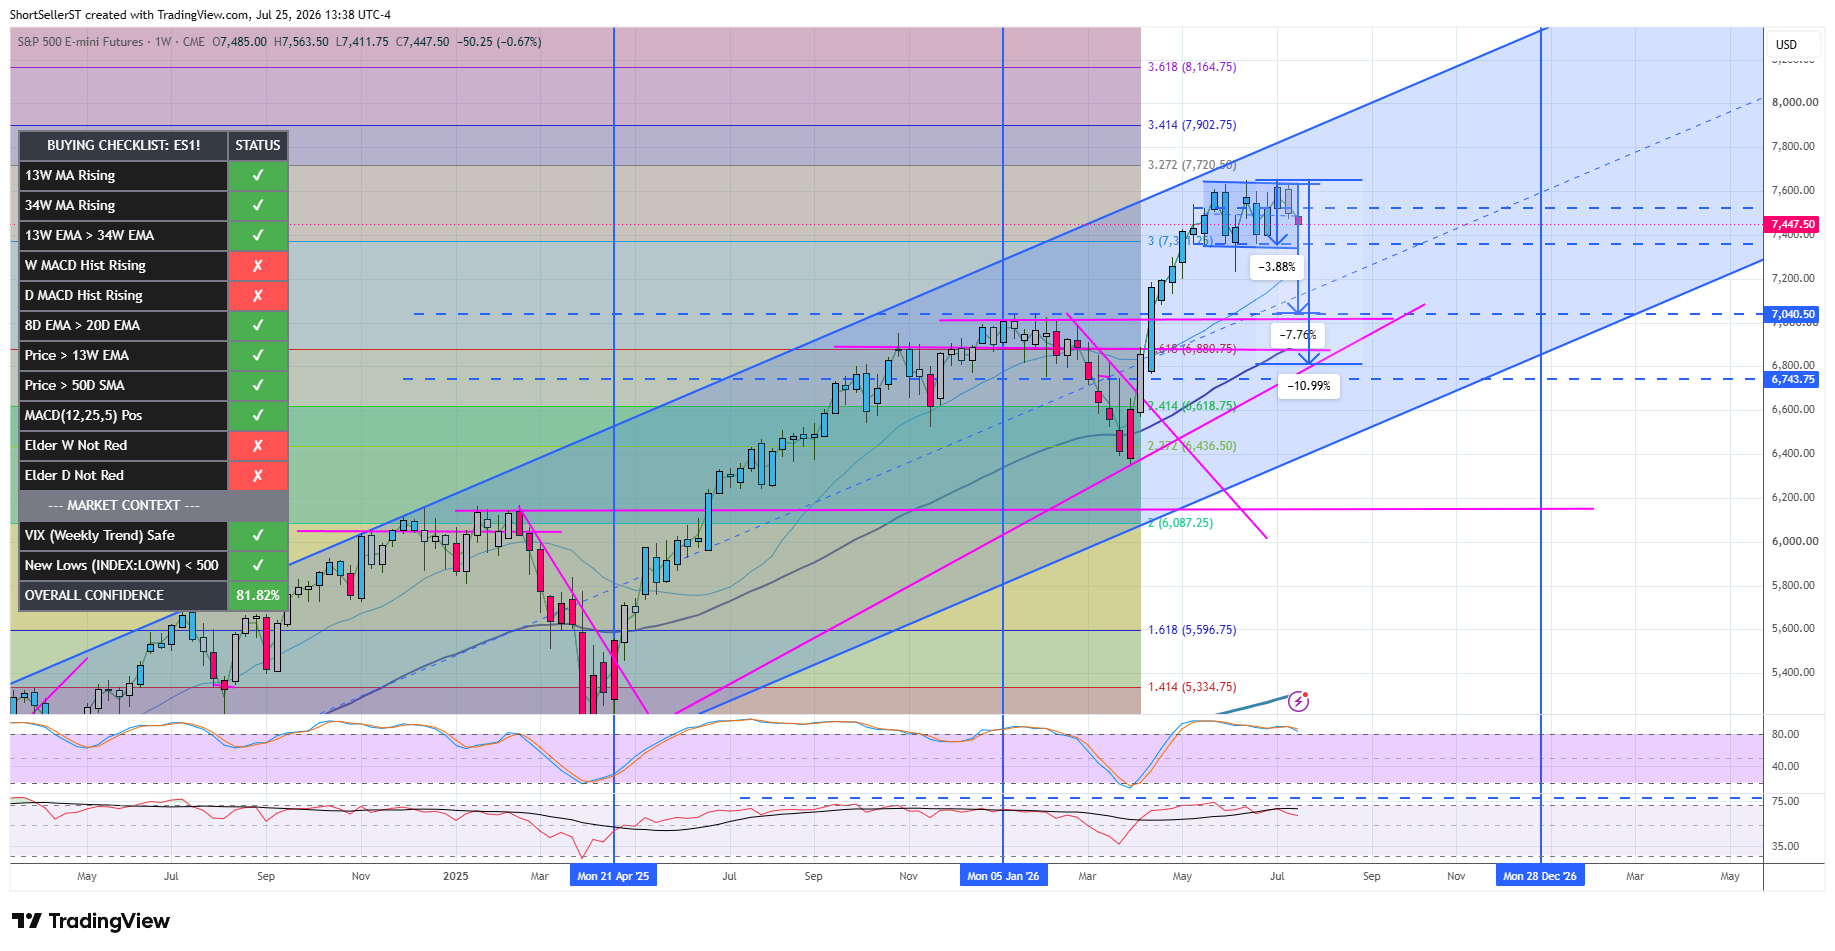
ES - Markets can correct via time, not just price, and when you see a flag this is what you’re seeing. Those two measurements on the chart (8ish% and 11ish% from ATH’s) are NOT predications by me, they are simply showing two levels where I would expect us to find support. The first at the bottom of the flag (here now), and should we lose that, the earlier ATH breakout below. Again, nothing overly bearish longer term here, still currently bullish.
7/4 update - nothing new…still a boolish looking high tight flag…8 weeks of nothing burgers
7/12 update - flag breakout (same as SPY)….the 3 percentage drawdowns I have shown on chart are only there to show how far down to various supports - they are not meant to imply we test any of them…currently boolish
7/18 update - chart still not horrible, but now currently leaning toward a test of bottom of flag, with lower targets in play ONLY if violated on a closing basis - note things can be dangerous when RSI < MA
7/25 Update - no change…see 7/18 update
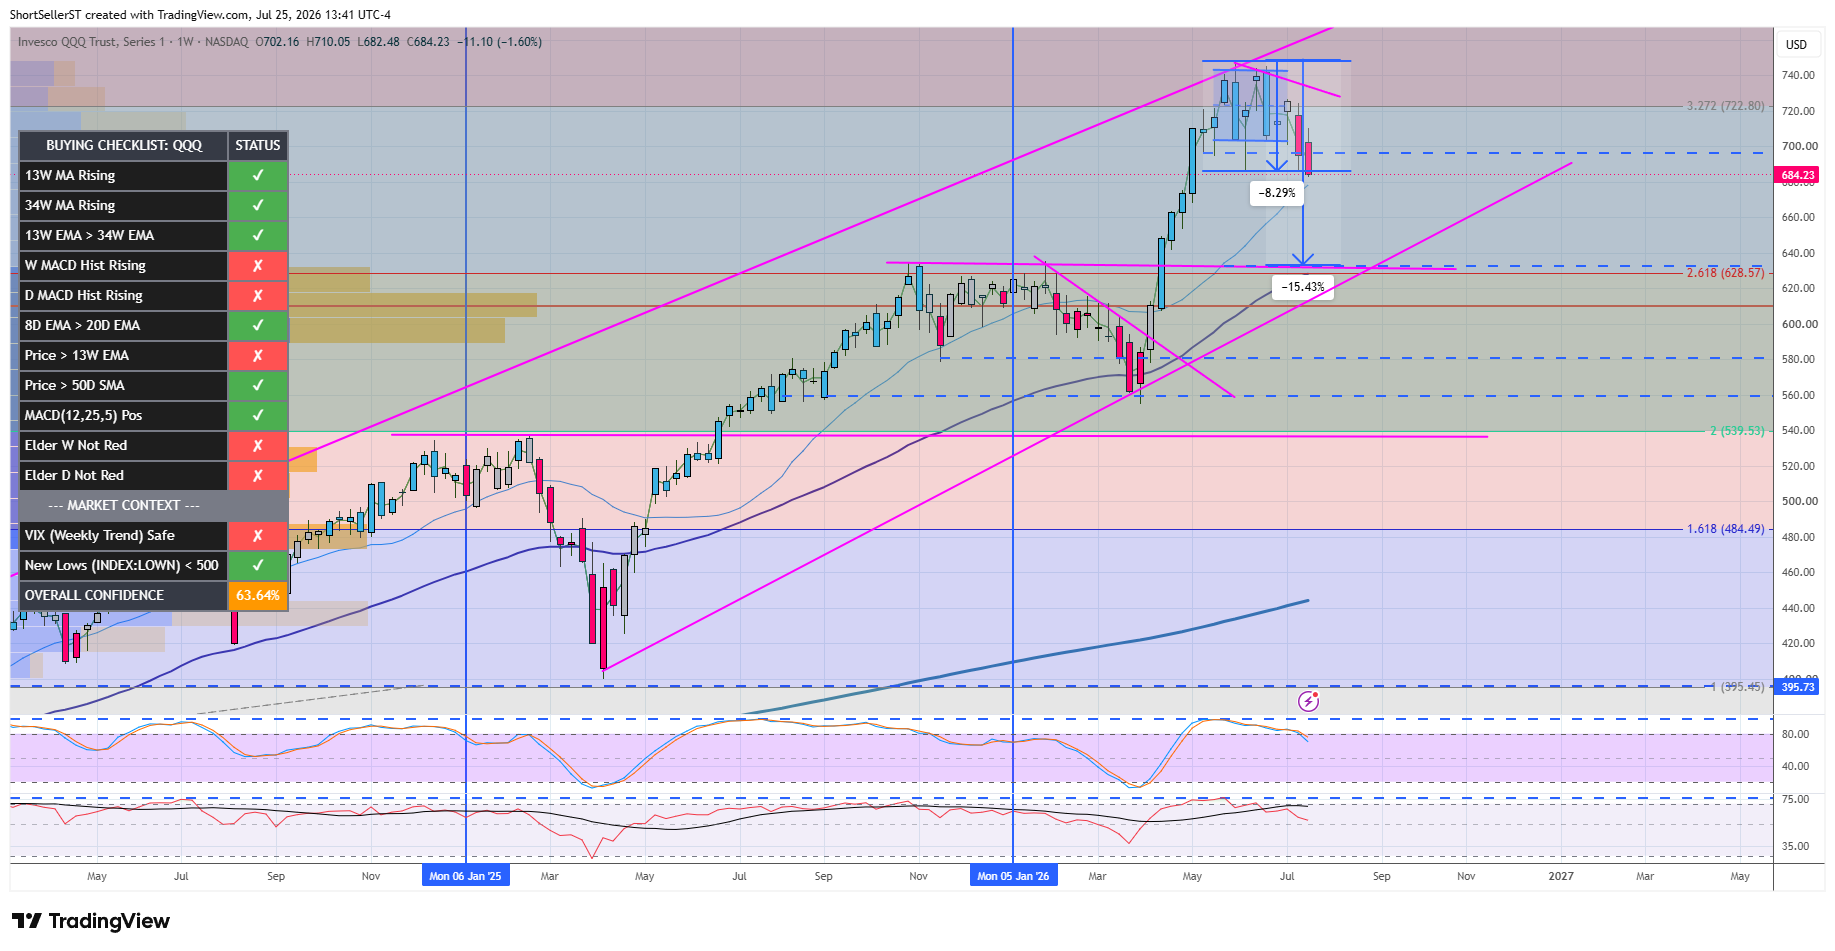
QQQ Same thoughts as SPY…we are currently flagging, and nothing bearish here…see how the flag resolves before we get overly concerned, more often than not they resolve bullish. Should we lose the flag the door would be open to a possible 15%ish drawdown from ATH’s (not my base case
7/12 Update, tech not as boolish as the other indexes as breadth broadens out. Still boolish, just not as much as other sectors right now
7/18 Update - bottom of channel must hold (not my base case), support at the rising 55MA earlier ATH confluence below…There’s a good chance we see that UTL unless MAGS pick up the slack, and semi’s base.
7/25 Update see 7/18 comments…nothing looks good on this chart
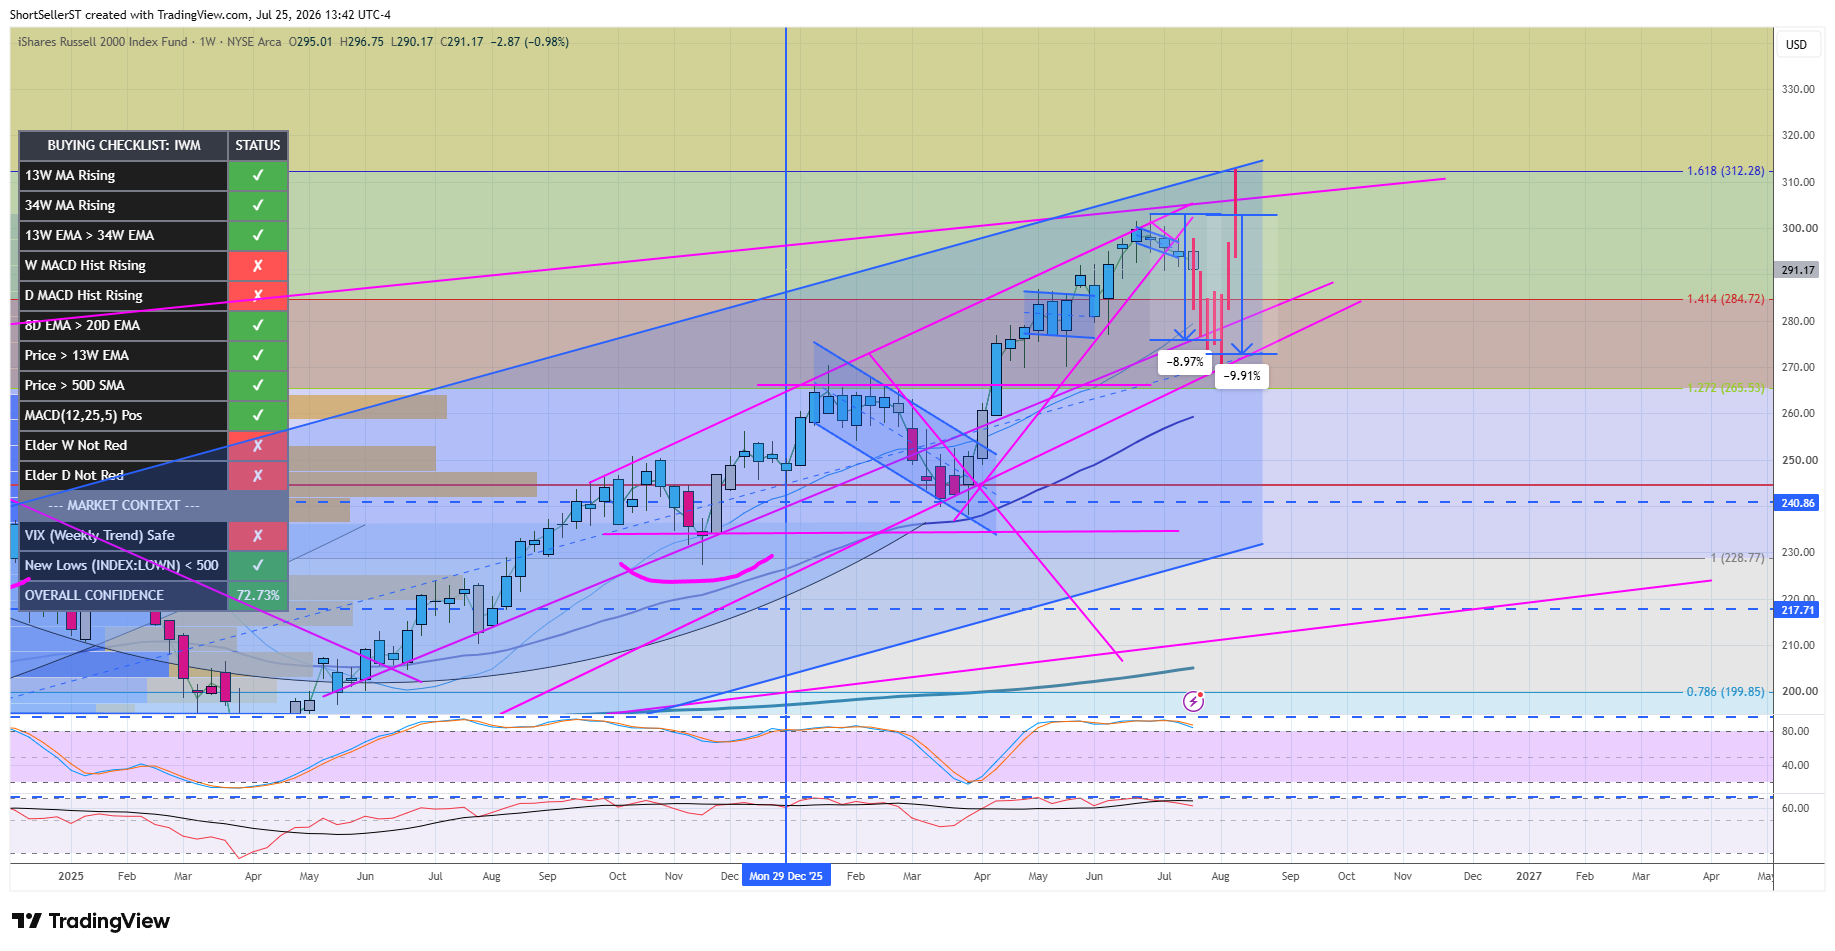
IWM Out of flag…and one of the leading indexes continues to be the place to be. indecision candle (make certain to check out our new TradingView candle teaching tool!) where perhaps we are starting another flag to work off overbought conditions.
7/12 update - sill feels flaggy to me and boolish overall
7/18 Update - Currently flagging, but given the underlying back drop, I would be suprised if we didnt lose this flag - there is an expression on Wall st…’from failed moves come fast moves’ - So maybe something like this…
7/25 Update - playing out so far
DJI OK, this one might be a chart crime but if it were a C&H breakout, the measured move suggests we get another 27% now (doesnt mean it happens in July…just that it happens). If it is a chart crime, still an ATH breakout…nothing bearish here
7/12 update still looks like 66K is the objective before this bull is over
7/18 Update - 66K still valid, but I think lower before higher, unless where able to hold this dashed line and base here (not my base case).
7/25 Update holding up better than other indexes fwiw
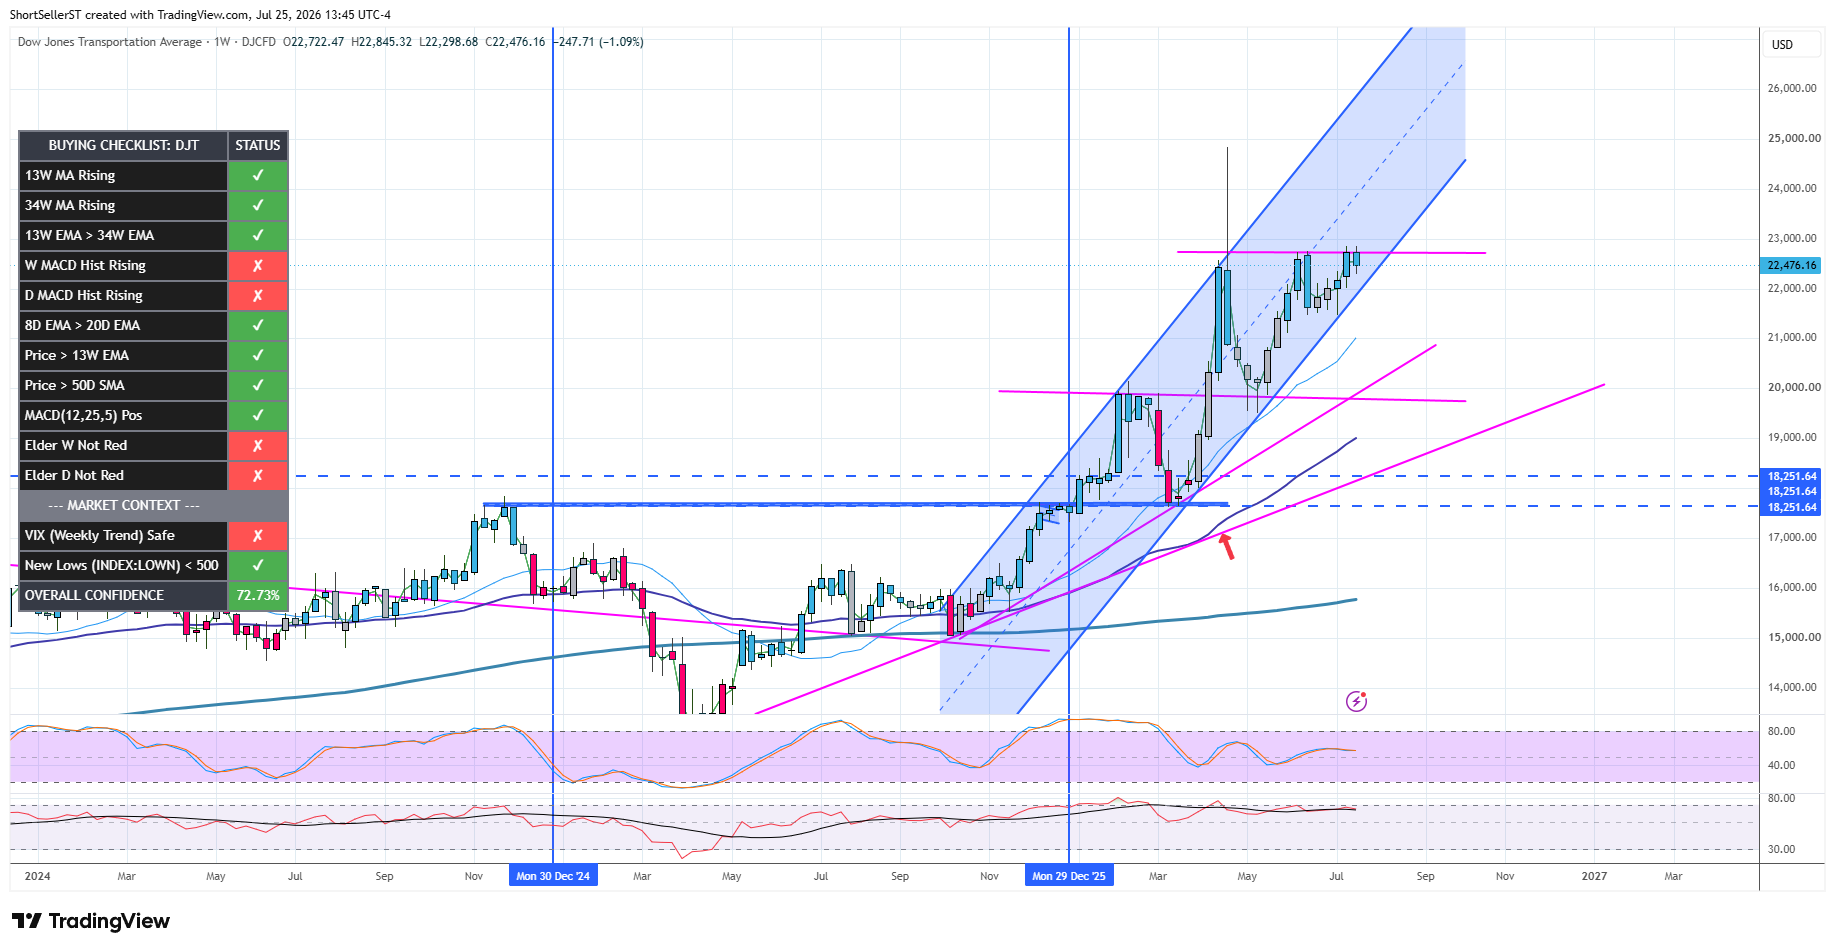
DJT (Transports not Trump) …New ATH (on a weekly close) for all you Dow theory people, and now a bearish engulfing candle. That’s not a bearish chart though - expectation currently is just a normal pullback to it’s current channel bottom. Only if lost on a weekly close would I expect the UTL below to come into play.
7/4 update - kinda C&H looking
7/12 update - still building out the handle
7/18 Update - On the cusp of a breakout, and likely where you want to have money working
7/25 Boolish setup still
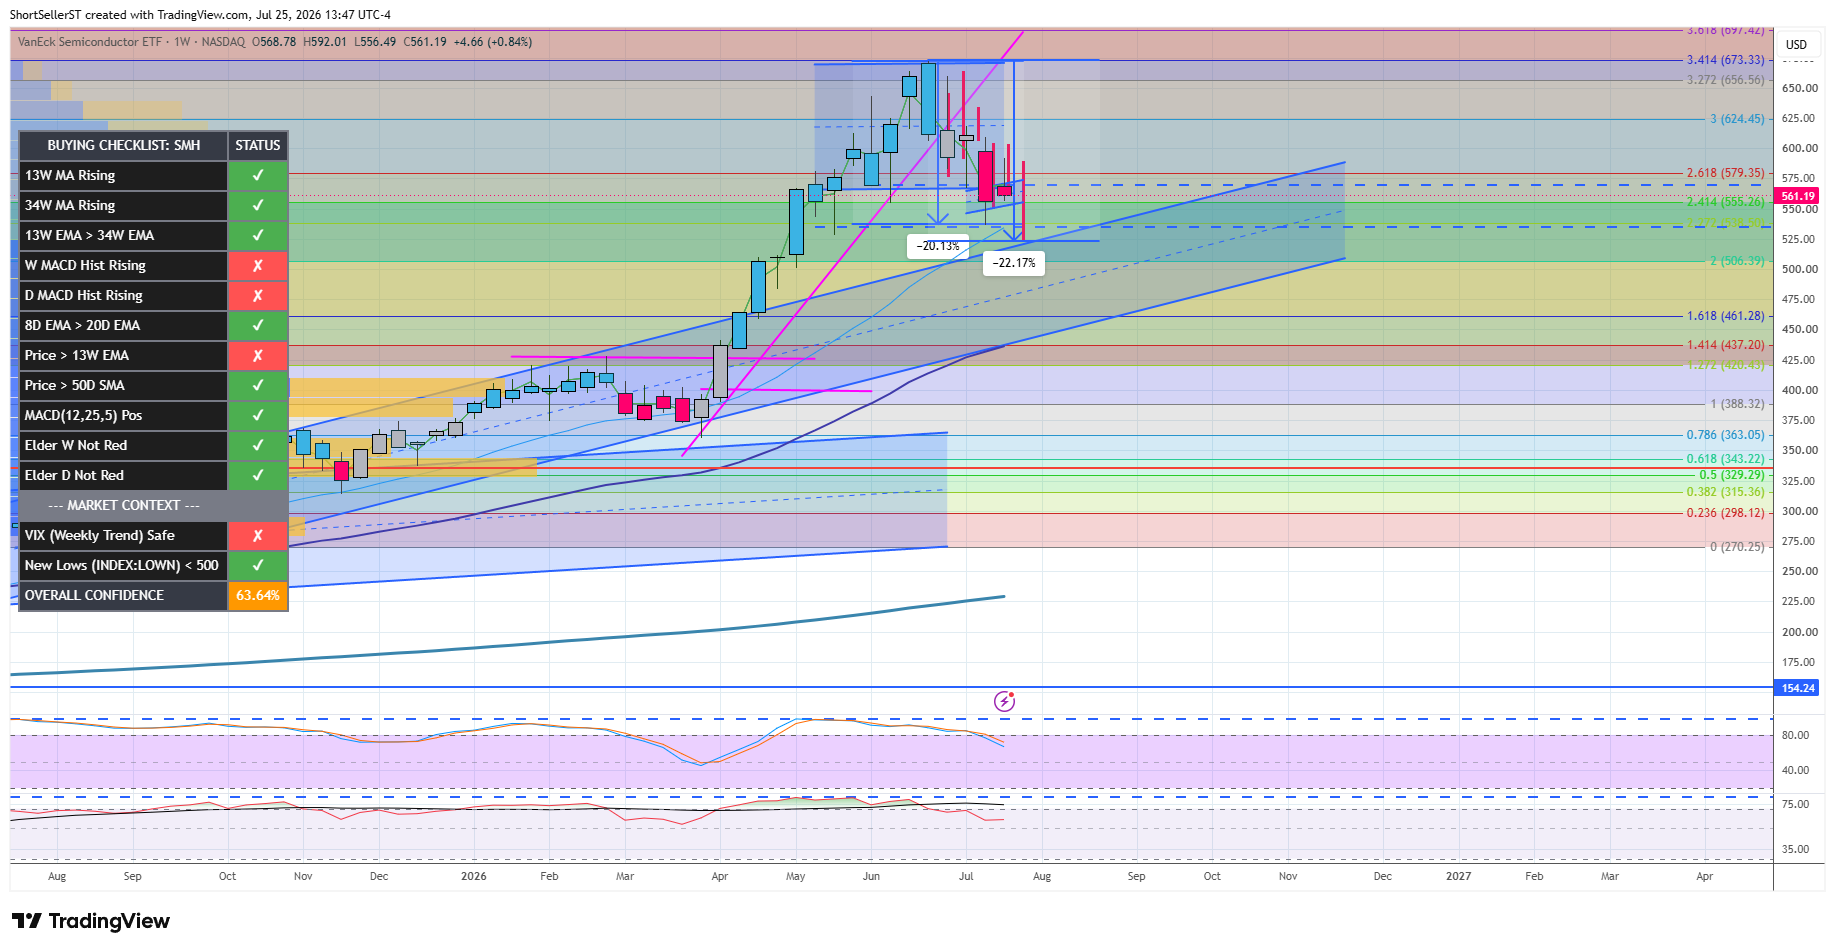
SMH ‘Elvis has left the building ’ // Updated only because Semi’s are red hot - they will pull back at some point…If you had told me a few days ago that we would close the week above my UTL/bullseye I would have offered to eat my shorts on air if it did it….just remarkable. You know what I say though….When it leaves it’s channel = allows for a parabolic move - another ShortSellerism //Update just to add, it’s always possible I draw a trendline or channel poorly but soooo many want to short the overheated semi’s ….maybe they aint gonna let em in?
Update ….13% drawdown was apparently a gift, and the parabolic move in the semi’s continues….party on Garth. // Update…still nothing bearish here….at some point there will be hell to pay but for now Garth still partying. The only crack in he armor I can see is that the photonic stocks have started to correct, and they have been among the best SEMI leaders…something to watch //Update - Photonic stocks were indeed a clue, and it (currently) feels like we will have more work below before all is said in done. This weeks candle was a bearish engulfing, and suggestive of lower prices near term. I put up those red bars to reflect what we might see over next few weeks. Just a retest of the earlier channel we left would be a HEALTHY 20ish% drawdown.
7/4 update - playing out how we have been suggesting. Doesnt mean that we have to get a 20% drawdown, but it does mean that we might be vulnerable to lower prices still. dashed line is next objective for bears. For bulls, you want to at least close over the high of the last candle body top.
7/12 update - sticking with my 7/4 comment (We posted this scenario at the beginning of July….playing out to the T….don’t think much more down, but if back in the channel then bottom of channel could be in play (not my base case at this moment)
7/25 Update Still think we have more work below, however as fugly as it continues to be, we closed the week with an inside candle…so maybe builds out a bear flaggy thing (?)
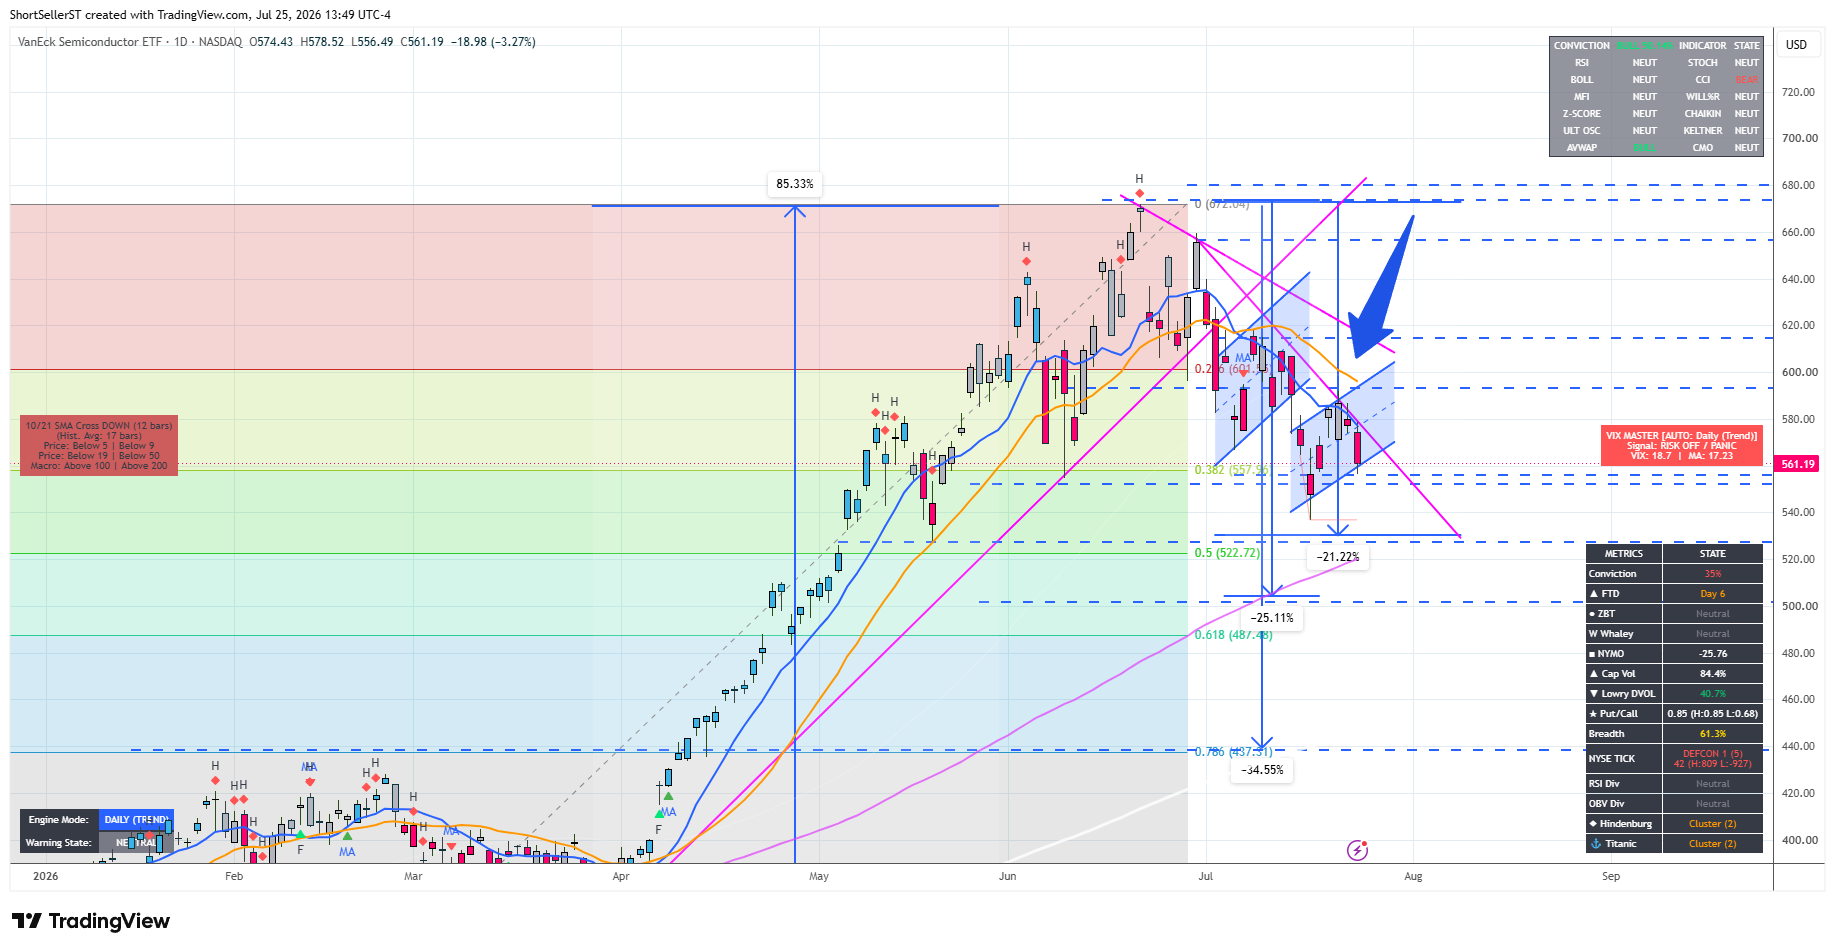
2nd SMH chart just to show a different perspective (same result though) - so far just a dead cat still (that doesn’t have to resolve bearish - could just chop sideways for a while)
7/18 Update - %’s shown on chart just to highlight what those moves represent from ATH’s …not predictive…take it level to level…So far we went down aprox. 20% from ATH’s
7/25 Update just another view of the daily so you can visualize that bear flag building out - note how we still have not been able to reclaim the DTL above -bulls 1st challenge
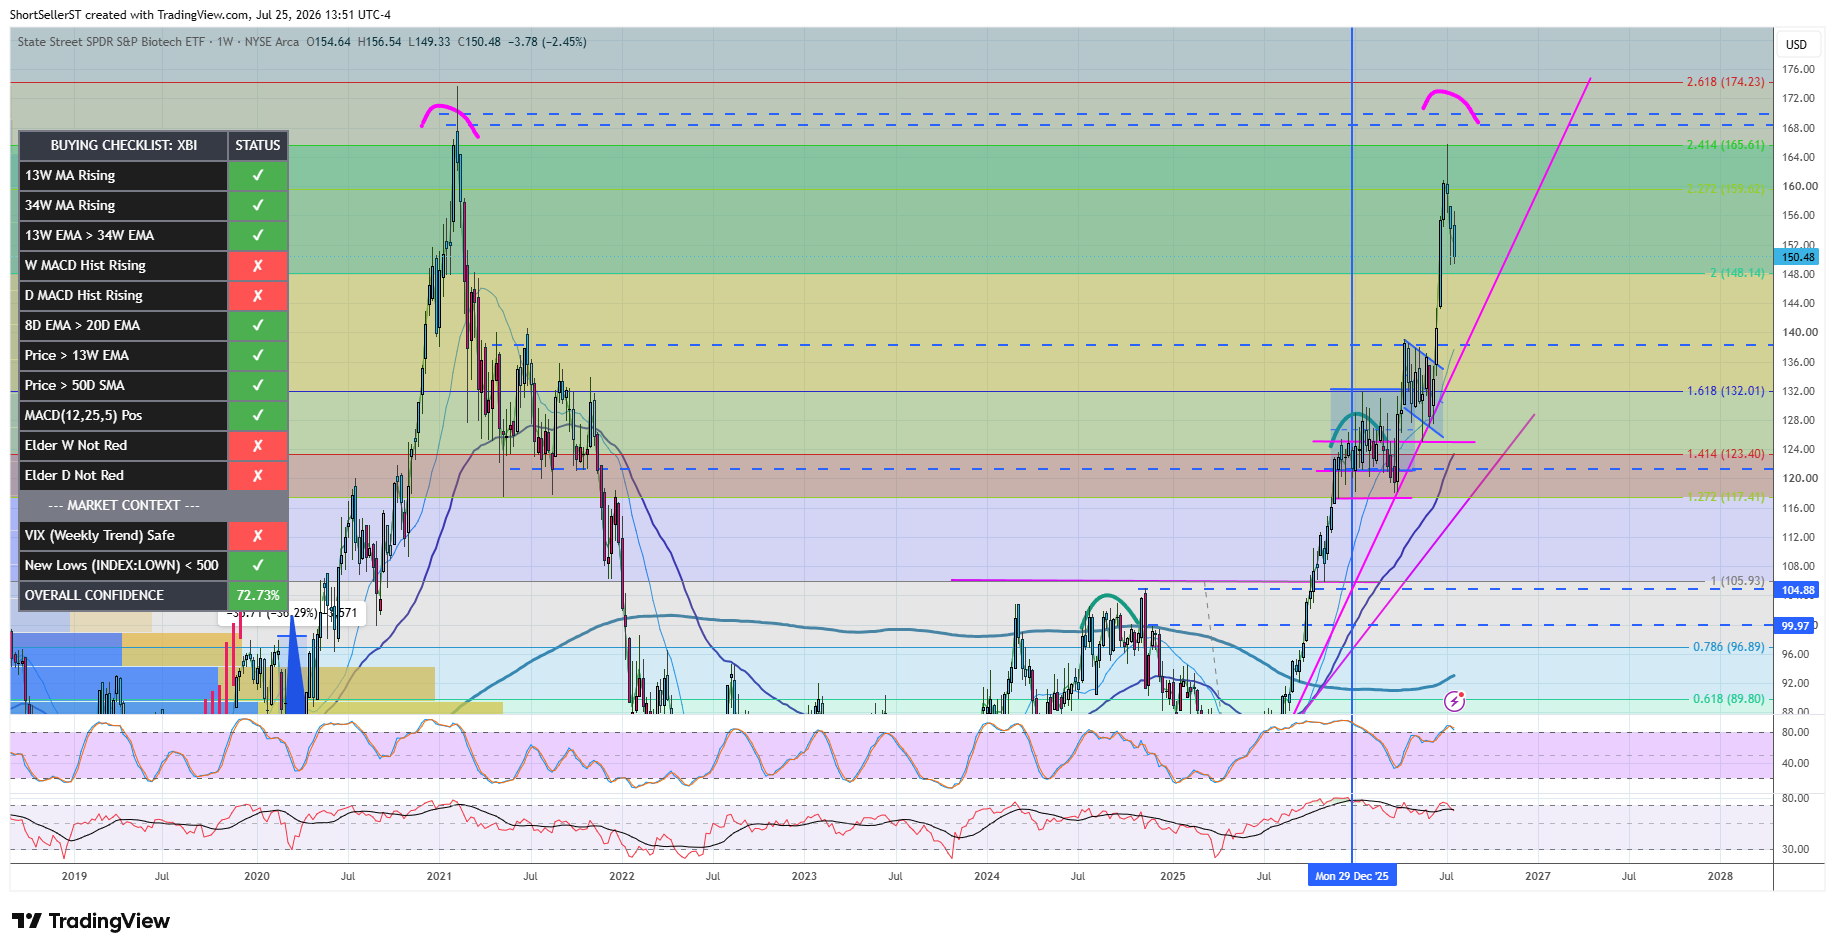
XBI Correcting via time, not price …proxies NKTR PALI CRVS in no particular order Constructive looking flag IMO //Update after that two month consolidation, we have broken out of the flag - suggestive that the bullish run can now continue. //Update - and continue it did! best performing sector at the moment
7/4 update still the place to be, but if/when we get up here we want to be aware of a possible double top…not a prediction - just something to watch out for
7/12 update - so far looks like a topping candle, and double top playing out at this time
7/18 Update - playing out as previously suggested, and looks like UTL below in play
7/25 Update - see 7/18 comment
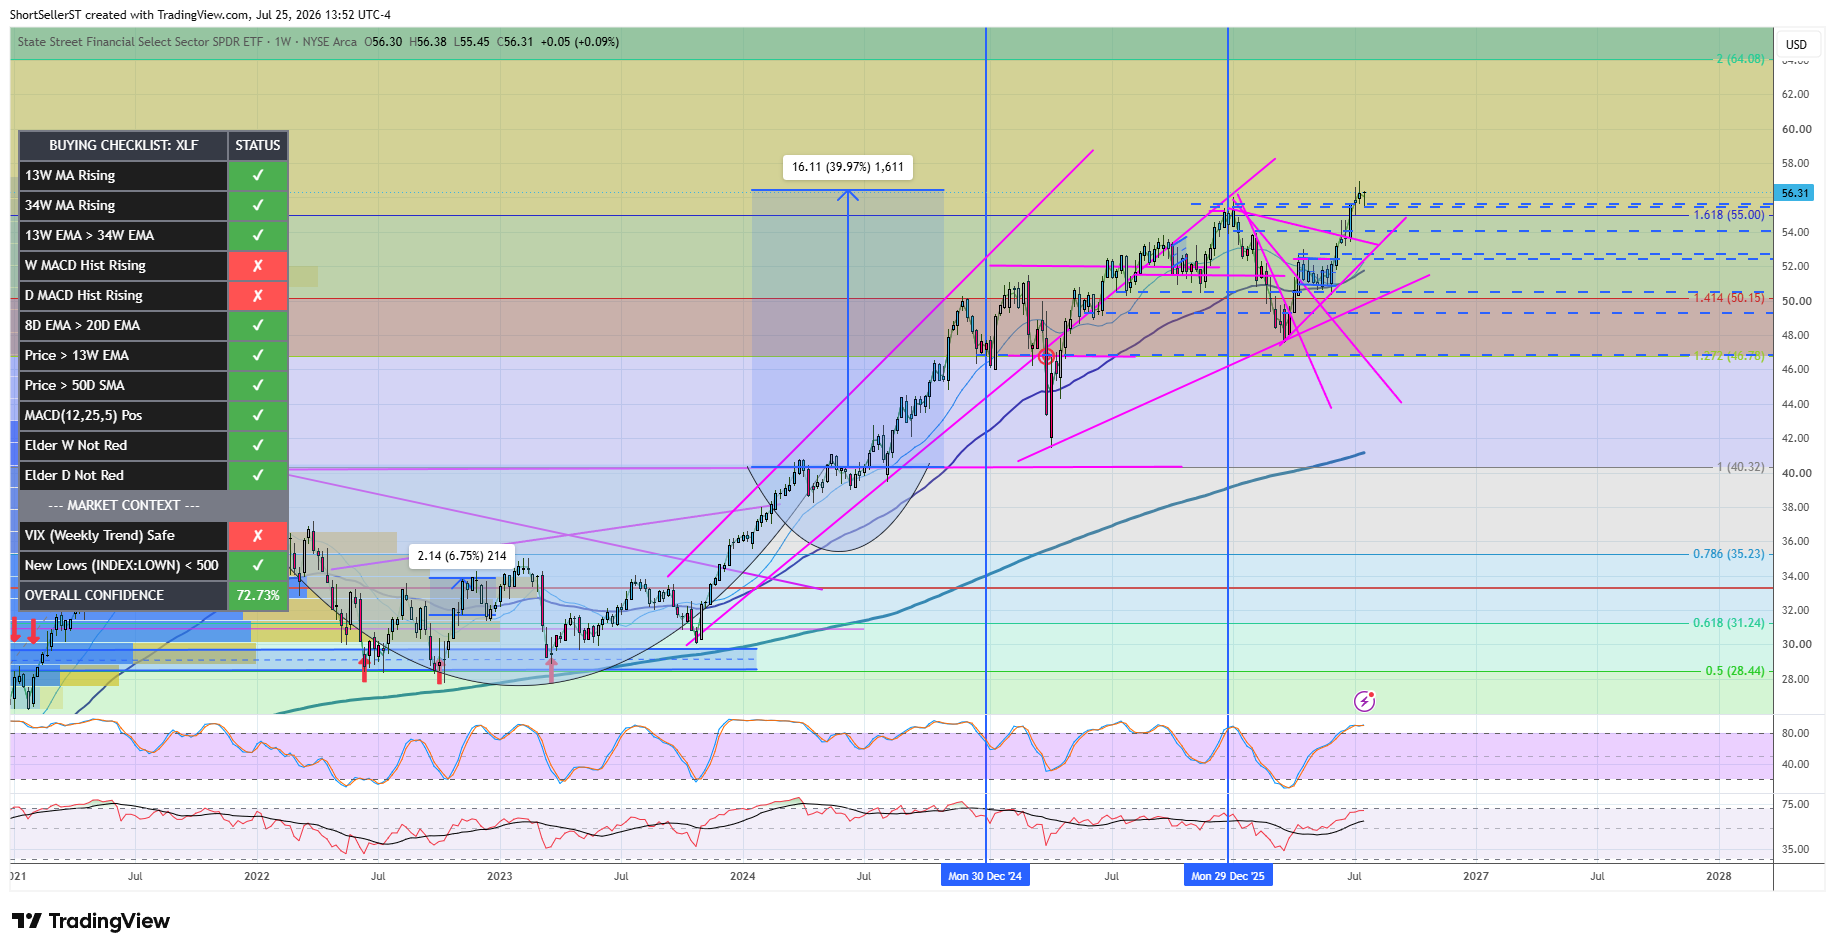
XLF A leading sector, and setup here as it challenges ATH’s
7/12 update - Possible short term double top, but would likely find buyers are the earlier breakout below, or UTL…still boolish overall
7/18 update - double top negated, and as long as over the earlier ATH still a place to be (though worst case for now IMO would be to simply visit he UTL below)
7/25 Update - consolidating at ATH’s
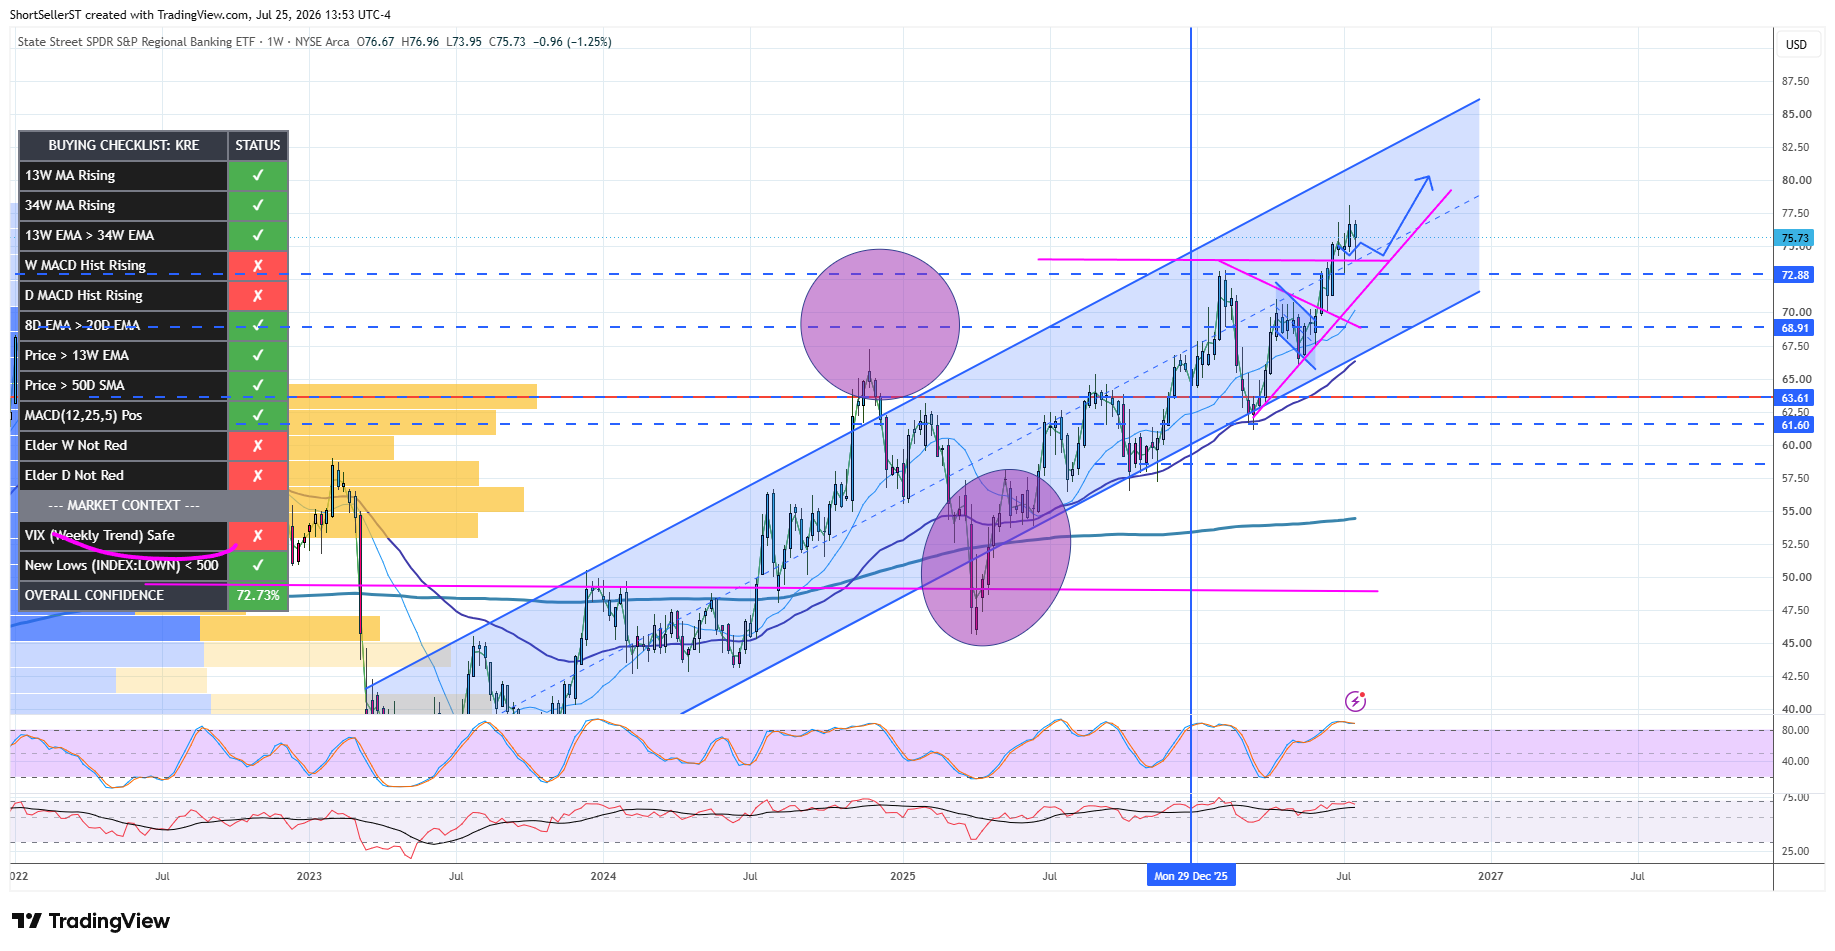
KRE flagging under DTL (boolish setup) //Update flag breakout but now have to confirm no double top forming //Update same thoughts as last week…still cautious re double top - nothing bearish as of now though. //Update double top negated, with new ATH’s…getting overbought but room to move higher still
7/4 update indecision candle …maybe something like this(?)
7/12 update..see 7/4 update
7/18 Update - see 7/4 update….playing out
7/25 Update ‘path’ continues to play out
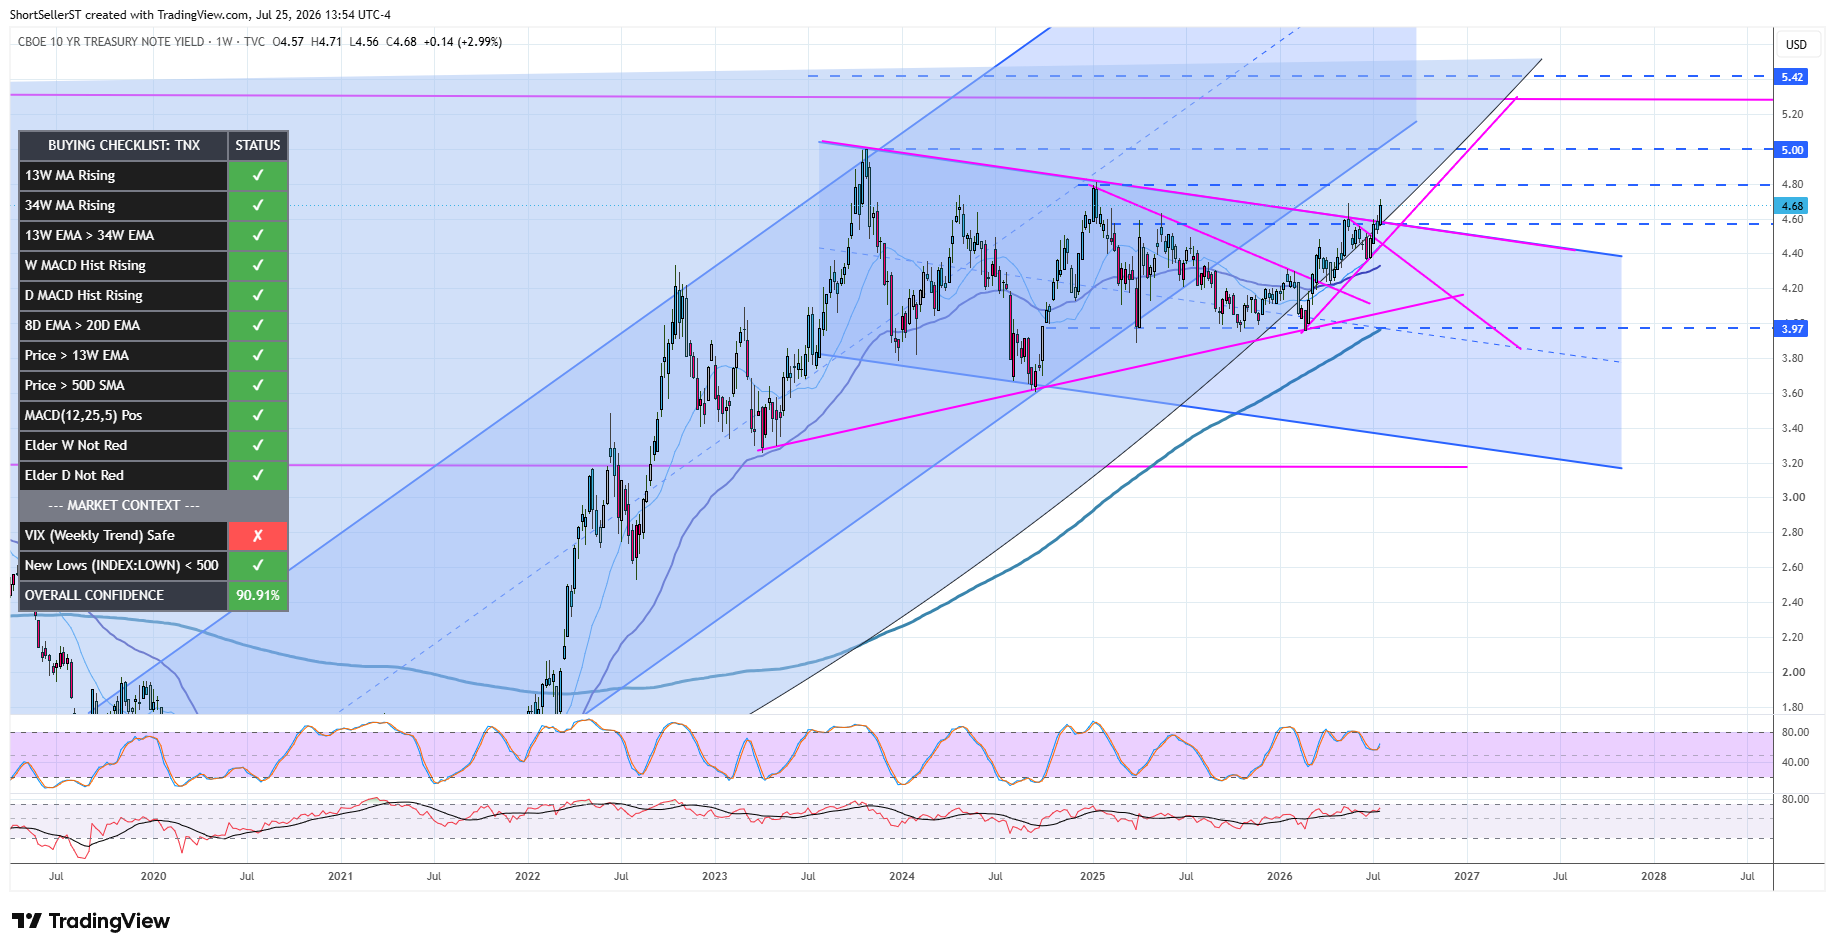
TNX 7/4 update One big C&H handle….zoomed in …and flagging - once out can make a run to top of channel (handle) //Updated saved at top of channel so far pheew //Updated trend is lower until DTL reclaimed, and even then you have that channel top
7/12 update - showing monthly just so you can visualize the C&H i’m seeing…. rates feel poised to break out IMO…
7/18 Update …see earlier comments - still my base case
7/25 C&H breakout (across the world rates are rising…troublesome scenario (?)
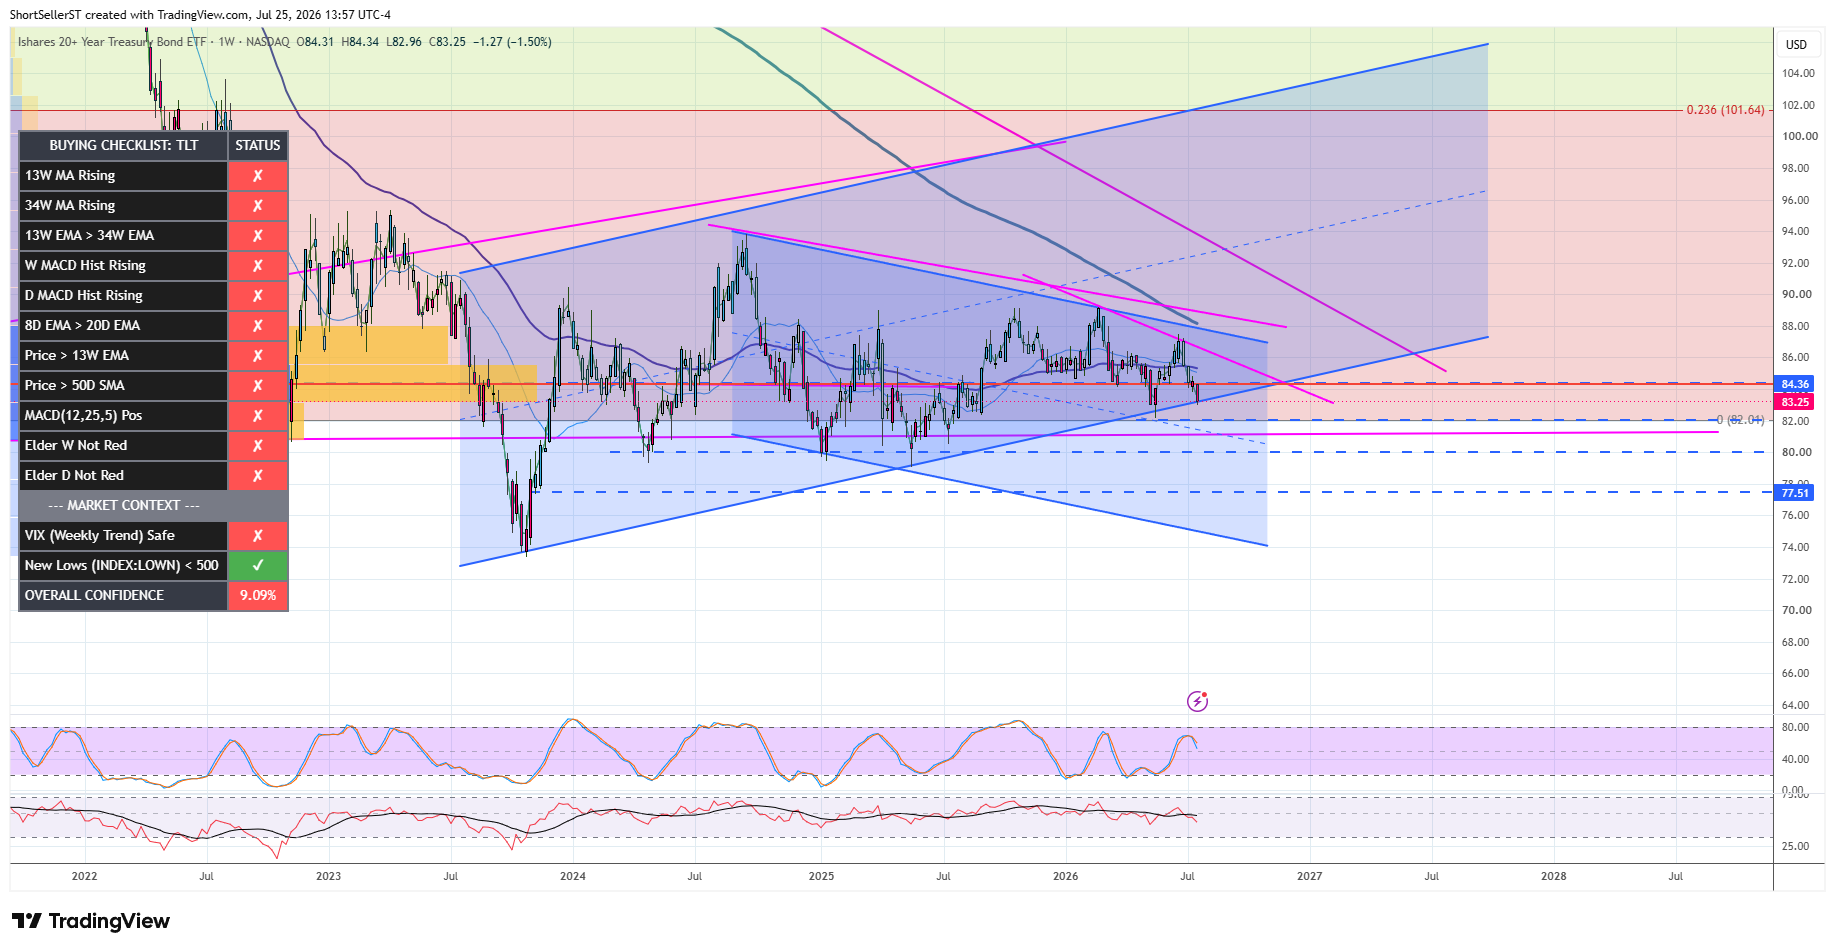
TLT room to go lower until >DTL above (but chop overall) // Update over DTL but still chop overall //Update ….upward bias short term, but still chop overall
7/4 update might have lost the UTL (too close for me to tell) but just chop overall regardless
7/12 update downward bias but chop overall
7/18 Update - chop overall still - but now bottom of my larger channel
7/25 Update -not a lot of touch points to my channel so I moved it around….not clear if it is valid yet
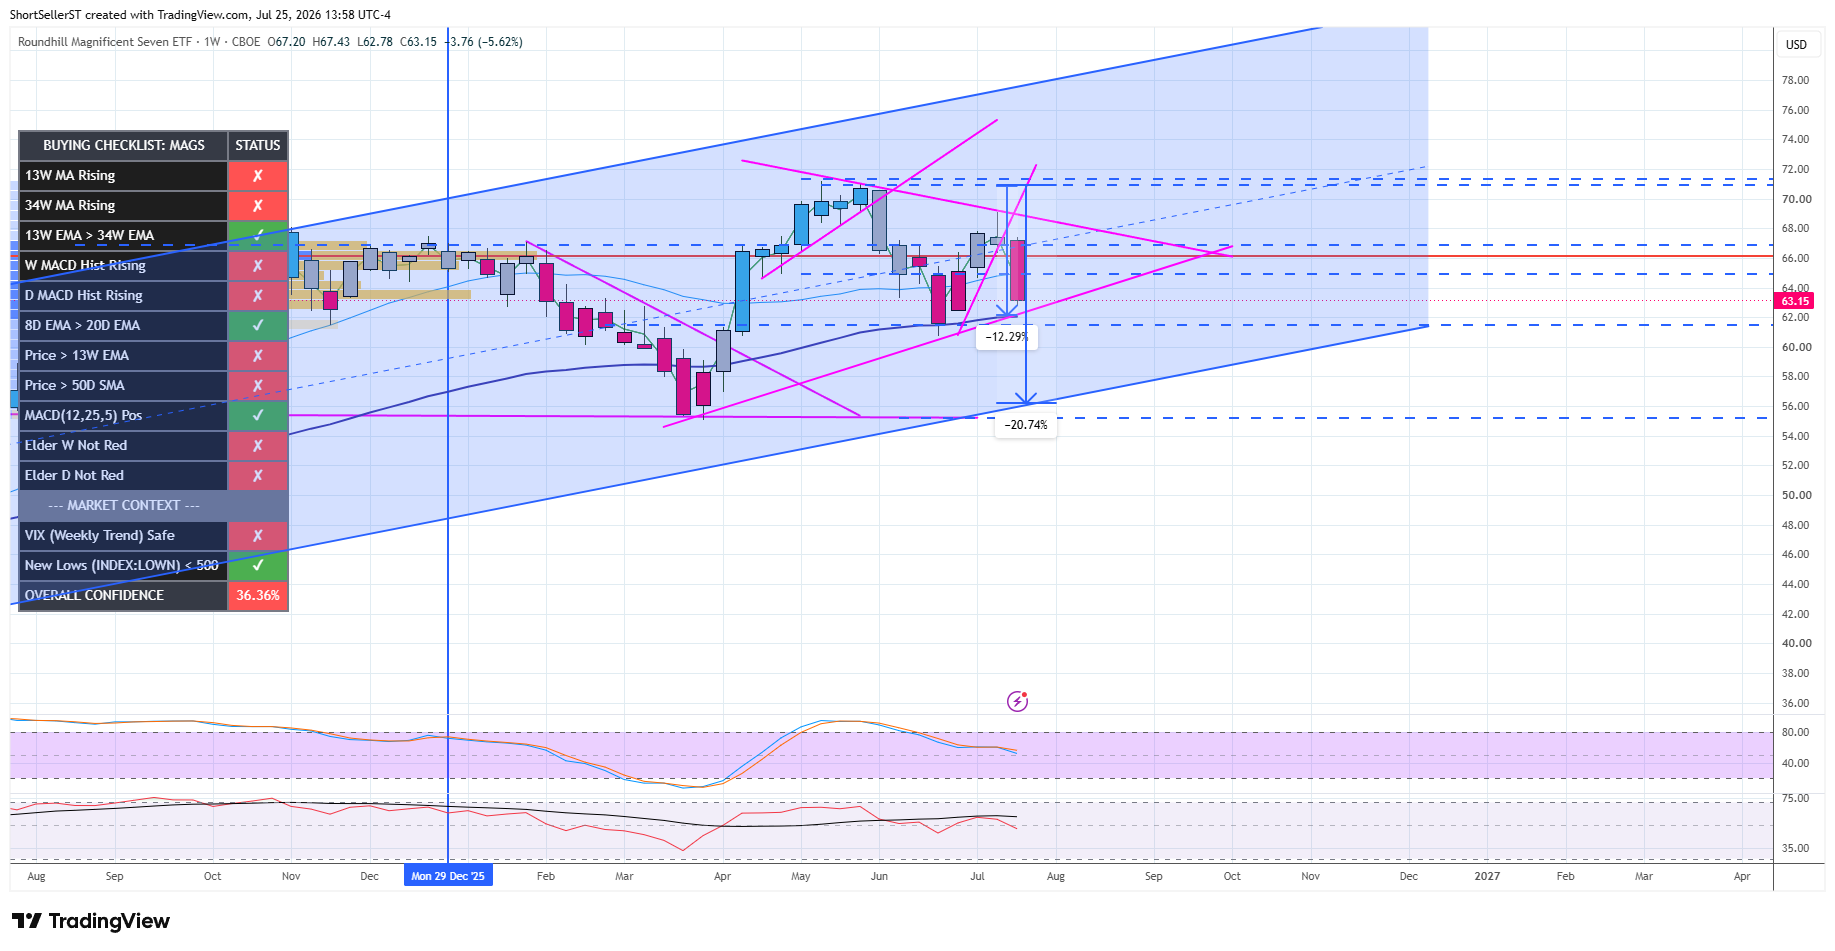
MAGS Magnificent 7 (daily chart) - Still dangerous until we reclaim the DTL // Update while still dangerous (I think we have another 9ish% to go), we can see bounces into the DTL above - currently would expect rejection
7/4 update - wrong call as we didn’t reject and currently above DTL…two targets on chart next up only negated if we lose UTL
7/12 update - Could follow up candle, and strong hyperscalers important to the semi trade ) unless they move higher as a result of capex cuts…boolish regardless
7/18 Update - lost a short term UTL, in a wedge…12ish% from all time highs is wedge support, and if lost 20%ish to bottom of channel (from earlier ATH) - Conversely we are at VWAP/multiple MA’s confluence see if it means anything (open mind)
7/25 Update - same as earlier update UTL needs to hold (wedge) else bottom of channel next up
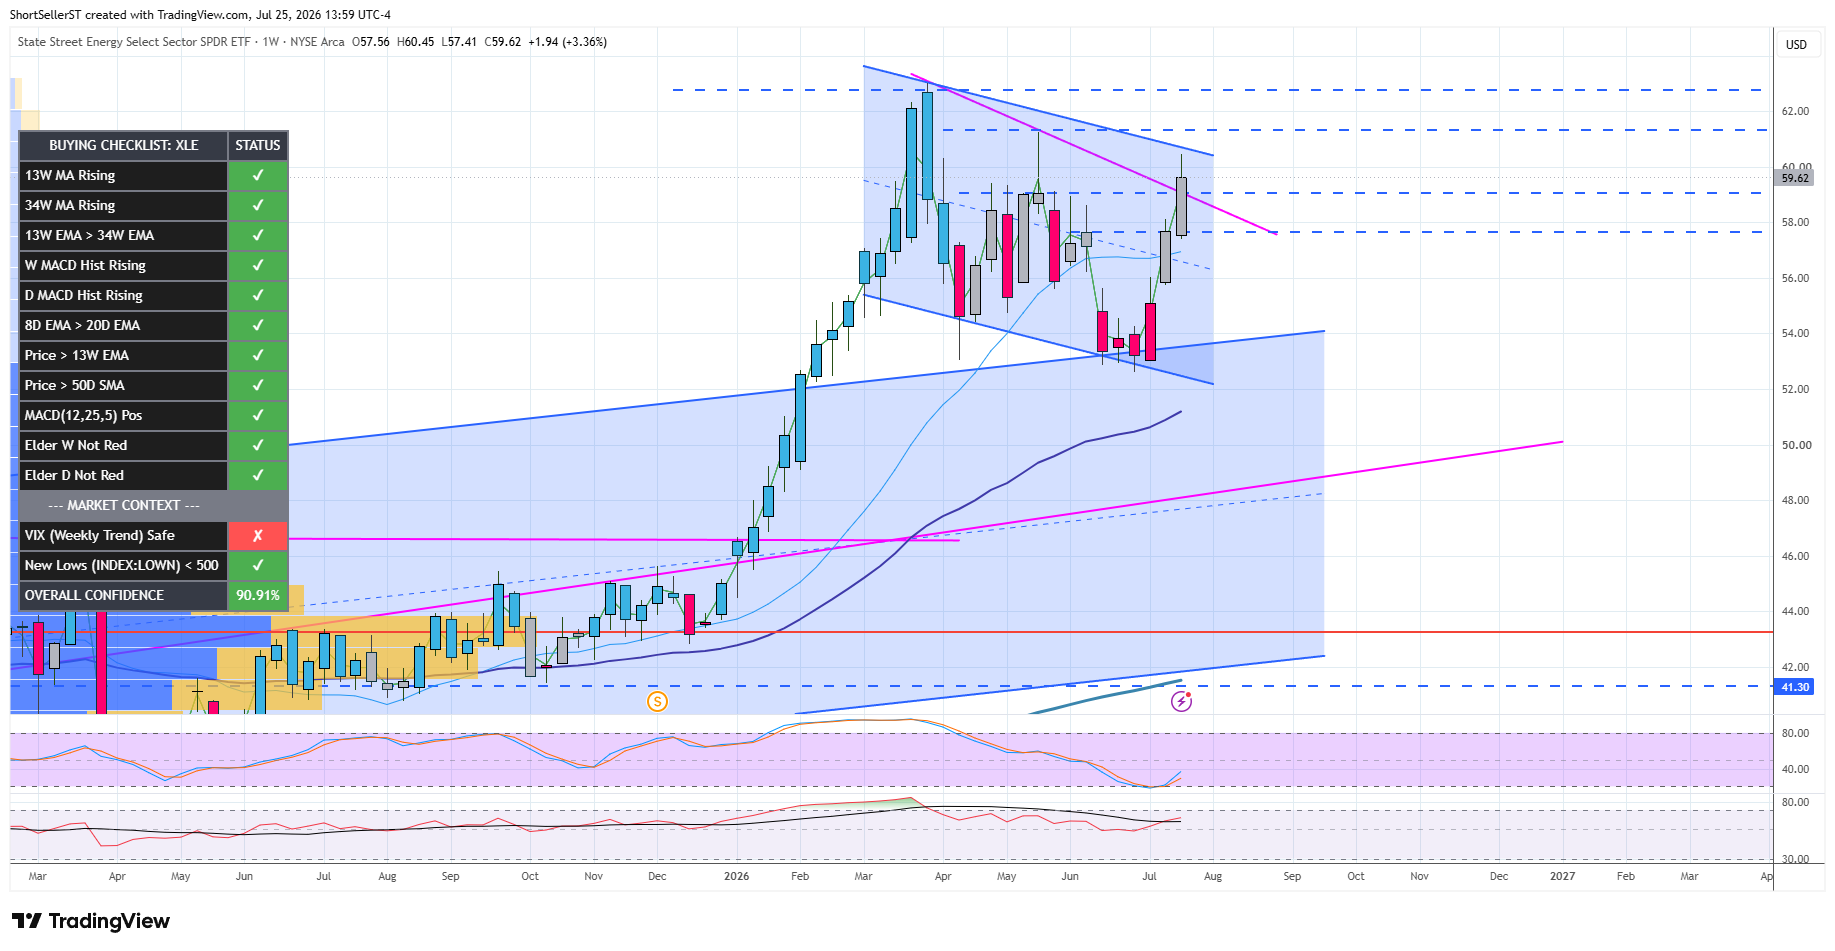
XLE Energy still dangerous IMO….retested and now candle went outside (bullish for XLE and dangerous for market) //Updated shooting start candle suggests we might retest the UTL below //Updated we did retest UTL and failed…next test top of channel below //Update wedge/pennant //Update lost the wedge, and currently retesting earlier channel top. Should we lose that, then the 233MA below next potential support //Update starting to bear flag at earlier channel top
7/4 update - still looks bear flaggy and lower targets (likely) are the rising 55MA coming up from below, and then lower UTL…only negated if we close > DTL above
7/12 update trying to negate bear flag, but only bullish if we close > DTL
7/18 - Update we closed over earlier DTL (one more above), so earlier comments negated, boolish overall
7/25 Update - see earlier comments
EWY (South Korea) key to everything high beta…So far a nice healthy pullback down to it’s UTL…. (continued below)
7/4 Update - We lost that UTL… (continued after paywall).
This is a lot of work, and I hope you will consider subscribing. I will always to try provide valuable content free though for those who do not desire a paid subscription. Not only do subscribers receive this weekly, but we do this for all our thematics as well. Lastly a lot of the magic happens in ‘Chat’ where I answer your questions and provide you charts for your stocks in real time.
Comments
Nothing yet. Say the first thing.
Sign in to join the conversation.