
I’m a big fan of Damnang , and if you don’t know him, he is a semiconductor engineer who specializes in the Photonics (Optical) space. When choosing what might make a good or bad (or better or worse) investment the devil is in the details. I have found Damnang’s previous takes to be more deeply researched, and nuanced than even research firms that charge their institutional and enterprise clients tens of thousands of dollars.
I strongly encourage you to subscribe his Substack here;
and you can follow him on X.com here; https://x.com/damnang2
Damnang has recently done a deep dive on what companies look to have the strongest risk vs reward profiles (from a larger pool of photonic stocks). My Substack article is a look at this select group of stocks through a Technical Analysis viewpoint to accompany Damnang’s fundamental view.
For those of you who aren’t familiar with what T/A can, and can not do - It is not a crystal ball, nor is it Voodoo. In investing, patterns repeat. This is due to human nature, the emotions many use in their buying and selling decisions, as well as mathematics (i.e. Fibonacci levels) and more.
To understand the following charts, please understand the following annotations, and terminology I will be using.
UTL - Uptrend line
DTL - Downtrend line
AOI - Area of Interest
C&H - Cup & Handle
H & S - Head & Shoulders
Dashed lines on my chart are to show areas of support (where buyers were last seen), and areas of resistance (Where sellers (think bagholders who might just want to get out even) formally appeared.
For any of you who want to make T/A a part of your own toolkit, my Substack is a teaching service. I try my best to transfer the T/A tools that I continue to learn, over the decades as a former Wall St professional. I would encourage you to read an earlier Substack article (It is 100% free) located here;
Interpreting (my) Charts
·
Apr 7
I try to embed a lesson in as many of my articles as possible. This is because my main talent is pattern recognition via Charting. If I were only depending on my charts in a post, the content would b…
None of my analysis is an attempt to predict what a stock will do. It is intended to show where we might find sellers (where I might want to pair back or sell), or buyers (where I might want to buy or add). It also highlights patterns that could be playing out, as well as trendlines where algorithmic traders (80%+ of all stock trades) pay attention and trade off of.
Lastly, I offer this not as financial advise, I am just showing the lens through which I see my investments. I strongly encourage you to run any investment through a licensed RIA. Protect your capital at all costs, know your own risk profile, and own your own trade.
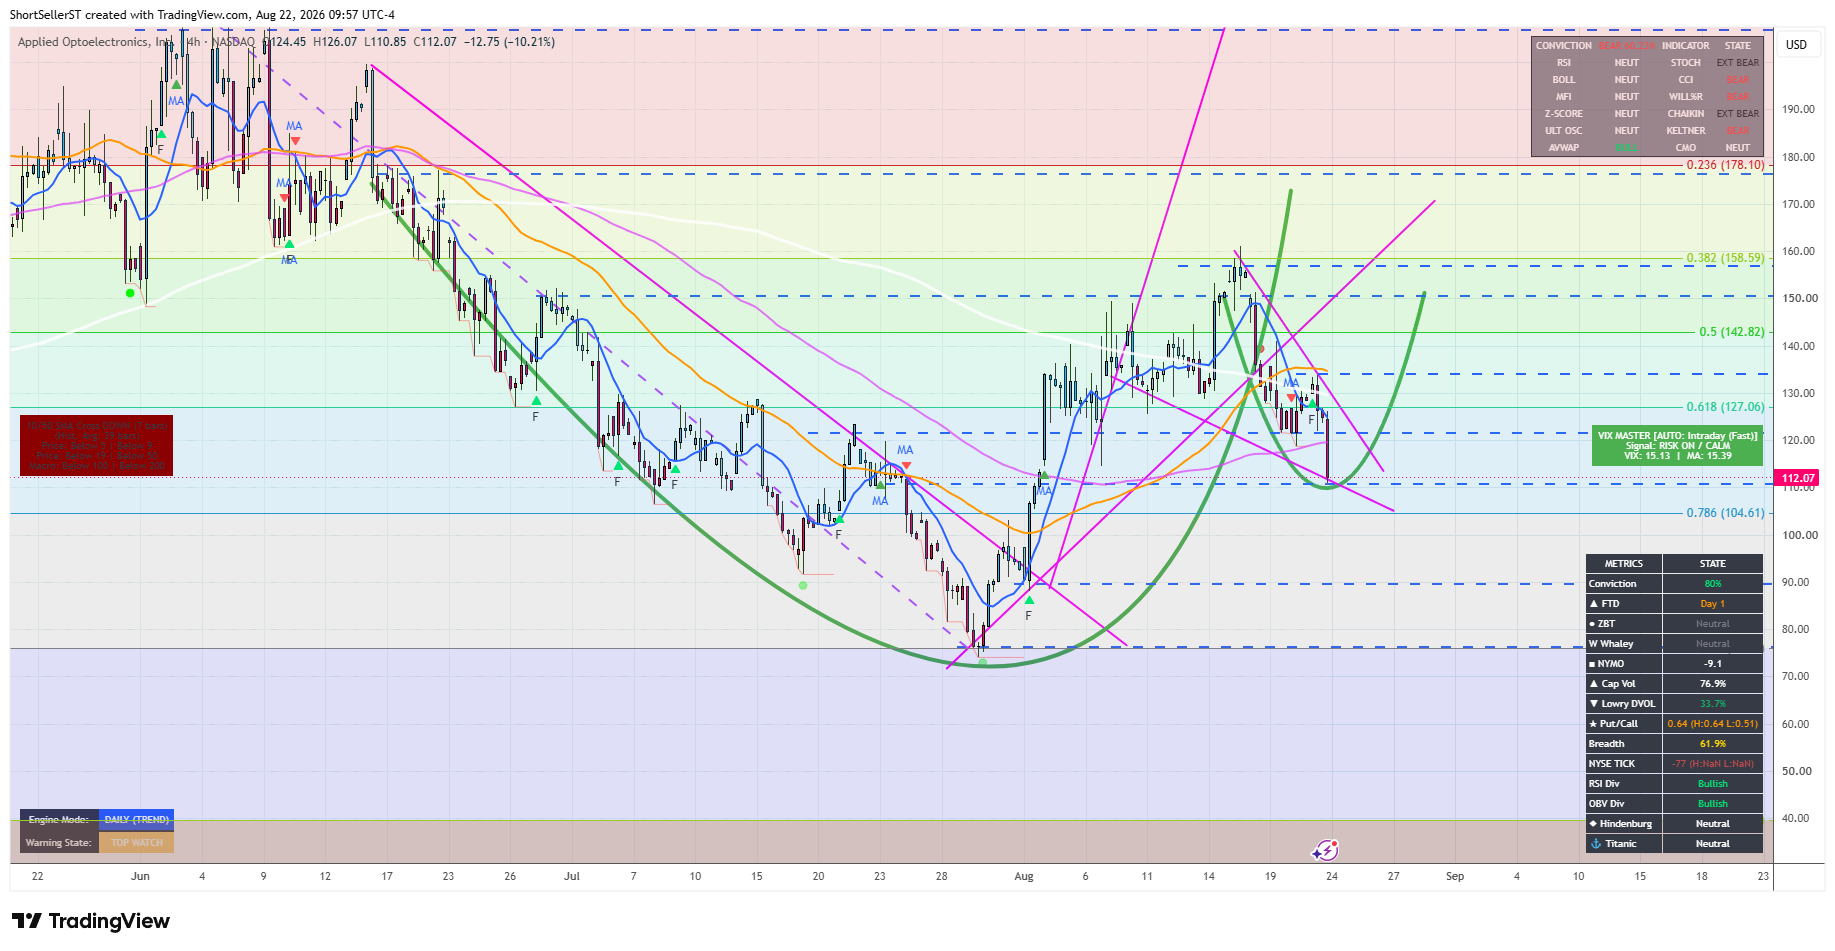
AAOI - Potentially building out a C&H pattern (negated if we lose current level on a weekly close).
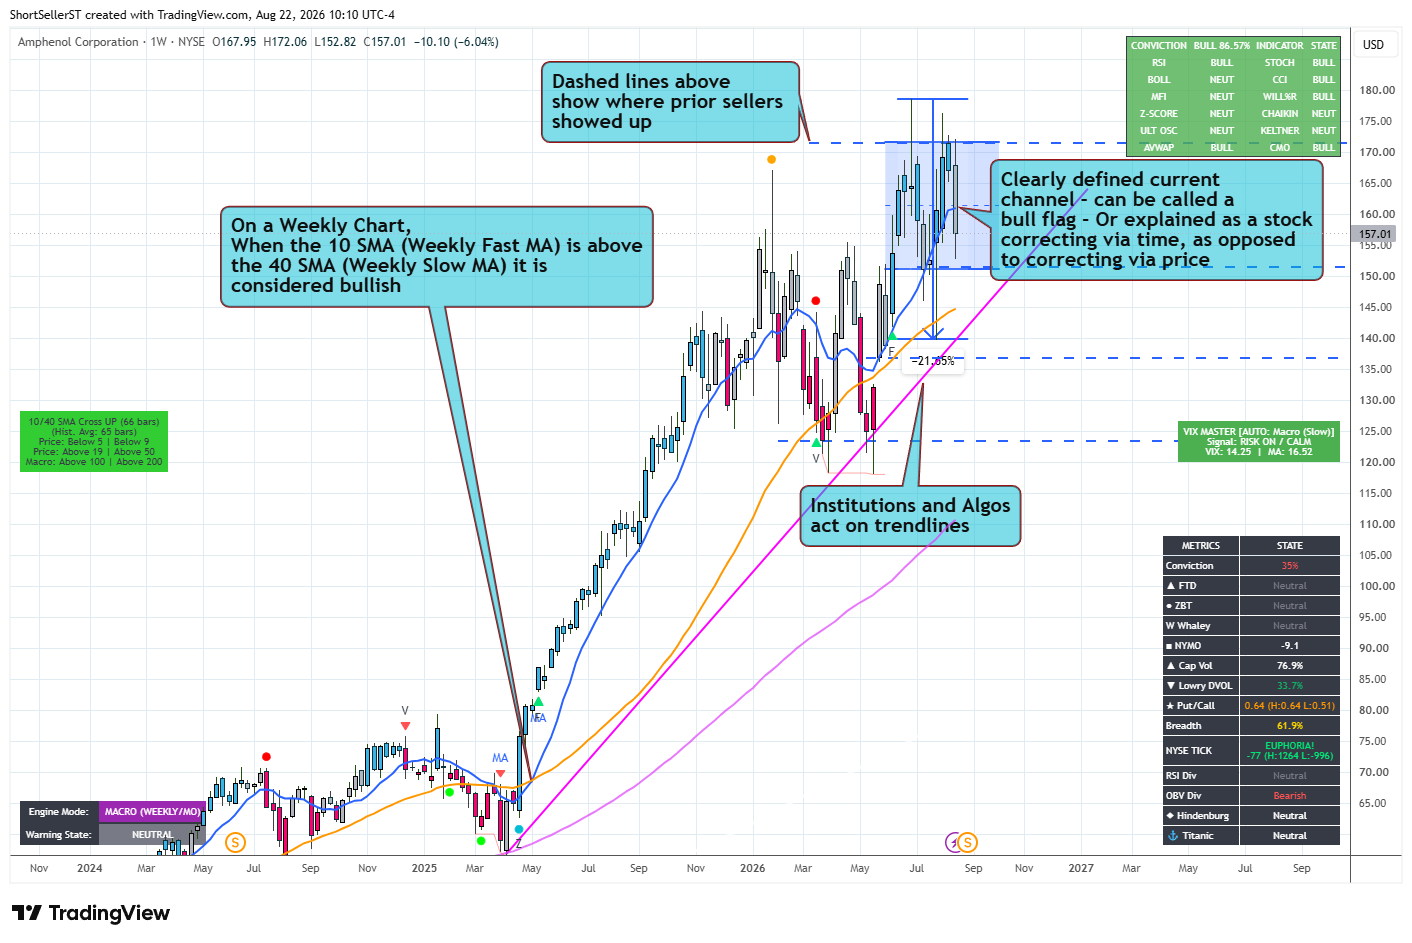
APH
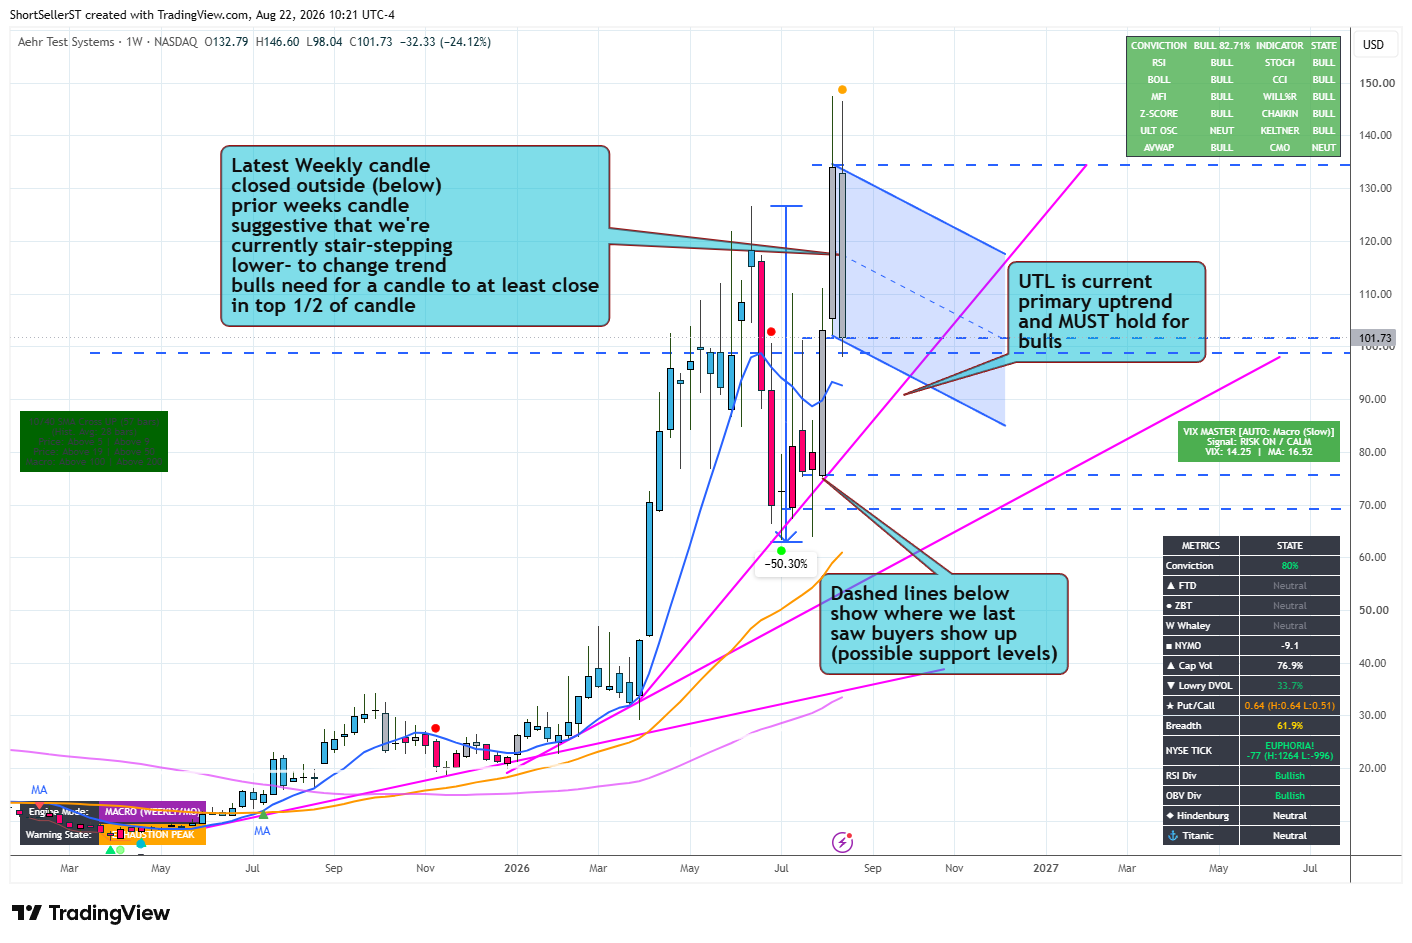
AEHR
AXTI
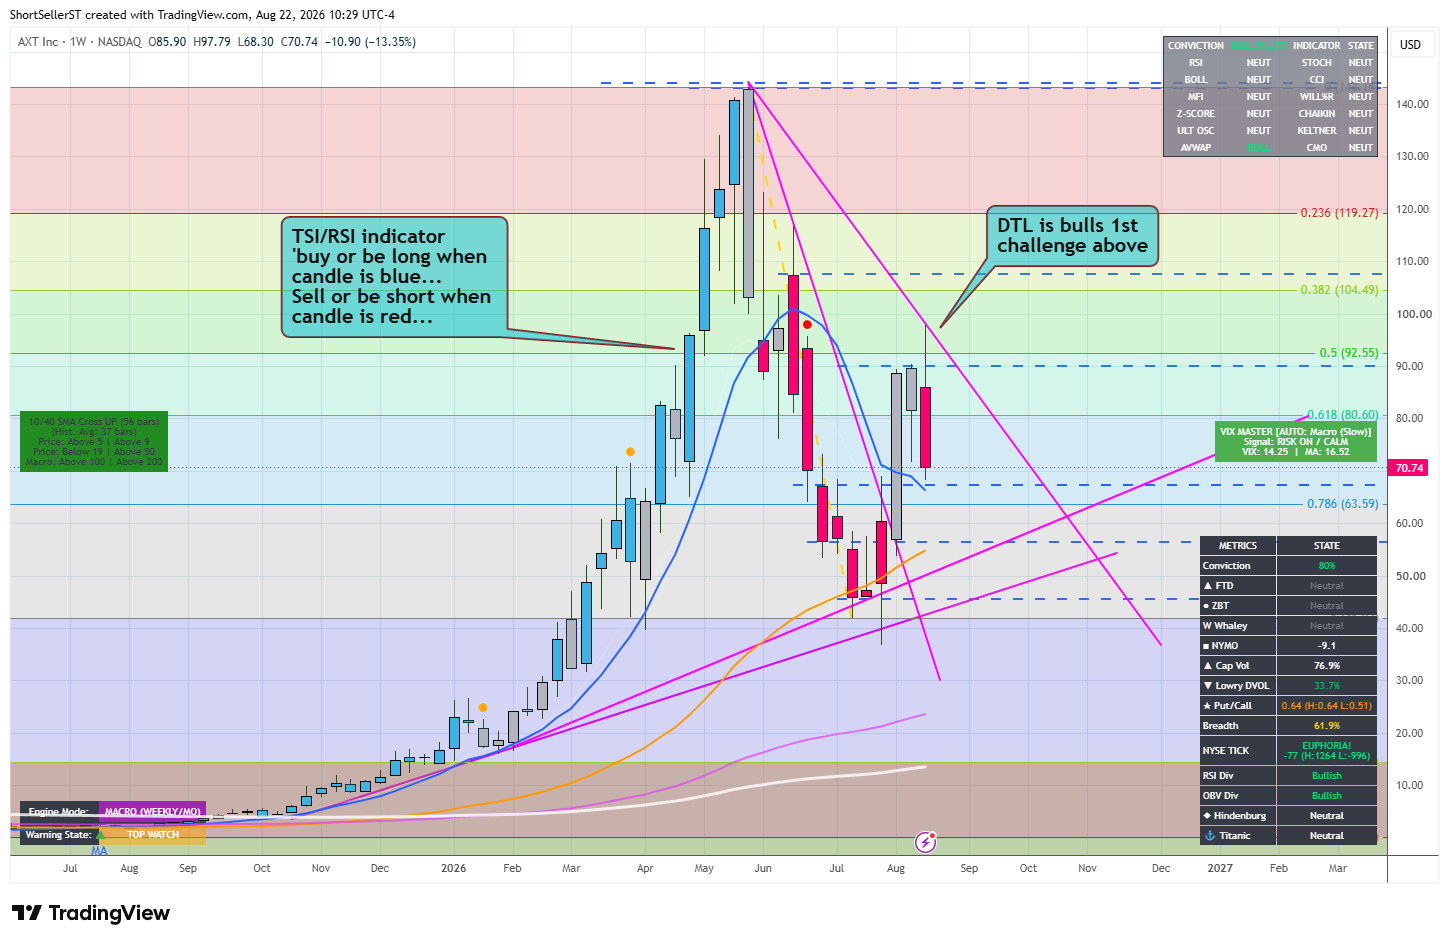
COHR
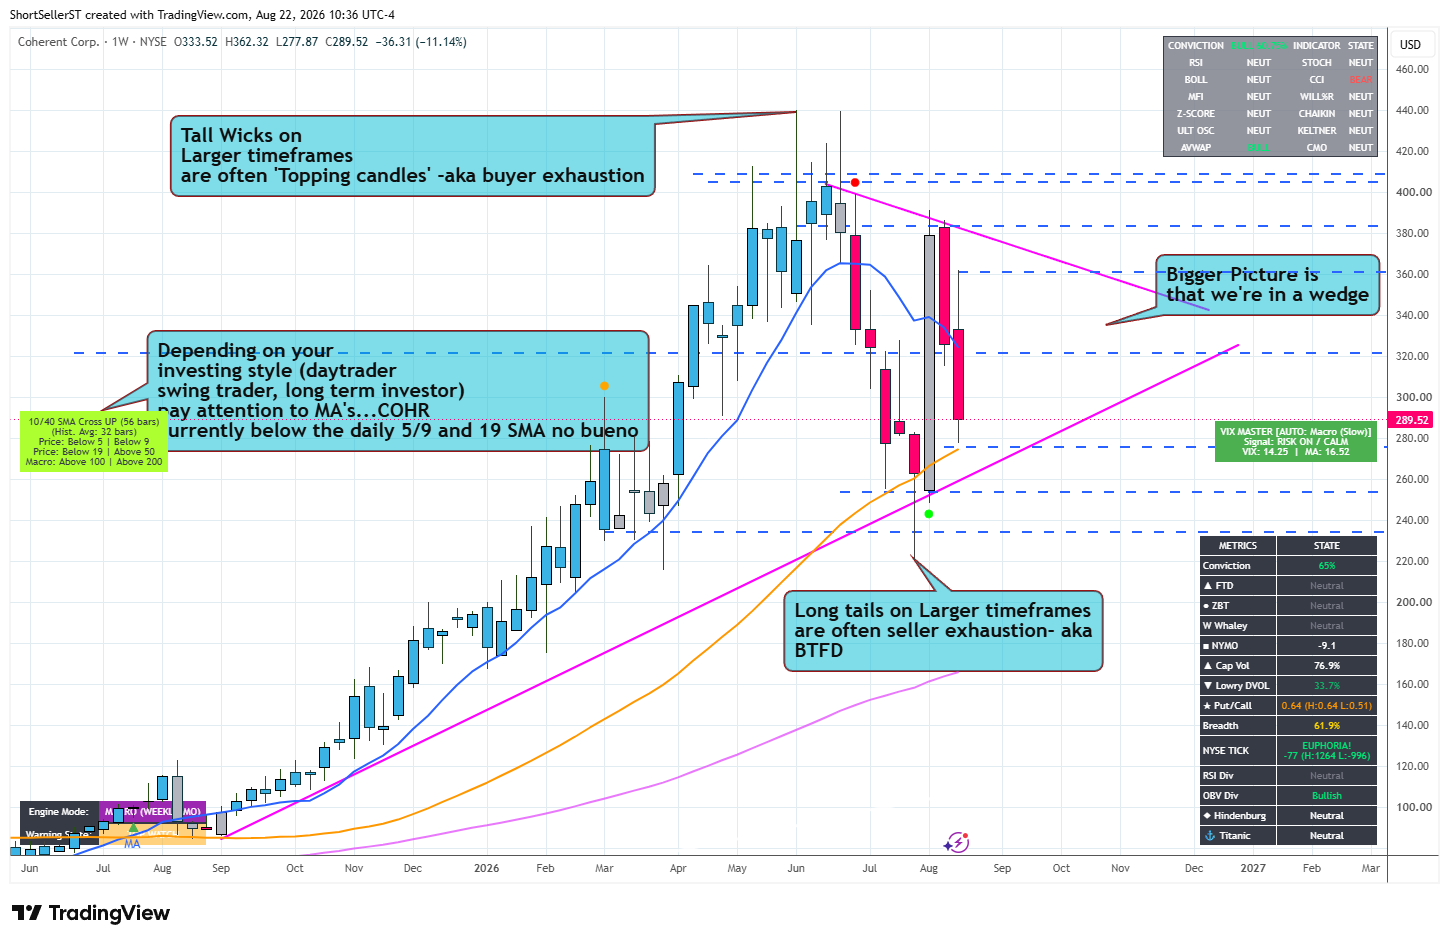
CRDO
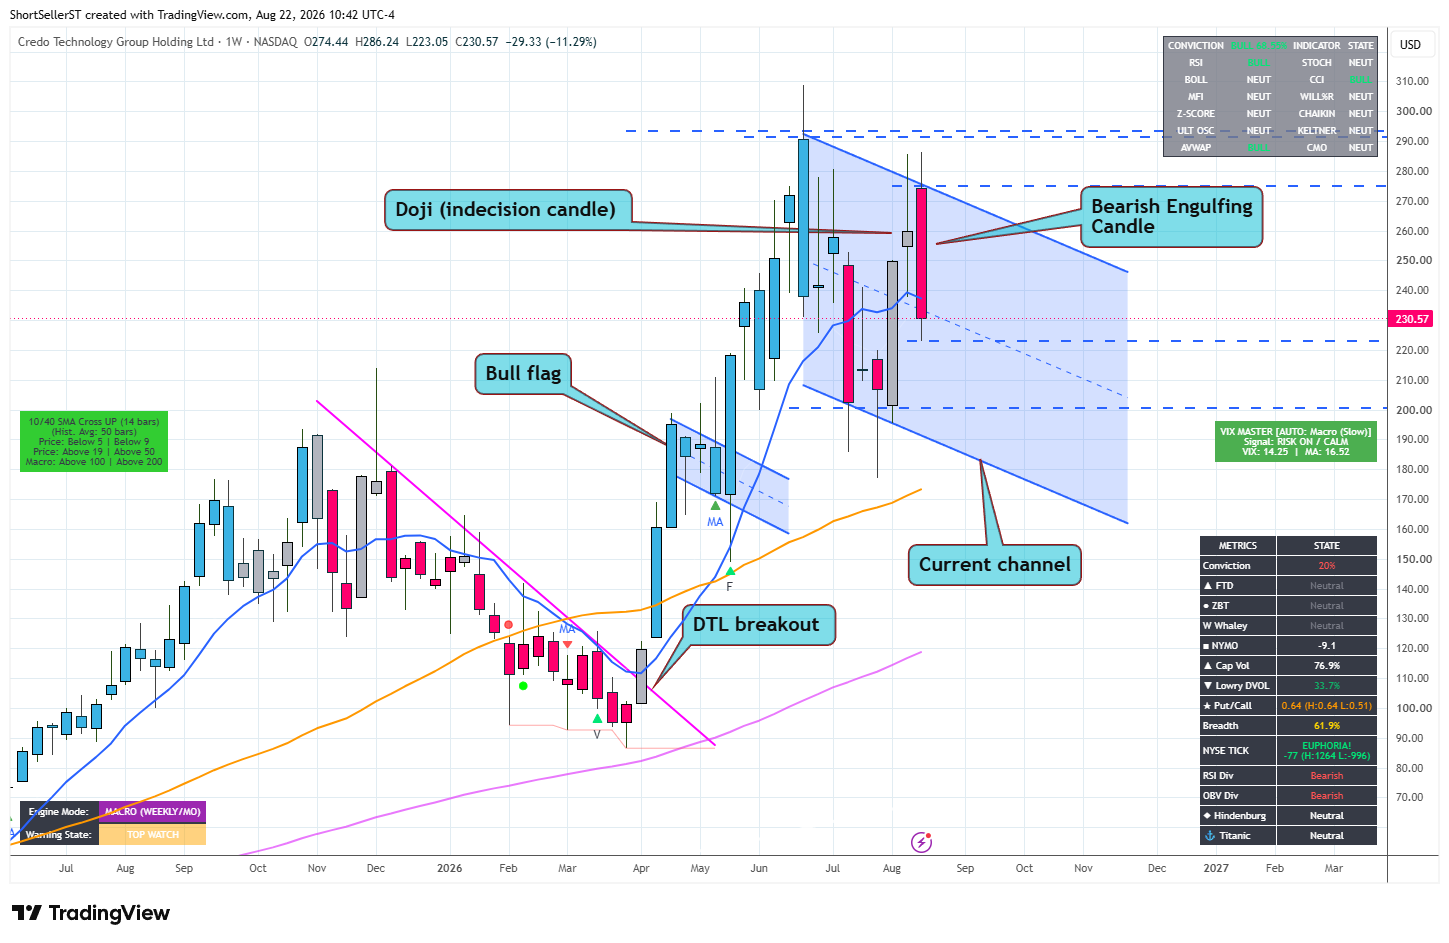
FN
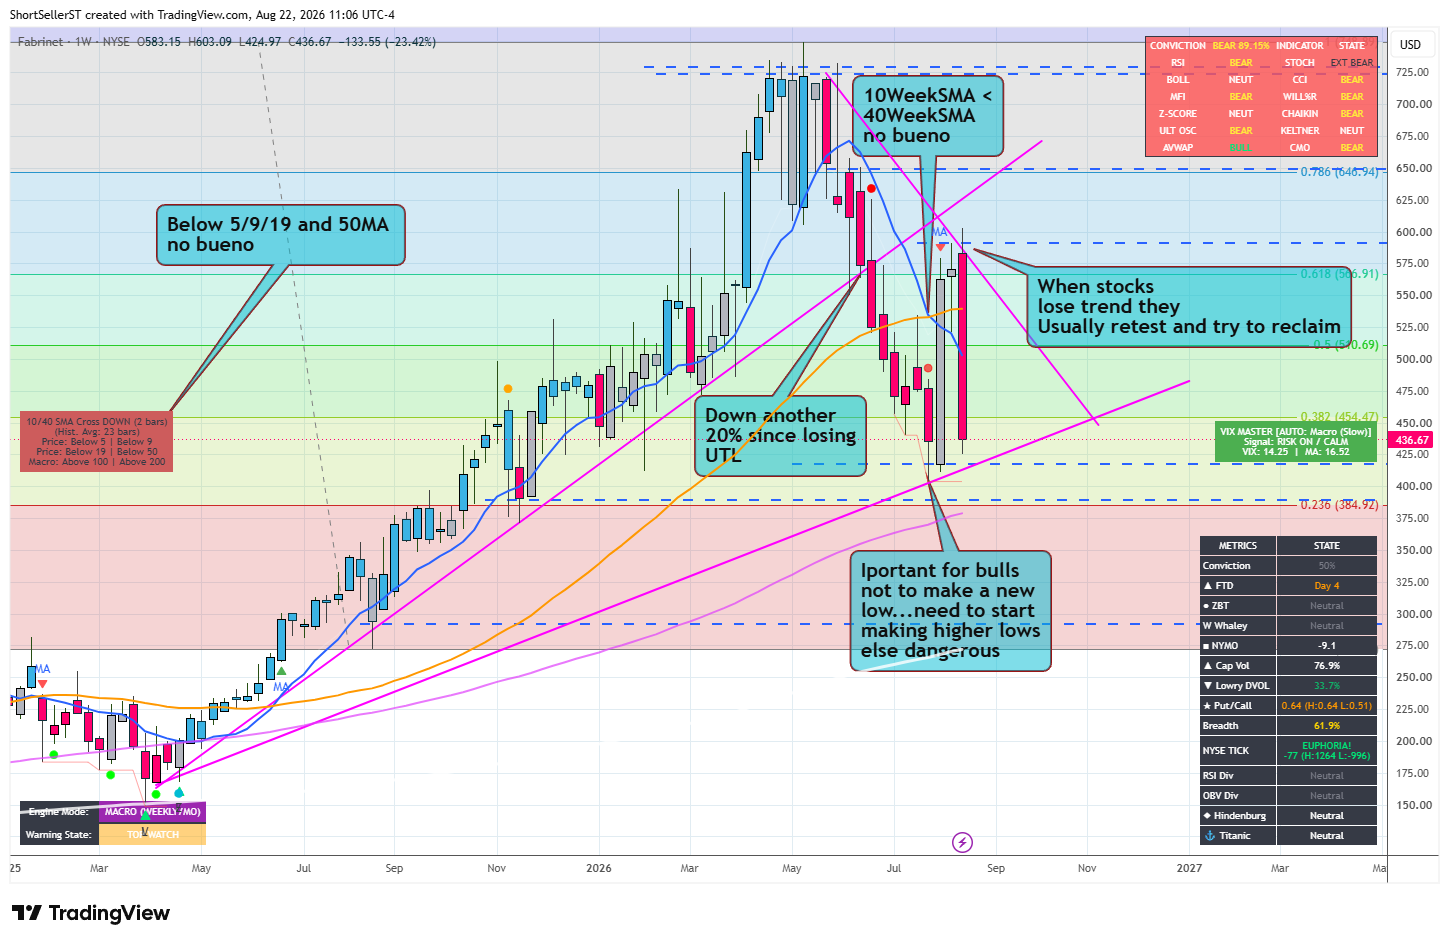
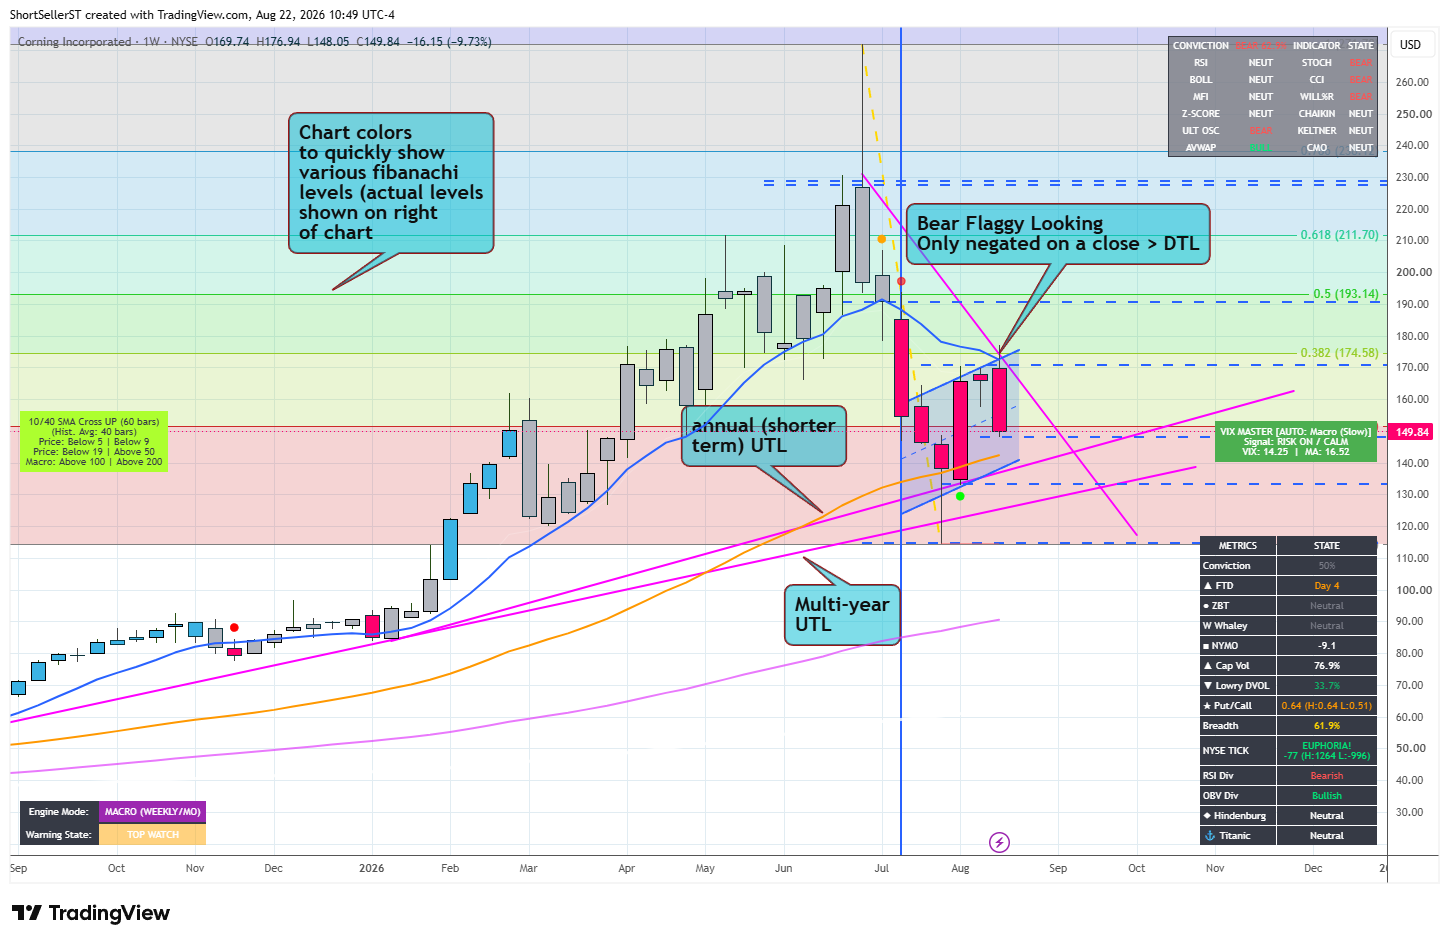
GLW
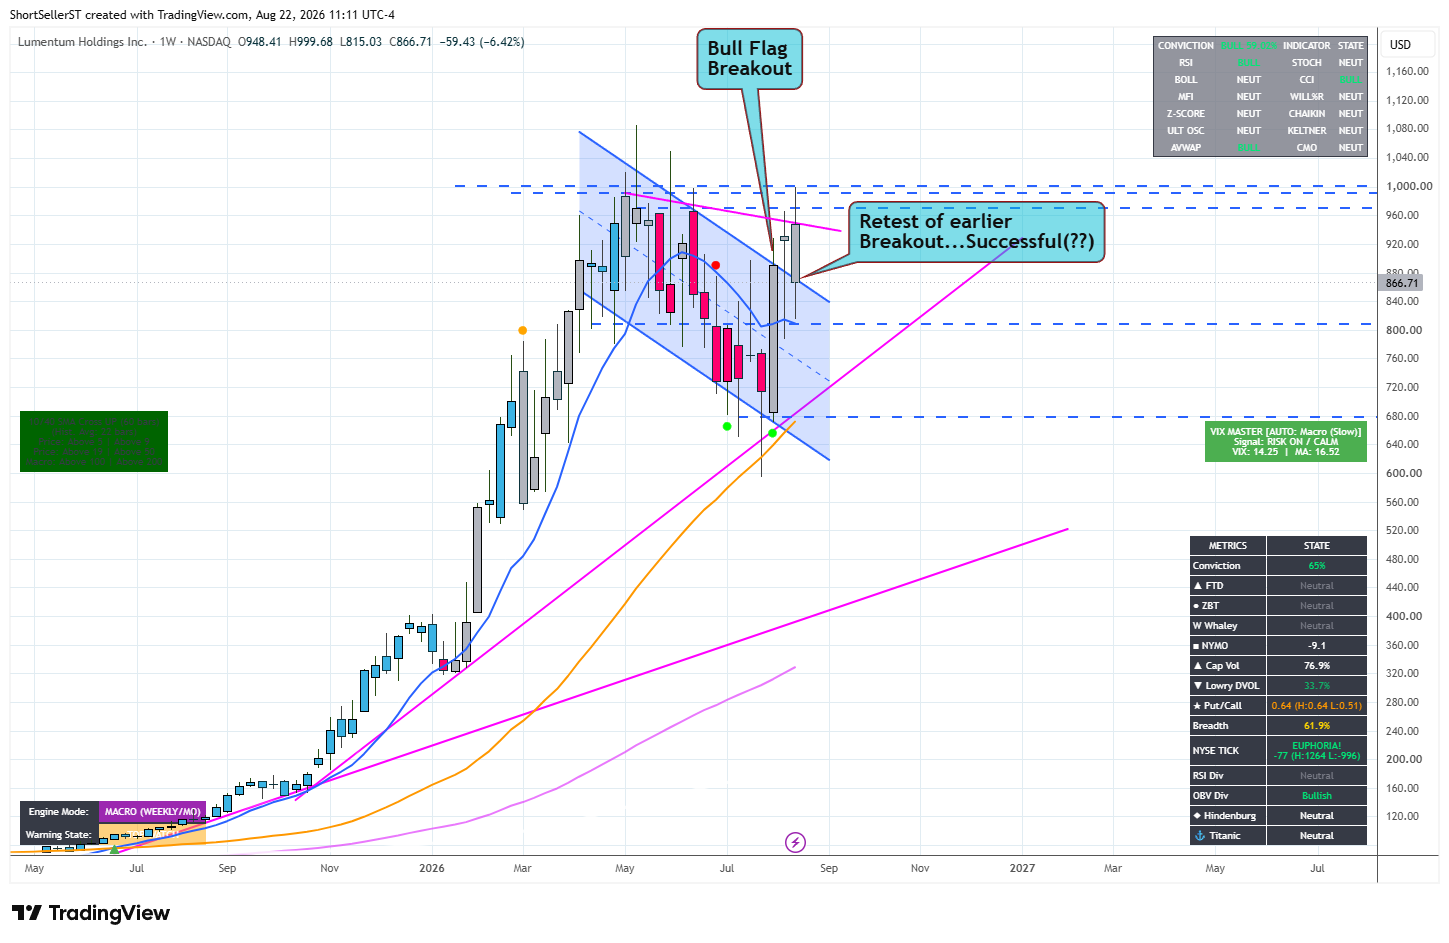
LITE
MRVL (this chart and more charts below paywall)
Comments
Nothing yet. Say the first thing.
Sign in to join the conversation.