

There is a familiar pattern in cardiology: take a test of uncertain validity, layer sophisticated technology on top of it, and present the result as a breakthrough. CT-derived fractional flow reserve — commercially known as HeartFlow FFRCT — follows this template almost perfectly. It is a proprietary, off-site, black-box computational analysis that produces a number meant to approximate invasive FFR, which is itself a number whose clinical foundations are shakier than the cardiology establishment would like to admit.
To understand why CT-FFR is of doubtful utility, you need to understand what it is actually trying to do — and then ask whether that underlying target is worth hitting in the first place.
Part I: What Is FFR and What Does It Actually Measure?
Fractional flow reserve is a pressure-based index of the physiological significance of a coronary stenosis. FFR is defined as the maximum achievable blood flow in the presence of a stenosis divided by maximum flow in that same distribution as it would be if the supplying artery were normal. The concept is straightforward: during cardiac catheterization, a pressure wire is advanced past a stenotic lesion. Maximal hyperemia is then induced — typically by infusing adenosine intravenously at 140 mcg/kg/min — which theoretically drives microvascular resistance to its minimum and makes it approximately constant. Under these conditions, the assumption is that coronary blood flow becomes directly proportional to coronary perfusion pressure. Myocardium that is distal to a stenosis that has adequate collateral supply will be able to maintain perfusion pressure during coronary vasodilation, but if the bottleneck to flow is the epicardial lesion, the distal perfusion pressure falls. FFR was introduced by Nico Pijls et. al. in 1995 in some elegant studies that measured intracoronary pressures in normal coronary arteries and diseased coronary arteries before and after coronary interventions.
FFR is calculated as the ratio of mean distal coronary pressure (Pd) to mean aortic pressure (Pa) during maximal hyperemia: FFR = Pd/Pa. A normal coronary artery has an FFR of 1.0. The clinical threshold that was ultimately adopted is 0.80 — meaning that if pressure distal to a lesion drops to 80% or less of aortic pressure under maximal hyperemia, the lesion is considered hemodynamically significant and worthy of revascularization.
The Critical Assumption: Maximal Hyperemia and Microvascular Resistance
The entire mathematical validity of FFR rests on one foundational assumption: that during adenosine infusion, microvascular resistance reaches a minimum and becomes uniform across the myocardium. This allows pressure to be used as a proxy for flow. If this assumption fails — even partially — the FFR value no longer accurately reflects true coronary blood flow reserve.
The problem is that this assumption routinely fails in real-world patients. If you have excellent microvascular flow, and surges 5 fold with adenosine, as opposed to the usual 4x, a hemodynamically non-significant narrowing may have a significant FFR. Hopefully, FFR isn’t being done in people with very healthy microvascular function too often, but FFR is done all the time in those with microvascular dysfunction. Patients with diabetes, longstanding hypertension, left ventricular hypertrophy, aortic stenosis, or prior myocardial infarction all have microvascular dysfunction, which blunts the hyperemic response. In these patients, microvascular resistance remains elevated and non-uniform during adenosine infusion, which means FFR values become unreliable. The scientific basis paper for HeartFlow’s own CFD platform acknowledged explicitly that models of adenosine-mediated hyperemia may overestimate vasodilation in patients with microvascular disease.
You may have a lesion with a measured FFR of 0.85 that is causing significant downstream ischemia because the microcirculation cannot dilate adequately. The test is measuring pressure when it means to measure flow — and the gap between those two things widens enormously in sick patients, the very patients most likely to undergo the test.
To put this yet another way - if your microvasculature does not open up much with adenosine, your lesion will look mild on FFR. Conversely, if your microvasculature is very healthy and coronary flow surges 4-6 fold with adenosine, then even a minor lesion could have a positive FFR.
Medicine is replete with therapies and procedures with open and shut plausible mechanistic reasoning that does not require further testing. There will be no randomized control trials ever performed for medical therapy vs. a chest tube for a traumatic tension pneumothorax. FFR is most definitely not in the club of so obvious we don’t need to test it. Unfortunately, the weak underlying mechanistic reasoning predicts the weak clinical evidence for FFR that was to come.
Part II: The Evidence Base for Invasive FFR — Stronger Than Myth, Weaker Than Gospel
The clinical case for FFR-guided revascularization rests primarily on two trials: FAME and FAME 2, both published in the New England Journal of Medicine. These are landmark studies and their findings should not be dismissed lightly. But they deserve far more critical scrutiny than they typically receive.
FAME (2009): The Foundational Trial
FAME randomized 1,005 patients with multivessel coronary artery disease to either angiography-guided PCI or FFR-guided PCI. The FFR-guided group had significantly fewer stents placed (1.9 vs 2.7 per patient), and at one year, major adverse cardiac events were 13.2% vs 18.3% (p=0.02). At two years, the benefit was maintained, with a significant reduction in death and MI.
These findings were impressive. But several features of the trial deserve attention. The angiographically-guided comparator arm was unusually aggressive — operators stented lesions with a mean severity of only about 60% stenosis on quantitative coronary analysis, including many lesions that an experienced operator would not have touched. The FFR group benefited partly from simply not stenting lesions that probably should never have been stented. FFR looked good in part because its comparator involved stenting at a rate that exceeded contemporary practice.
Critically, the key investigators — Nico Pijls and Bernard De Bruyne — were among the original developers of FFR technology, held intellectual property related to the technique, and had obvious professional and financial stakes in its success. This is not a disqualifying fact, but it is a material one.
FAME 2 (2012): FFR vs. Medical Therapy
FAME 2 compared FFR-guided PCI to optimal medical therapy alone in patients with stable CAD and at least one lesion with FFR ≤0.80. The trial was stopped early for benefit after enrolling 888 patients, with the PCI group showing an 8% absolute reduction in the primary composite endpoint — driven almost entirely by a reduction in urgent revascularization, not death or MI. At five years, the reduction in hard events remained statistically insignificant. The 41% crossover rate in the medical therapy arm by five years severely limits long-term interpretation.
The Replication Problem
The replication crisis that plagues Science today relates to the inability of results and outcomes to be replicated by independent investigators. It is worth noting that two randomized control trials done that did not have authors Nico Pijls, and Bernard De Bruyne on the paper, did not show a benefit to the use of FFR guided revascularization.
The FUTURE (FUnctional Testing Underlying coronary REvascularization) trial — is the most dramatic one. This was a French trial of 938 patients with multivessel CAD randomized to FFR-guided vs. angiography-guided revascularization. It was stopped early by the DSMB because of a significant mortality signal in the FFR group — 17 deaths vs. 7 in the control arm at interim analysis (HR ~2.4, p=0.038). The final published results showed no benefit of FFR guidance on the primary endpoint, and a trend toward worse outcomes in patients with high SYNTAX scores (≥32). The excess mortality was never fully explained, and proponents largely dismissed it as a play of chance from early stopping. But it’s a concerning data point.
The FLOWER-MI trial randomized 1,171 STEMI patients with multivessel disease to FFR-guided vs. angiography-guided complete revascularization of the non infarct artery. There was no benefit of FFR at one year, and the FFR strategy was actually more expensive.
Then there are the strange statistical anomalies noted by Cardiologist Darrell Francis of Imperial College London in the De Bruyne group FFR trial data. In a study published in the journal Circulation, emerged this figure that aimed to follow those patients in the FAME 2 trial who did not have an intervention for some reason or the other.
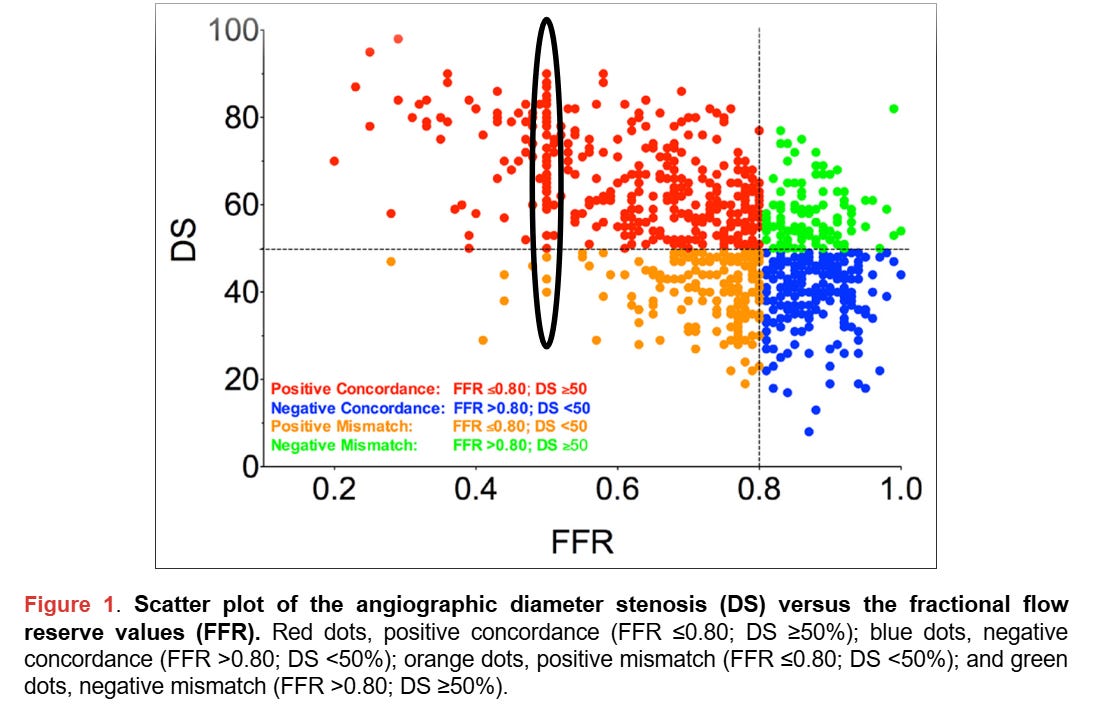
The results supported the use of FFR by demonstrating it was only lesions that were narrow AND had a low FFR that were the highest risk to go on to have a cardiac event. But the curious thing about the scatterplot used to generate these results is an interesting collection of dots at an FFR of 0.5 that correspond to angiographic stenosis from 40%-90%. FFR is typically an automated measurement generated after passing a pressure wire across a coronary lesion. Why would there be such a collection of datapoints at 0.5 ? No answer has been forthcoming from the De Bruyne, Pijls group.
Even in trilogy to FAME, FAME 3, the 1-year incidence of the composite primary end point was 10.6% among patients randomly assigned to undergo FFR-guided PCI and 6.9% among those assigned to undergo CABG (hazard ratio, 1.5; 95% confidence interval [CI], 1.1 to 2.2), findings that were not consistent with noninferiority of FFR-guided PCI — raising additional questions about the limits of FFR-guided decision-making in complex disease.
Outside of the Pijls/De Bruyne research ecosystem, the landmark benefits of FFR have just not replicated consistently. That combined with the aforementioned data irregularities is a big problem.
This is the very shaky ground that CT-FFR seeks to build on. The test is designed to identify FFR-positive lesions non-invasively. But if invasive FFR has major issues, even if CT FFR agrees well with invasive FFR, the use of identifying those lesions more efficiently is of questionable value.
Part III: CT-FFR — Building a Derivative Test on a Shaky Foundation
CT-FFR attempts to estimate the invasive FFR value from a standard coronary CT angiogram (CCTA). The HeartFlow FFRCT system — the only FDA-cleared commercial product — works as follows: the patient’s CCTA data are sent off-site to HeartFlow’s servers, where a three-dimensional geometric model of the coronary tree is reconstructed. Computational fluid dynamics (CFD) is then applied, solving the Navier-Stokes equations numerically to simulate blood flow under simulated hyperemia. Maximal hyperemia is modeled by reducing peripheral microvascular resistance by a factor of approximately 0.24 — a population-based estimate meant to approximate the effect of adenosine at 140 mcg/kg/min. The resulting pressure ratios are reported as an FFRCT value.
The claims by HeartFlow are technologically impressive, but there are a stack of assumptions at play, each of which introduces error that compounds through the calculation.
Thanks for reading Dr. Anish Koka's Newsletter! Subscribe for free to receive new posts and support my work.
What the Algorithm Cannot Know
Every CT-FFR calculation requires the algorithm to make population-based assumptions about physiological variables that are, in reality, highly patient-specific:
Microvascular resistance at hyperemia. The algorithm assumes a fixed relationship between vessel size and downstream resistance, and that adenosine-simulated hyperemia reduces microvascular resistance uniformly by about 75%. In patients with microvascular disease — diabetes, hypertension, LVH, prior MI — this assumption is explicitly acknowledged to be unreliable, potentially substantially so.
Total coronary flow at rest. Baseline coronary flow is estimated from myocardial mass derived from the CT images — an allometric scaling estimate, not a direct measurement of this patient’s actual resting flow state.
Collateral circulation. CT-FFR does not account for collateral vessels, which can significantly influence the true hemodynamic significance of a stenosis. A lesion served by robust collaterals may flag as abnormal on CT-FFR despite meaningful myocardial flow being preserved through alternate routes.
Image quality and segmentation accuracy. The CFD simulation is only as accurate as the 3D anatomical model feeding it. Calcification artifacts, motion artifacts, beam hardening, and suboptimal contrast opacification all introduce errors into lumen segmentation. HeartFlow’s own FDA de novo submission noted that CT-FFR values and invasive FFR values were not precisely correlated across the range of measurement.
These are not minor caveats — microvascular disease is extraordinarily common in the patients undergoing coronary evaluation. It is the rule, not the exception.
The Proprietary Black Box Problem
HeartFlow’s algorithm is proprietary. The precise mathematical models, the specific boundary conditions, the CFD implementation, and the machine-learning enhancements added over successive versions are not publicly available for independent inspection or replication. The FDA’s de novo clearance was based on clinical diagnostic accuracy studies — comparing FFRCT output against invasive FFR — not on independent verification that the underlying computational models are physiologically valid.
When you send a CT scan to HeartFlow and receive an FFRCT value, you are receiving output from a system you cannot audit, based on models you cannot inspect, run on servers you cannot access. The clinician is expected to trust the number. This is a significant departure from the usual epistemic standards of medical evidence.
Part IV: What the Diagnostic Performance Data Actually Show
Proponents of CT-FFR point to the NXT trial and related multicenter studies as validation. In NXT (254 patients, 484 vessels), FFRCT achieved per-vessel sensitivity of 86% and specificity of 79%, with an AUC of 0.90 compared to 0.81 for CCTA alone. Machine-learning-based CT-FFR analyses have reported overall diagnostic accuracy of around 83%, with a correlation coefficient of 0.73 against invasive FFR.
These numbers sound impressive until you examine what they mean at the clinical decision-making level. A correlation coefficient of 0.73 means that CT-FFR explains about 53% of the variance in invasive FFR values. The remaining 47% is unexplained — which is another way of saying that CT-FFR and invasive FFR frequently disagree in ways that would produce different clinical decisions. HeartFlow’s own FDA de novo submission showed that CT-FFR values were not precisely correlated with invasive FFR across the range of measurement — a finding the FDA noted explicitly in its clearance documentation.
A multicenter UK audit published in JACC Cardiovascular Imaging, covering three years of nationally-funded CT-FFR use across 12 centers and 2,298 scans, found a positive predictive value of only 49% — meaning that a positive CT-FFR result was wrong about half the time when validated against invasive FFR. For lesions in the 50–69% stenosis range, the PPV dropped to 35%. This is not meaningfully better than a coin flip.
A 2024 systematic review and meta-analysis in the Journal of the American Heart Association confirmed that CT-FFR agreement with invasive FFR was particularly poor near the 0.80 threshold — the very zone where the test is used to make the binary decision to revascularize or not. (see scatterplot below)
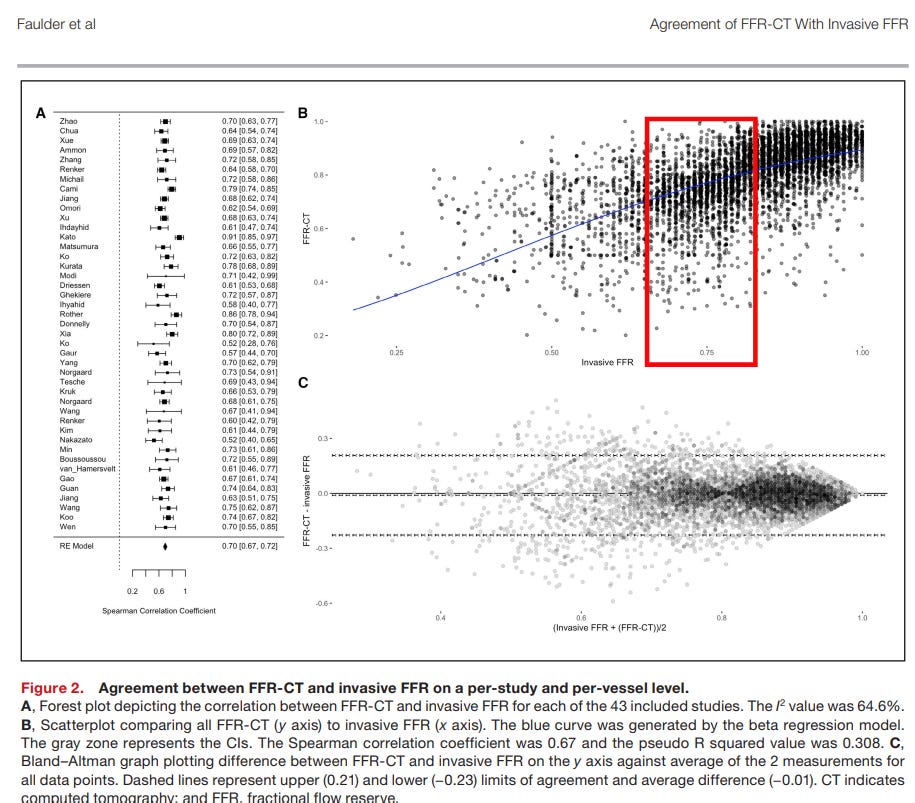
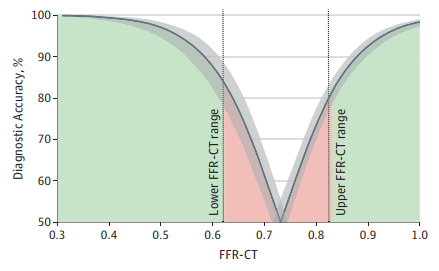
There is also a significant conflict of interest problem in the validation literature. The JAHA meta-analysis found that 15 of 18 HeartFlow studies and 7 of 12 Siemens studies had authors with financial ties to the respective software manufacturers. There is nothing wrong about industry funding , but it is notable that independent validation (like the aforementioned systemic review in JAHA 2024) consistently shows worse performance than industry-supported trials.
Part V: A Chain of Assumptions
To be precise about the logical structure of what CT-FFR is doing: it is approximating an invasive measurement whose clinical utility depends entirely on the validity of its own foundational assumptions. If those assumptions fail, both the invasive test and its CT-derived approximation fail together.
CT-FFR launders the supposed legitimacy of invasive FFR into a noninvasive format, adding a second layer of modeling uncertainty on top of the first. You are not getting “functional information from anatomy.” You are getting a computed estimate of a pressure ratio under simulated conditions that approximate a pharmacological state that is itself variable across individuals, validated against a measurement whose own evidentiary foundations are shaky at best. At each step of this chain, assumptions are made that introduce error. Those errors compound to create non-sense.
The argument that CT-FFR is useful because it reduces invasive catheterizations also deserves careful examination. The PLATFORM trial (also a De Bruyne associated paper) showed that a CT-FFR strategy canceled 61% of planned invasive angiograms. But as noted in an accompanying editorial, there was clearly room for additional non-invasive testing using current routine modalities other than CT/FFR in the group of patients designated for invasive angiography. Regardless, a test that is wrong near its decision threshold roughly half the time in clinical practice is not a reliable gatekeeper to the catheterization laboratory. “Fewer caths” is not the same as “better care” if the gatekeeper is blind and flips a coin to decide if you enter or not.
Part VI: The Business Model — How Reimbursement Cements a Questionable Technology
Understanding why CT-FFR has achieved such rapid clinical adoption despite its evidentiary problems requires understanding the financial infrastructure that has been built around it.
HeartFlow has executed a textbook commercialization strategy. It obtained FDA de novo clearance based on diagnostic accuracy data — not outcome benefit data. It then pursued guideline inclusion, achieving a Class IIa recommendation in the 2021 ACC/AHA Chest Pain Guidelines. Guideline inclusion, in turn, was used to justify coverage and reimbursement — a self-reinforcing cycle in which commercial success precedes and then substitutes for clinical proof of benefit. Notably, the American Society of Nuclear Cardiology declined to endorse the guideline, citing the “over-prominent” role given to CT-FFR given its limited availability, inconsistent insurance coverage, and cost — concerns that have since been addressed not by new outcome data, but by new billing codes.
The reimbursement numbers are material. As of January 2024, HeartFlow’s FFRCT Analysis was upgraded from a Category III CPT code to a permanent Category I CPT code (75580) — a designation the AMA reserves for procedures it considers established standard of care. CMS now reimburses approximately $1,017 per FFRCT analysis for 2025, on top of CCTA reimbursement of $318–$357 depending on setting. HeartFlow’s Plaque Analysis product is already following the same pathway, with Category I code conversion scheduled for January 2026 and reimbursement set at $950.
For an imaging center, a single patient referred for CCTA plus FFRCT plus Plaque Analysis generates well over $2,000 in Medicare reimbursement from a sequence of noninvasive tests that can be performed with minimal incremental effort. The financial incentive to order all three — regardless of whether each is independently indicated — is substantial and largely invisible to the patient. HeartFlow makes this explicit on its own reimbursement resources page, which instructs providers: “When ordering a CCTA for symptomatic patients, include Plaque Analysis and FFRCT Analysis codes for CAD.”
The institutional lobbying behind these reimbursement decisions is notable. The Category I CPT code petition was filed jointly by the ACC, the American College of Radiology, and the Society of Cardiovascular Computed Tomography (SCCT) — an organization whose leadership has significant overlap with HeartFlow’s key opinion leader network, and whose president was quoted directly in HeartFlow's own press release announcing the CMS rate increases. Each successive reimbursement decision is framed by HeartFlow as validation of clinical value — a rhetorical move that conflates payment policy with evidence.
The downstream incentive structure means health systems are all in, shaky evidence be damned. A positive CT-FFR result — which in intermediate stenoses is wrong about half the time — generates a referral for invasive coronary angiography. That angiogram generates facility fees, professional fees, and potentially a coronary stent RVU.
None of this means everyone ordering CT-FFR is acting in bad faith. Most cardiologists genuinely believe they are using a validated tool. That belief has been carefully cultivated by a company that has dedicated substantial resources to guideline committee relationships, and publications to build a carefully crafted evidence base. The problem is structural — but the structure matters enormously when we try to understand why a test of modest and unproven clinical benefit has become, in HeartFlow’s own words, “the standard of care.”
The Bottom Line
CT-FFR is technologically sophisticated, commercially aggressive, and clinically oversold. Its problems are deep and structural.
The algorithm rests on population-based physiological assumptions routinely violated in real patients. Its reference standard is a test whose foundations are questionable and whose results have not replicated rigorously outside the original investigator group. Its real-world positive predictive value in intermediate stenoses falls well short of the clinical precision needed to guide revascularization decisions. Its algorithm is proprietary and cannot be independently audited. And not to open an even bigger can of worms, the downstream treatment decisions it supports — revascularization in stable CAD — are themselves of no mortality benefit, as recent foundational trials of revascularization ORBITA and ISCHEMIA have underscored.
What CT-FFR has succeeded in is building a revenue-generating diagnostic pathway that gives both cardiologists and patients the impression of precision physiology while delivering, in practice, a number of modest reliability derived from a model of uncertain biological validity.
Most good cardiologists will treat invasive FFR and CT FFR as one datapoint among many to make a clinical decision regarding the placement of a coronary stent. Unfortunately, the overall tenor and push from many key opinion leaders in this space is to abrogate decision making to the algorithmically derived number via CT-FFR. Some cardiologists will even be pushed by their patients to address the bad looking number generated by CT FFR. All of this is happening in the context of handsome reimbursement to imaging centers for CT-FFR, as well as a climate that pays interventional cardiologists to do more rather than less.
The right question to ask about CT-FFR is not whether the number correlates with invasive FFR - it performs poorly when we most need it to be accurate. The right question is whether acting on that number improves outcomes for patients. Until that trial happens and shows some clearly positive results on outcomes that matter, CT-FFR will remain ensconced as a business model dressed up as a diagnostic test.
Anish Koka is a cardiologist who writes about medicine and health policy. He also cohosts a weekly medical podcast called The Doctors Lounge. Follow him on @X : @anish_koka .
Thanks for reading Dr. Anish Koka's Newsletter! Subscribe for free to receive new posts and support my work.
Comments
Nothing yet. Say the first thing.
Sign in to join the conversation.