

Portfolio construction is something I continue to work on and evolve. As the account grows - we gain access to more uncorrelated assets. White sugar futures are a recent example - while the rest of the portfolio (which is essentially all the same trade of shorting the dollar without shorting the dollar) hasn’t done much this last week, white sugar has done this:
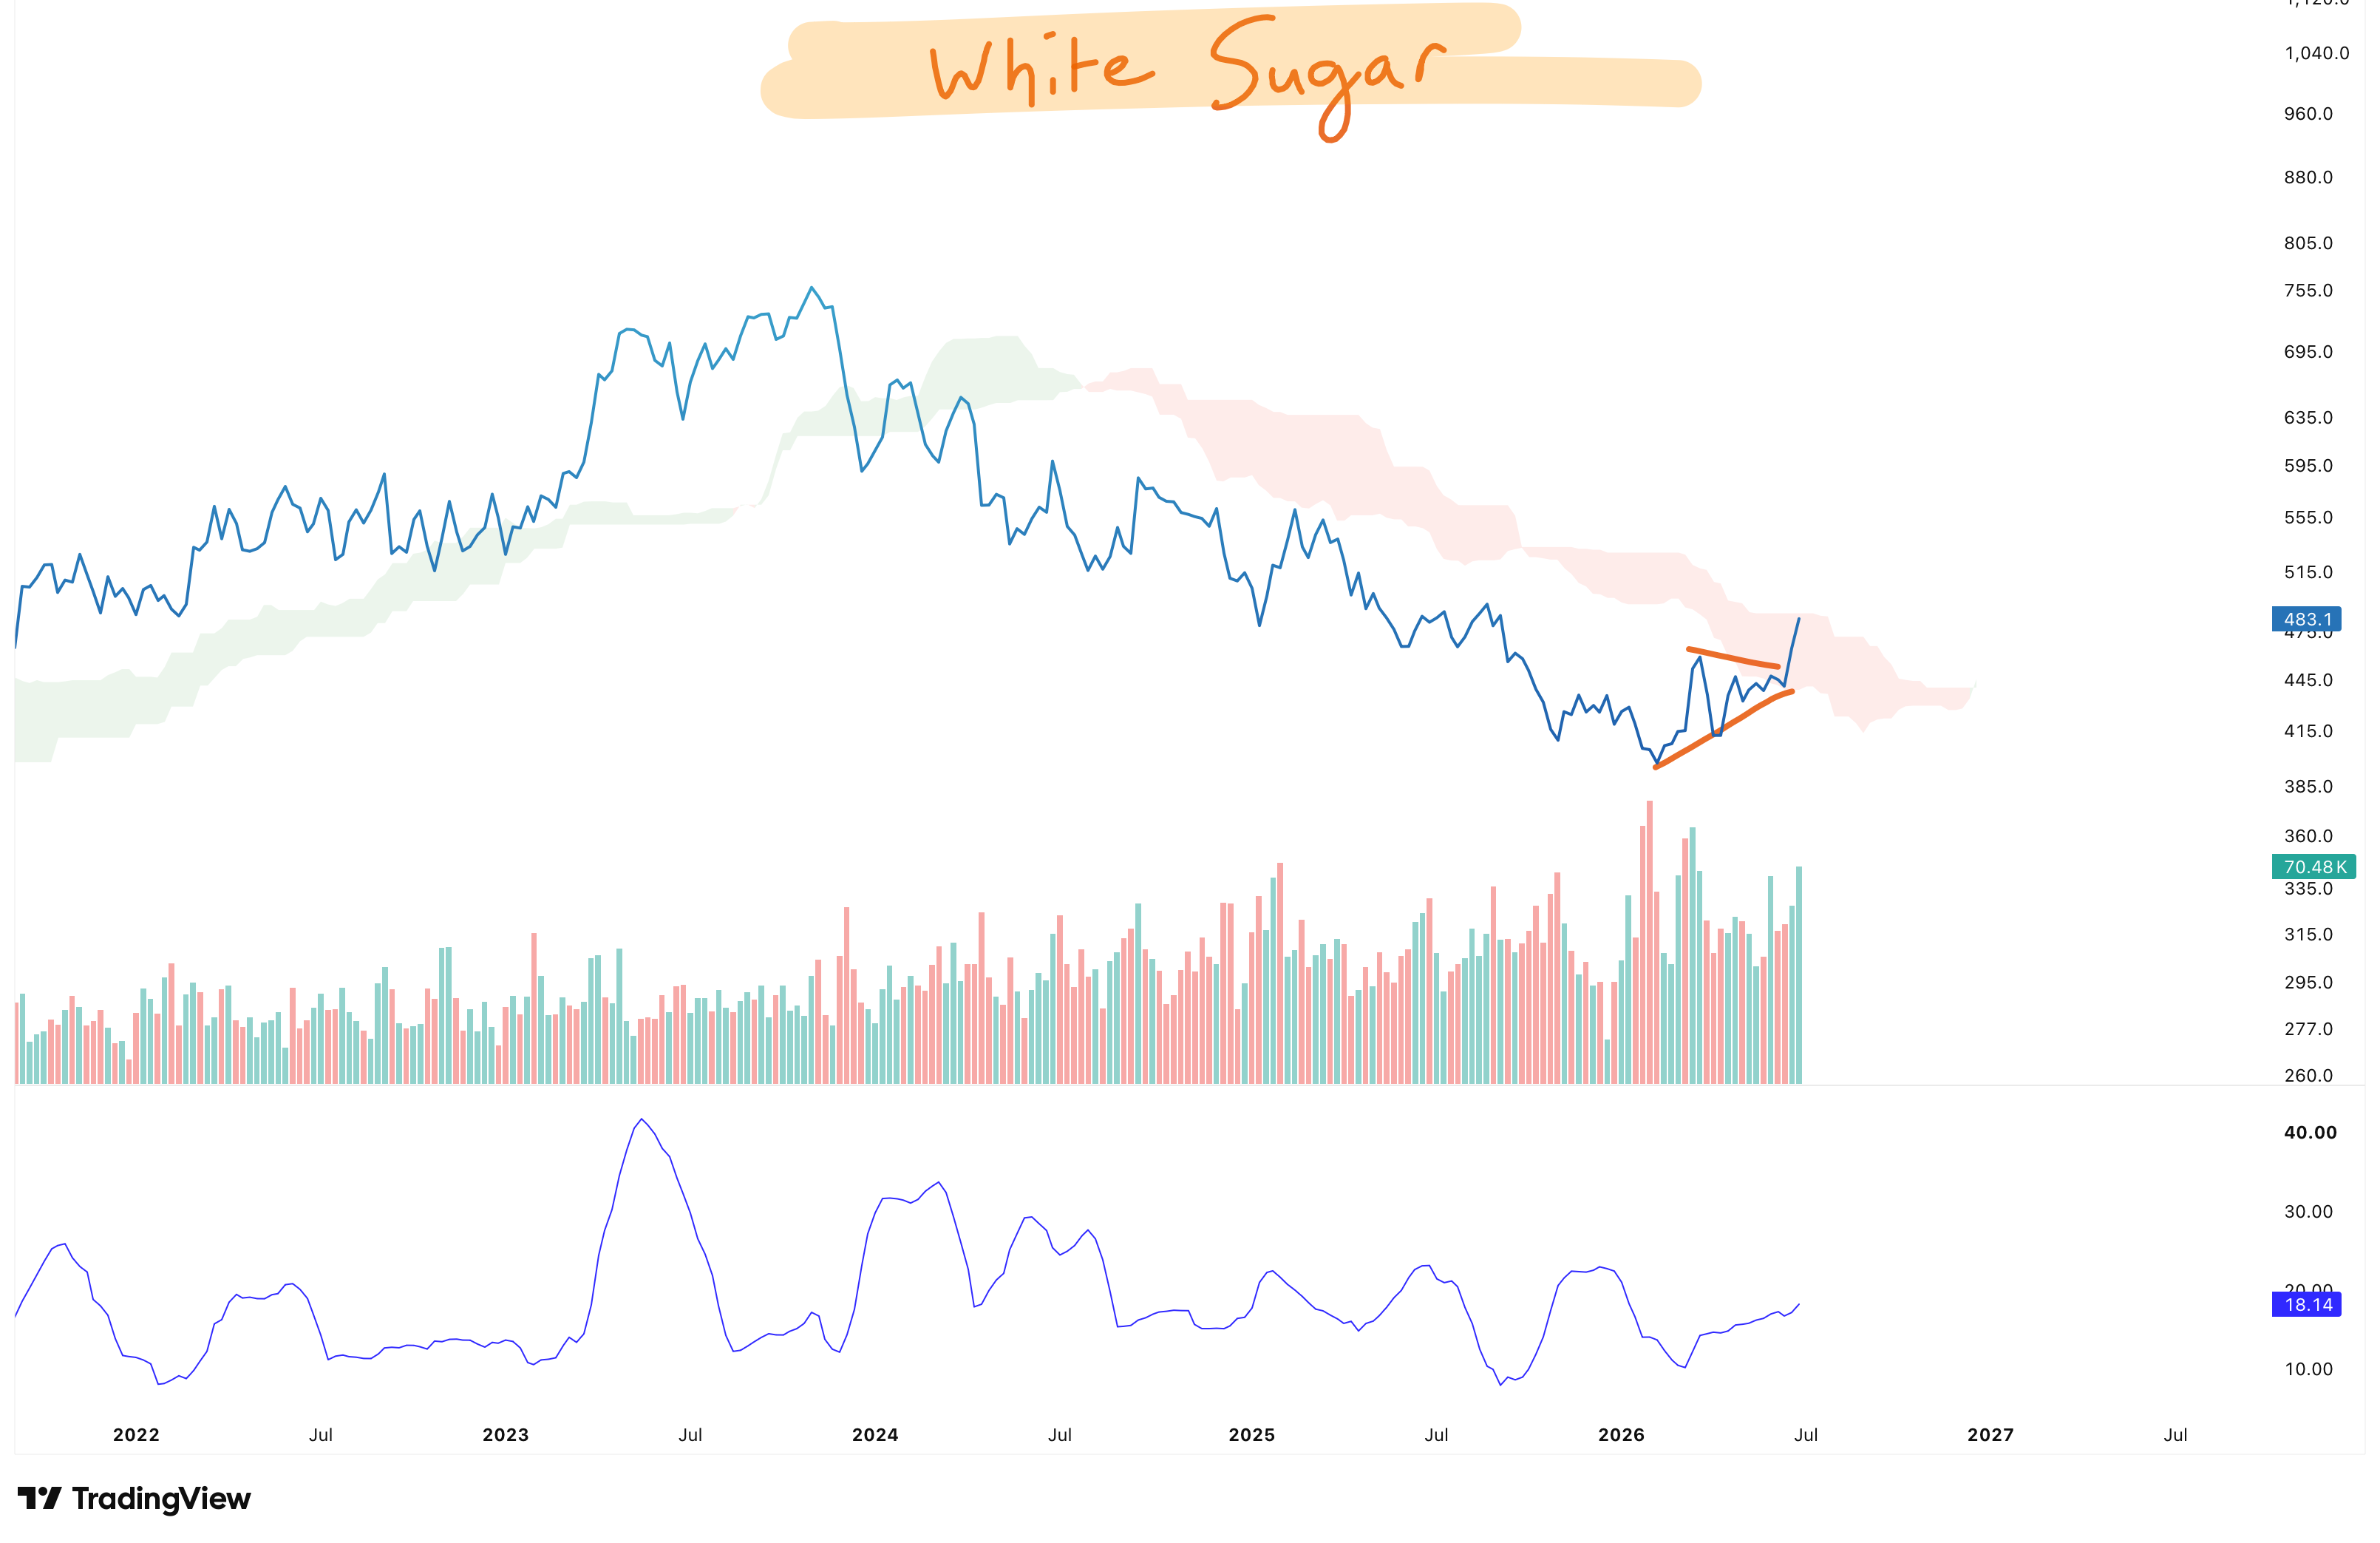
We bought right as the price line entered the cloud, at the narrowest point in that volatility compression wedge. Notice a couple interesting things on this chart. Look at that large red trading volume bar (vertical bars at bottom of the chart) a few weeks back right at the beginning of the wedge - indicating the highest volume of selling in several years. That looks like capitulation to me. Also notice that since then, trading volume has increased, with considerable buying volume (the green vertical bars).
Thanks for reading Analogics! Subscribe for free to receive new posts and support my work.
Maybe it’s due to El Niño (Spanish for The Niño), maybe people are stressed out and binging on Lik-a-Maid. I don’t care. Price go up, I buy it.
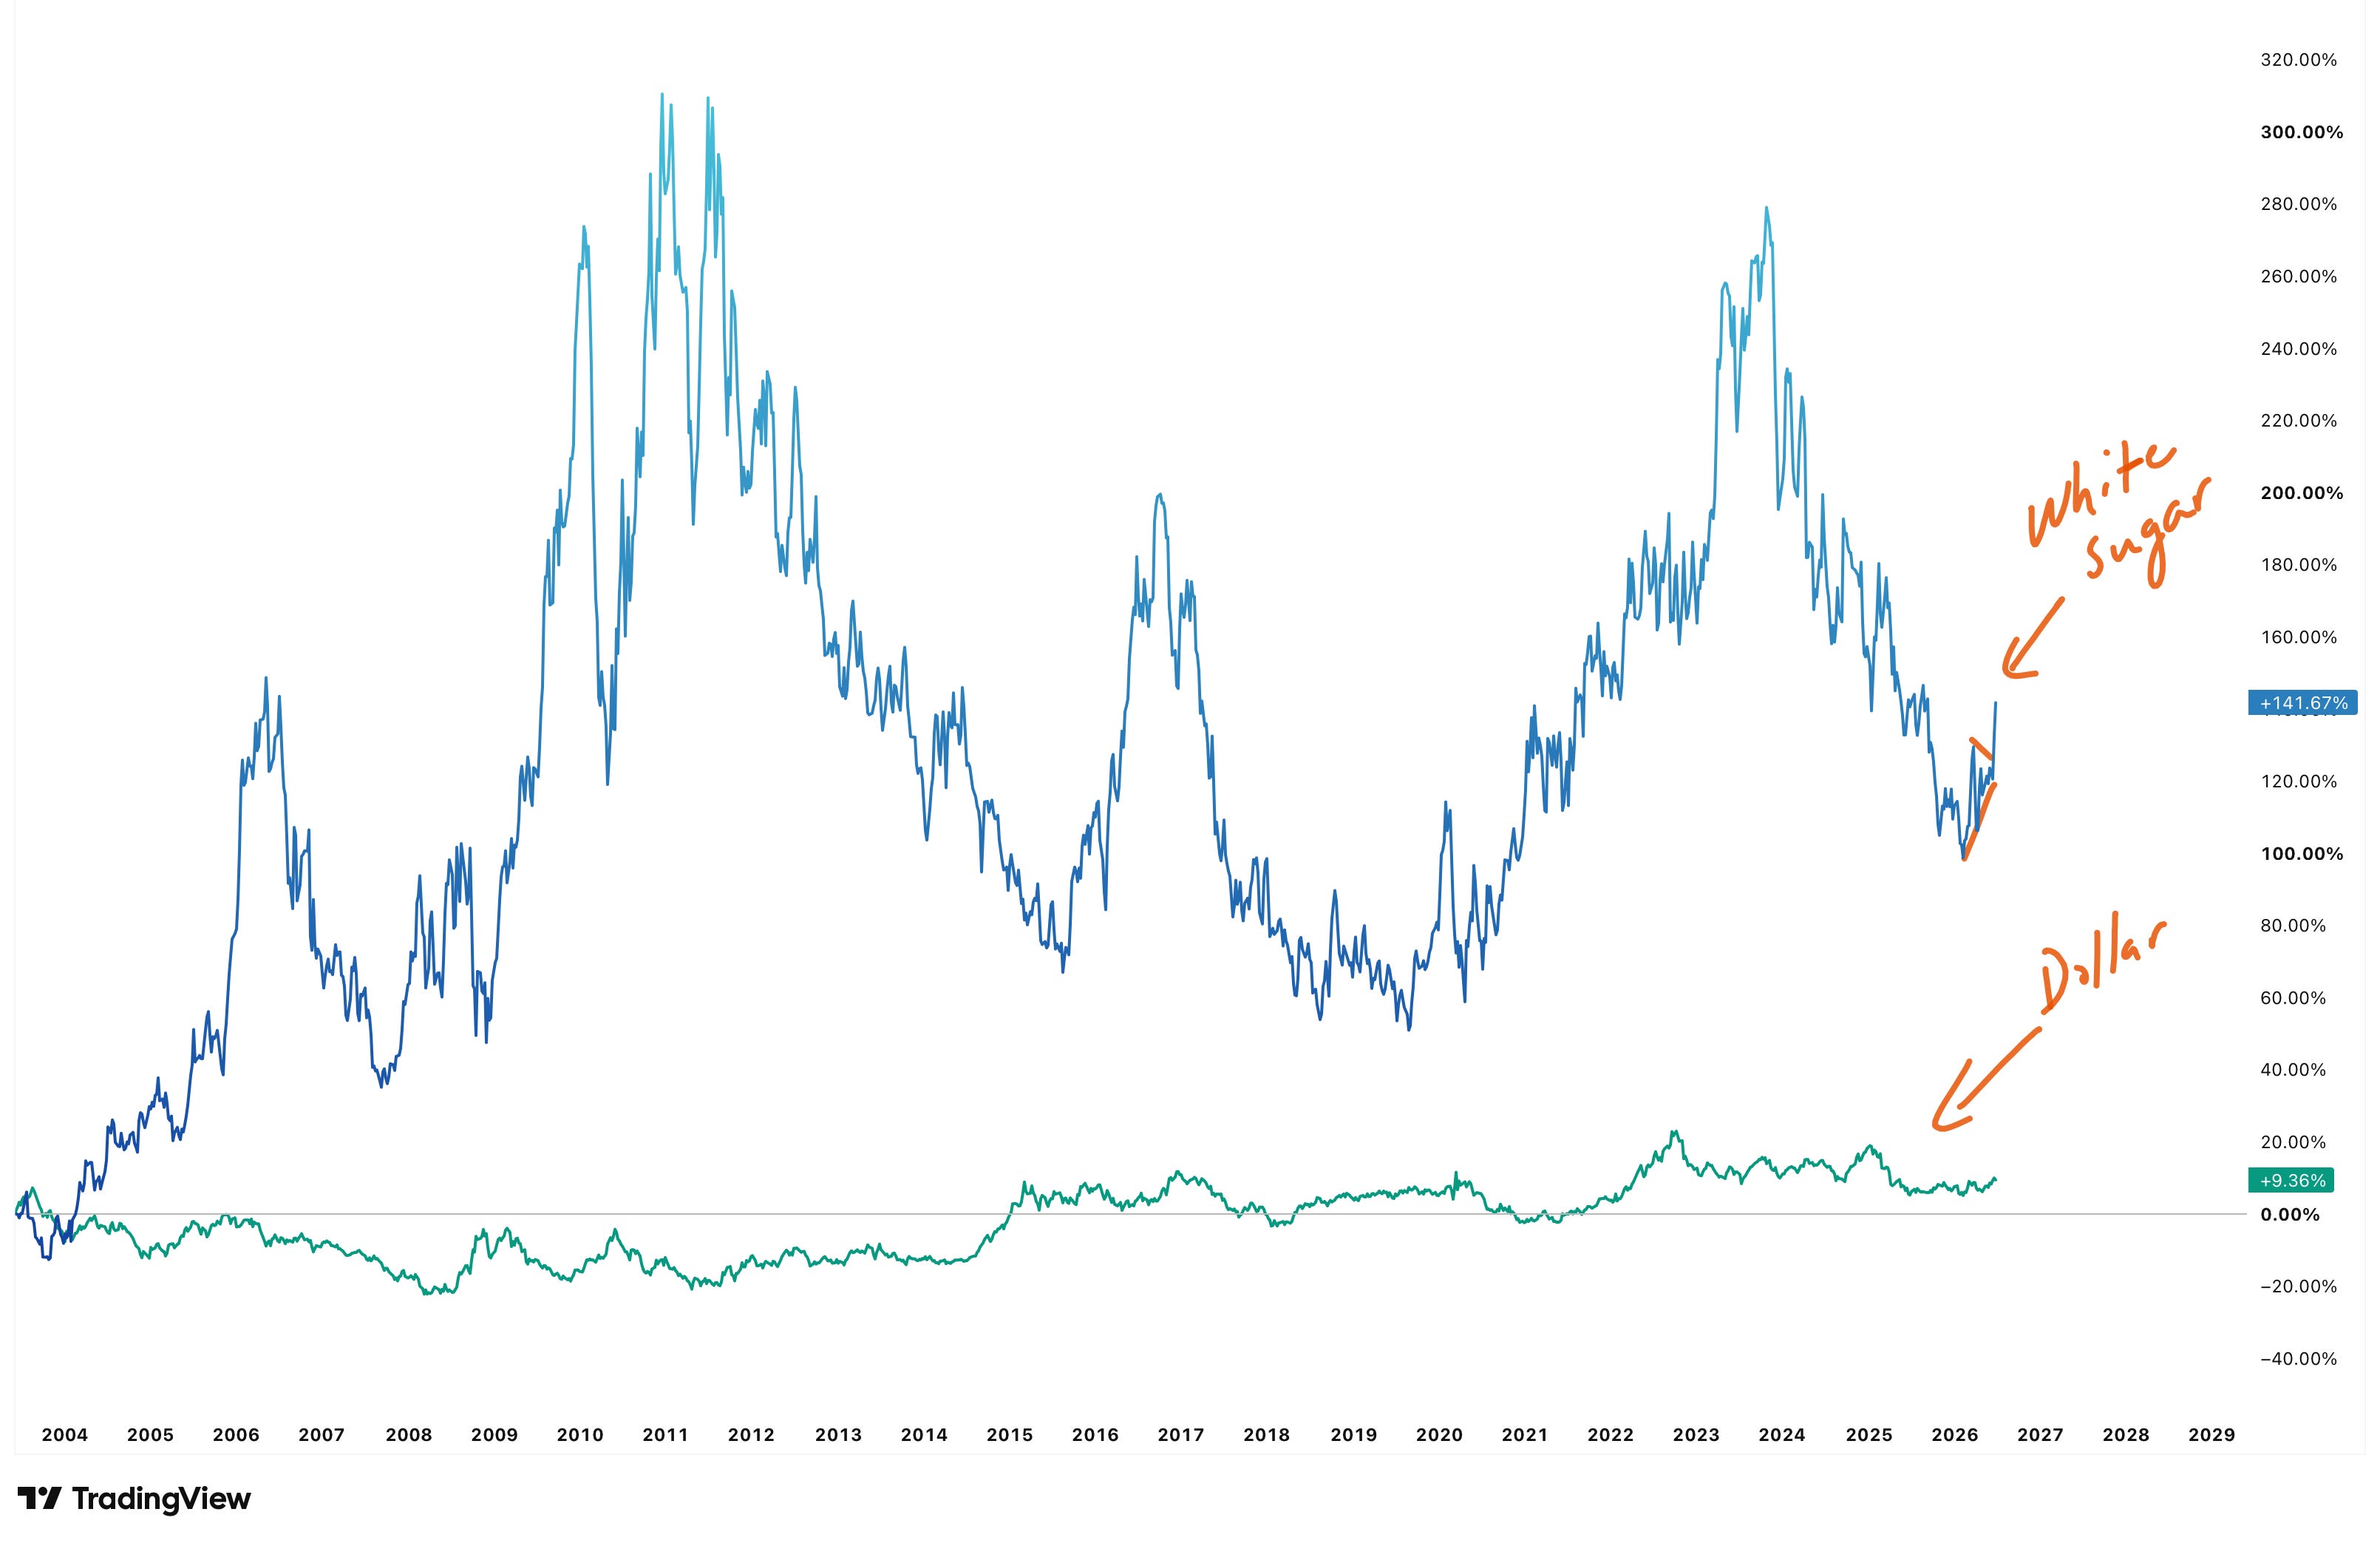
This futures position is large enough and uncorrelated enough to offset the volatility we’ve recently experienced in our emerging market stock positions, energy positions, and so on. This sweet market even seems uncorrelated to the dollar.
Here’s white sugar futures and the dollar index DXY on the same % scale chart — I’m not seeing a strong correlation here:
My point is not that you should buy white sugar futures - I have no idea where price will go from here. Uncertainty is a given. So we build it into our process. We find trends where the majority of traders are clearly voting in one direction. And then we add leverage by trading correlated assets in small size. Like a spider spinning a wide web - we identify sectors likely to outperform and spin systematic silk designed to catch outliers.
Up to a point. And then, when weakness emerges in these previously strong sectors, we don’t panic and exit — we find uncorrelated assets that remain compatible with our overall macro outlook. We repair and modify our web. We remain open to a change in the environment.
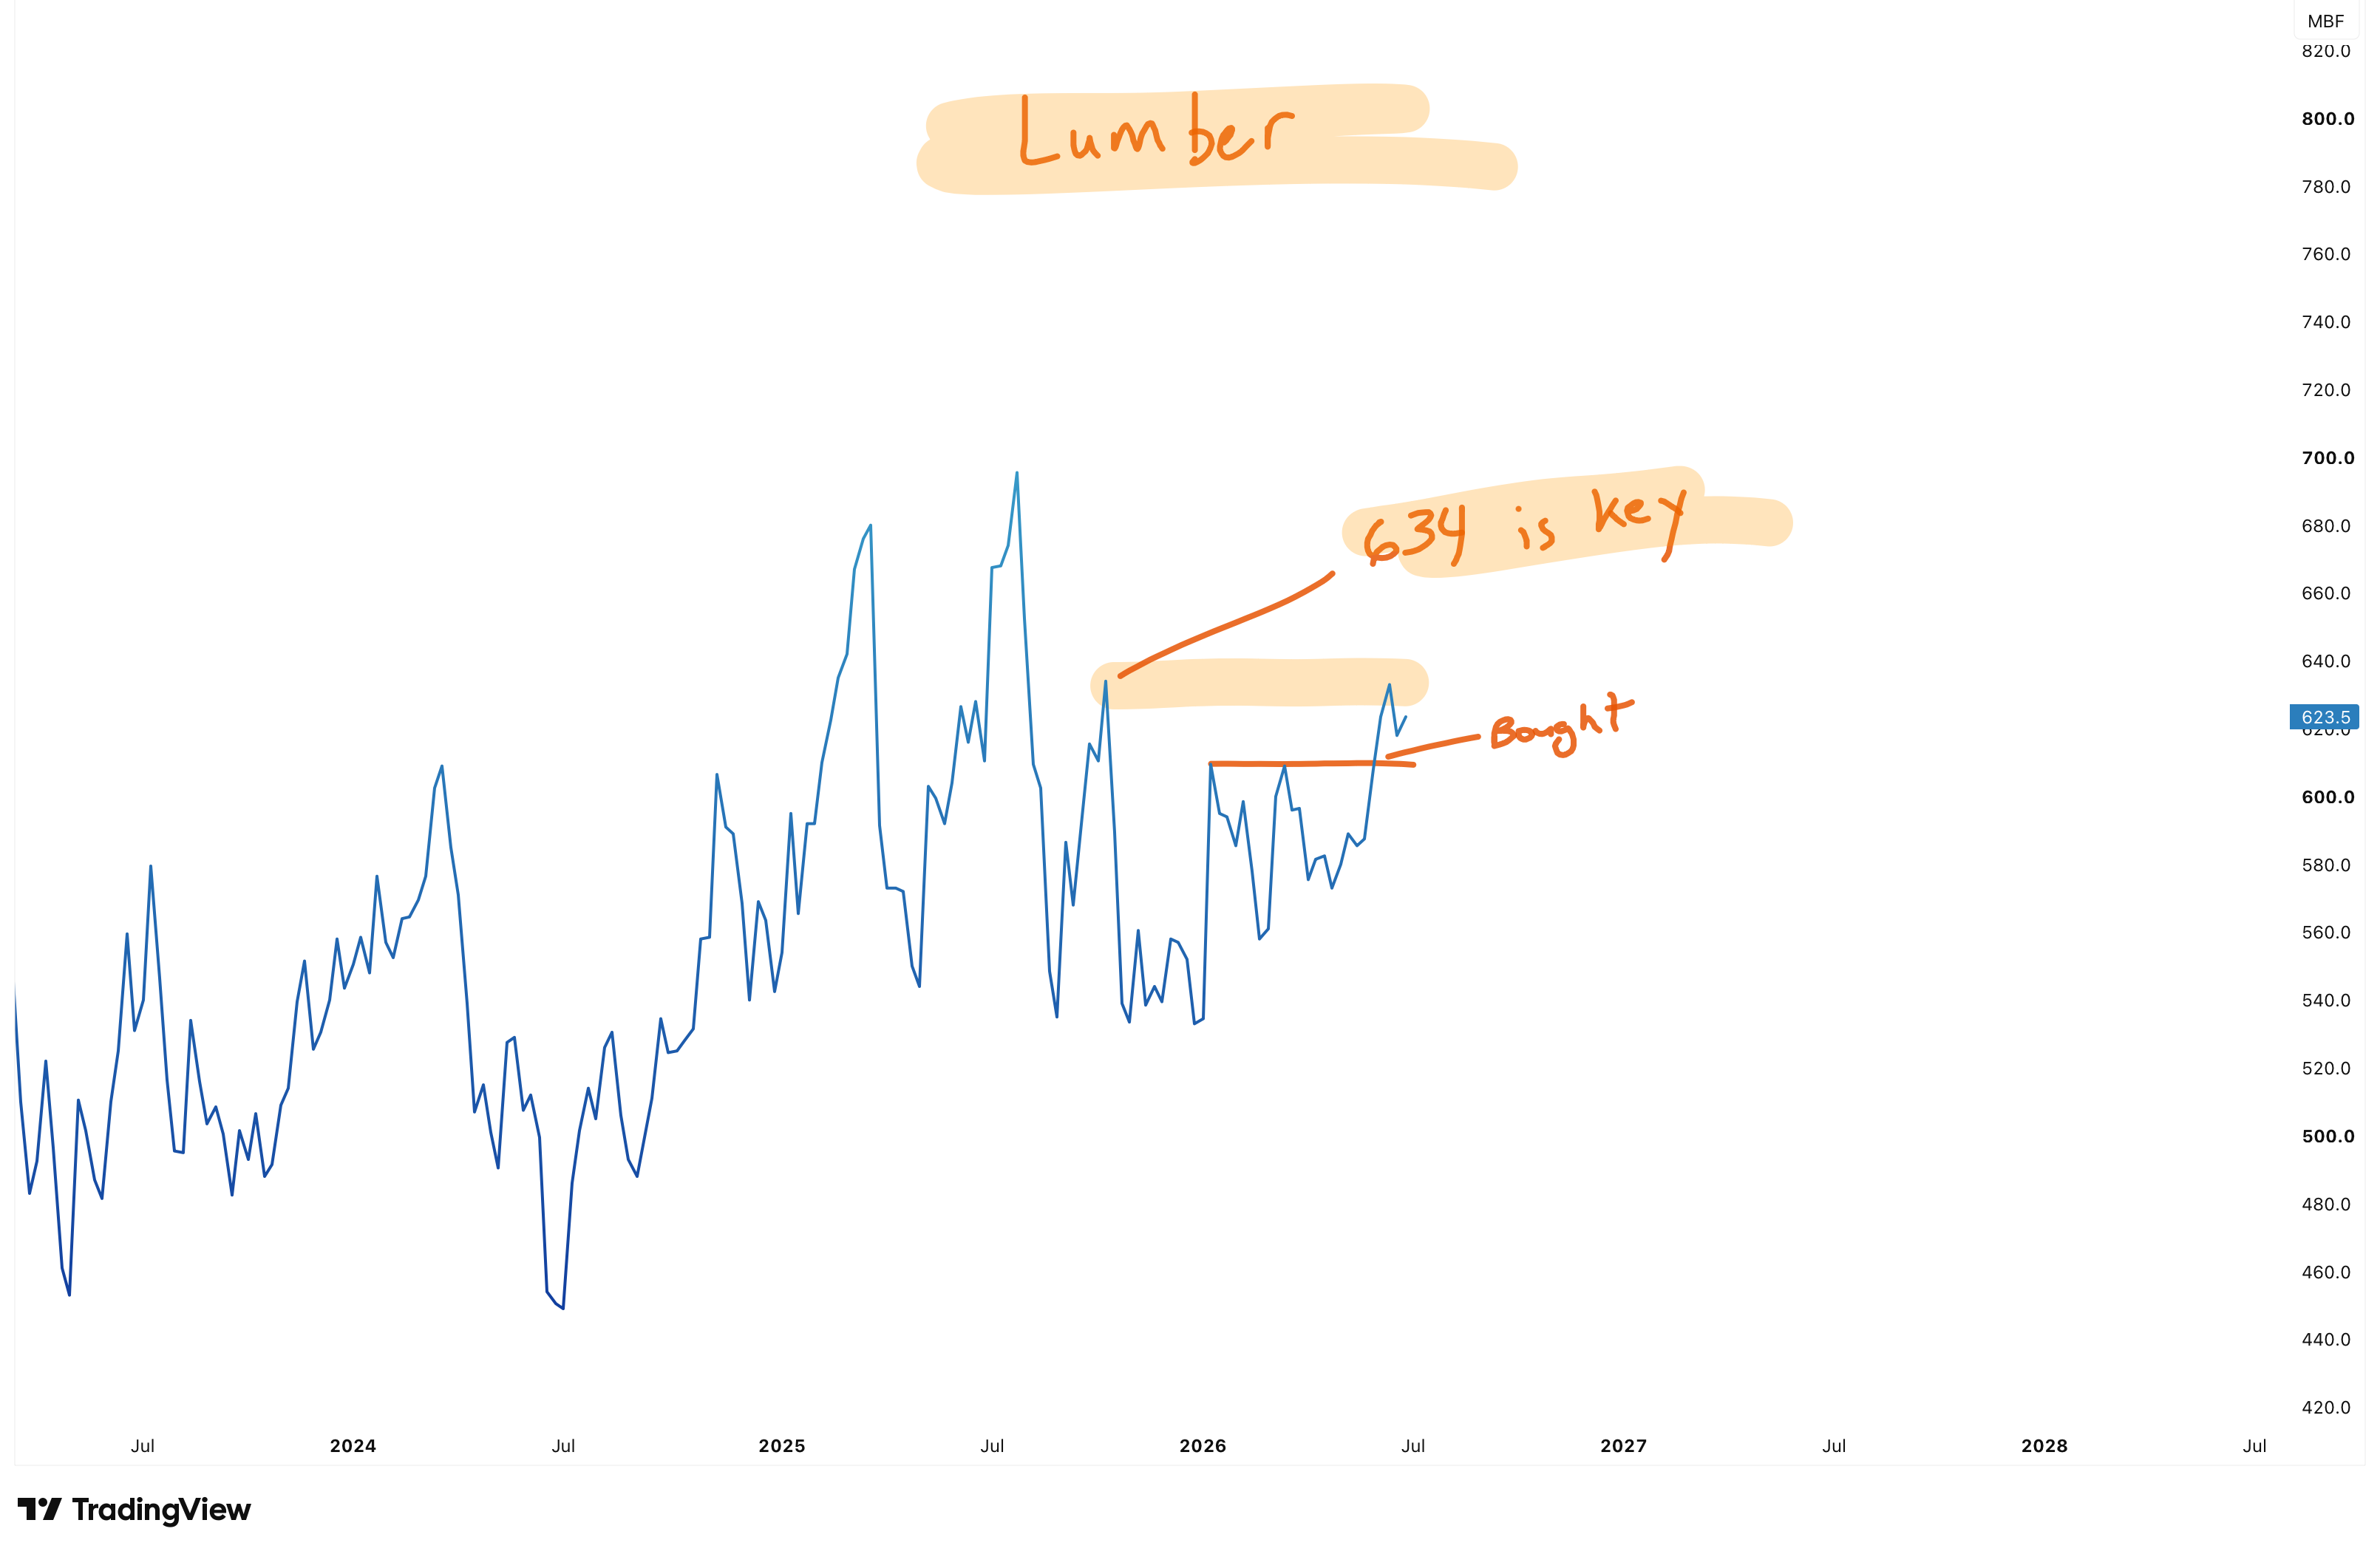
The entire sector of soft commodities is heating up and looking ready to move higher. I can’t trade cocoa and coffee contracts - they’re still too big for my account size to allow me to have 20-30% trailing stops and ride those volatile trends. But I can trade lumber, and that is still looking constructive. We bought, and now we need to see confirmation of trend with a weekly close above that 634 level.
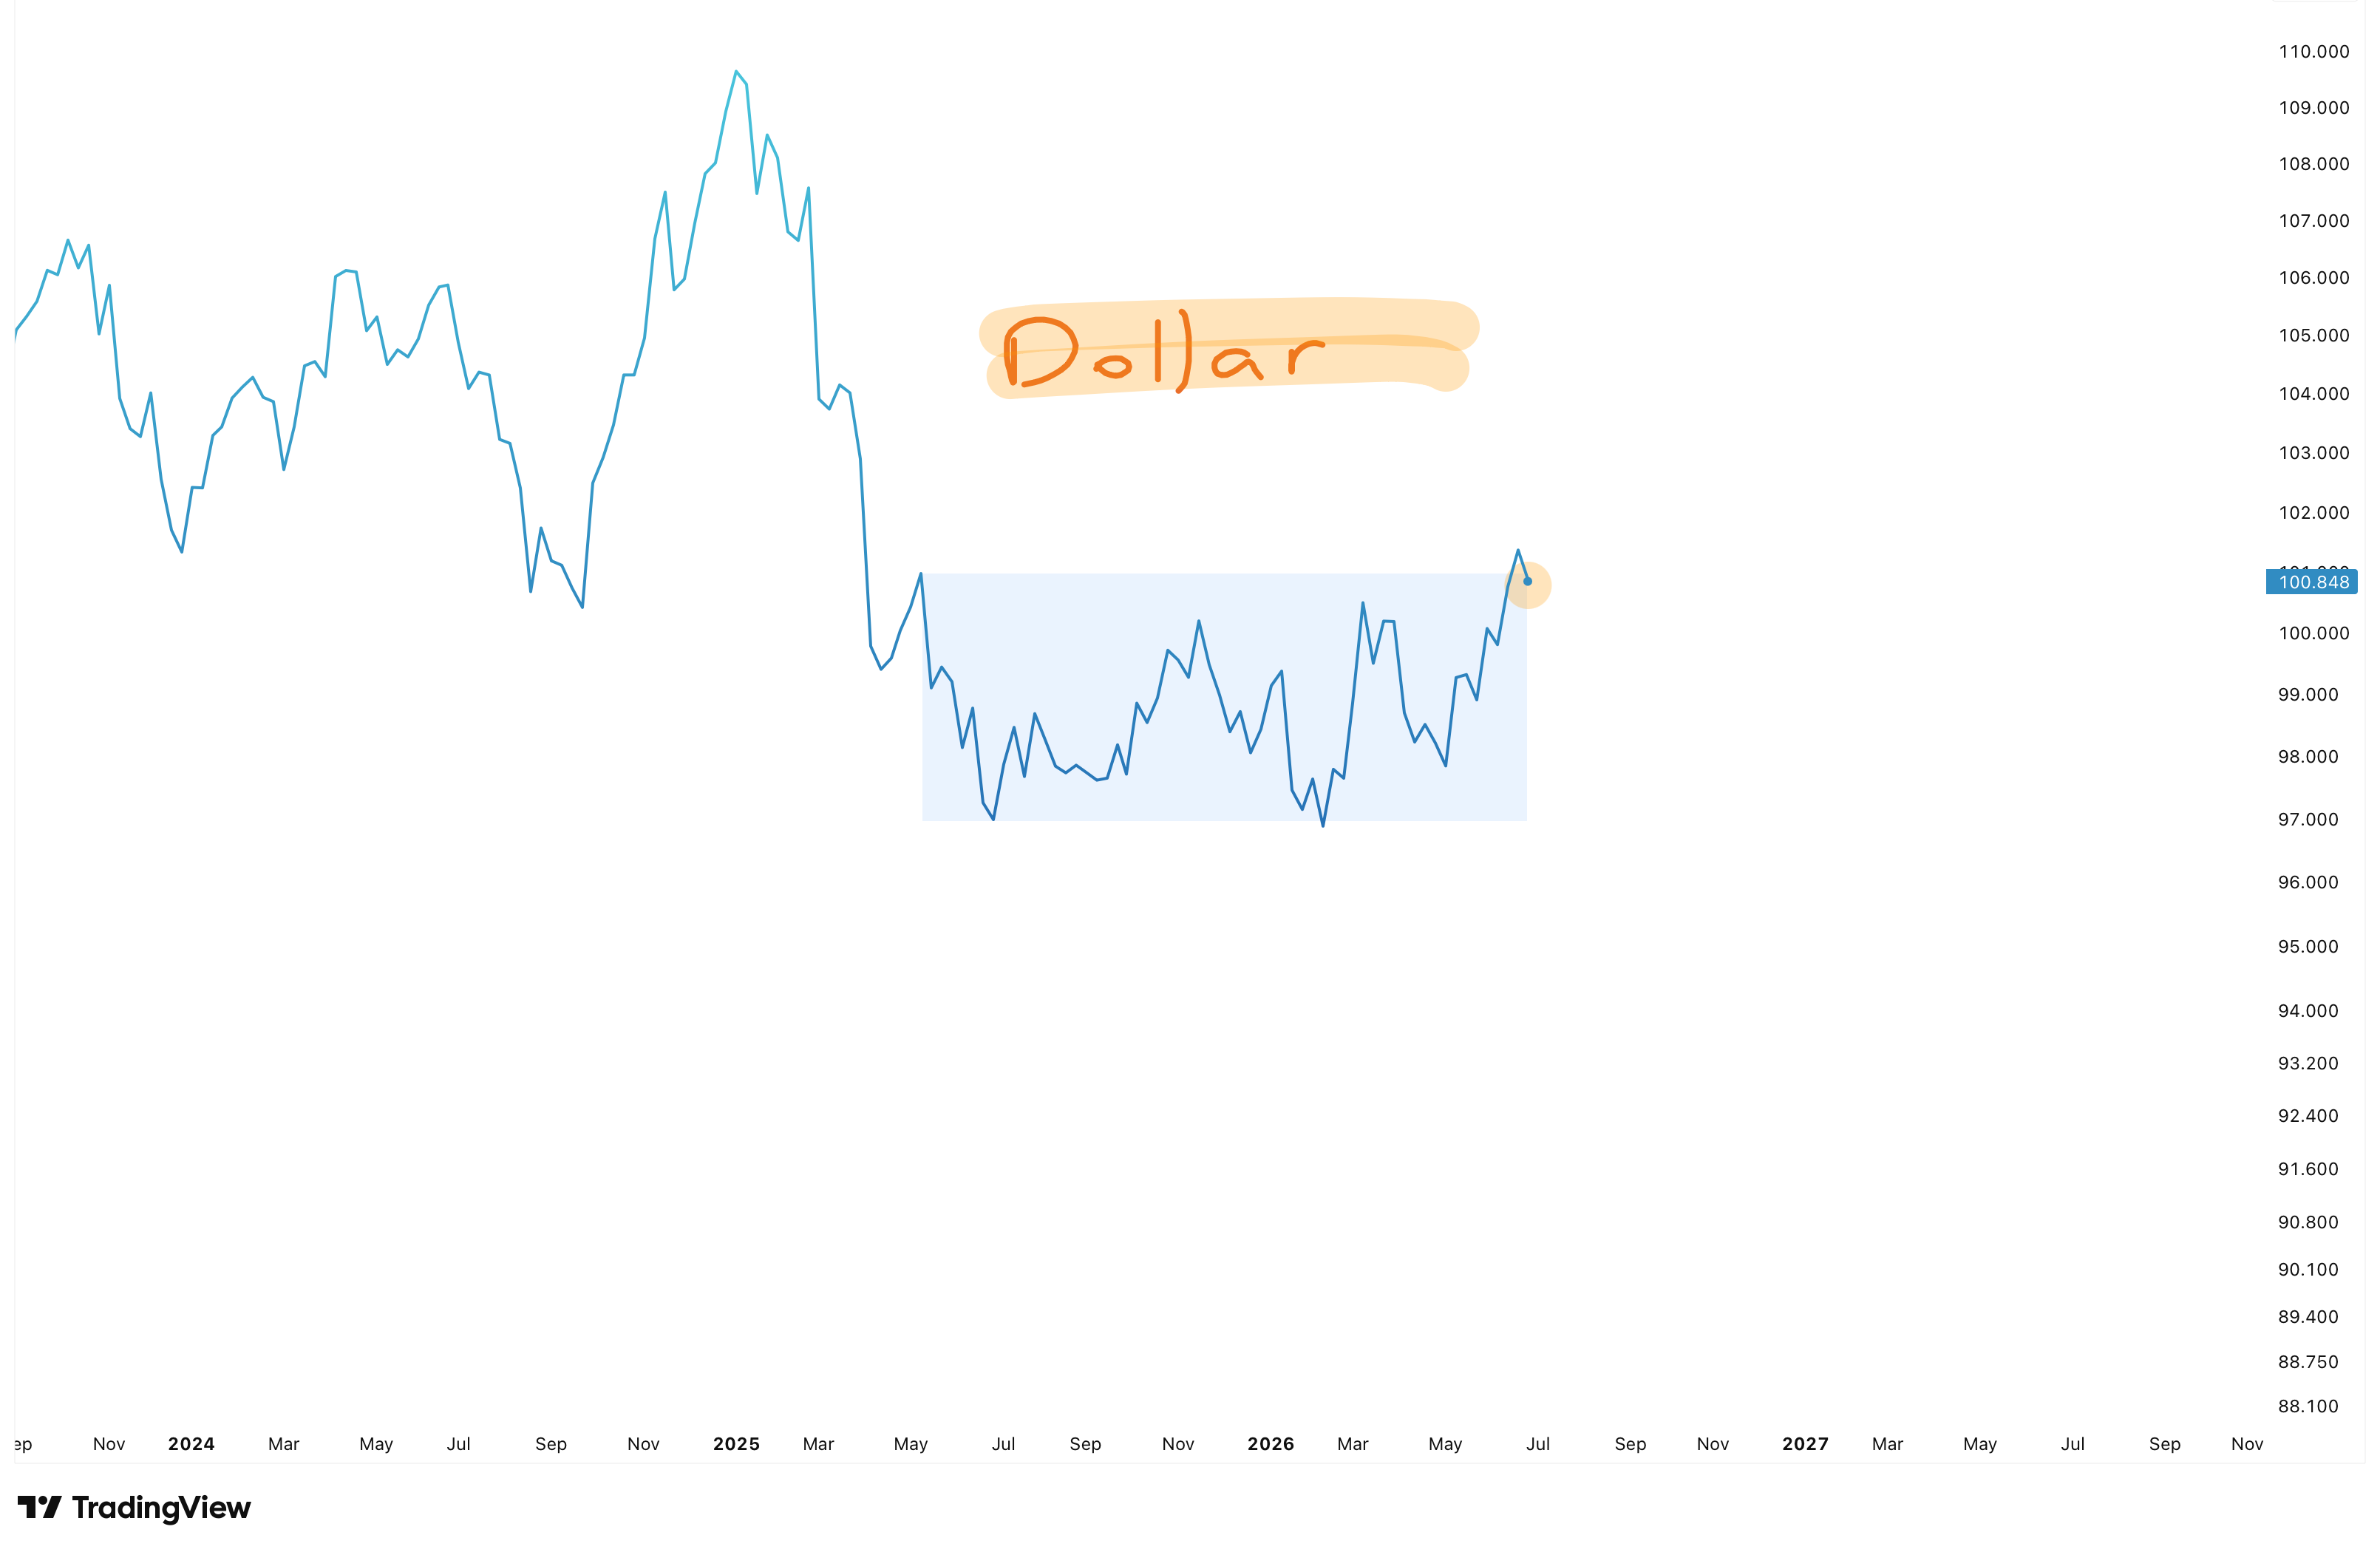
I think lumber is likely to move higher, now that the dollar seems to be rolling back into poopy chop land:
I also like a couple of uncharacteristic sectors right now. Sectors I kinda hate, but will trade anyway. I don’t have positions yet - but these are on watch, and I’m ready to buy.
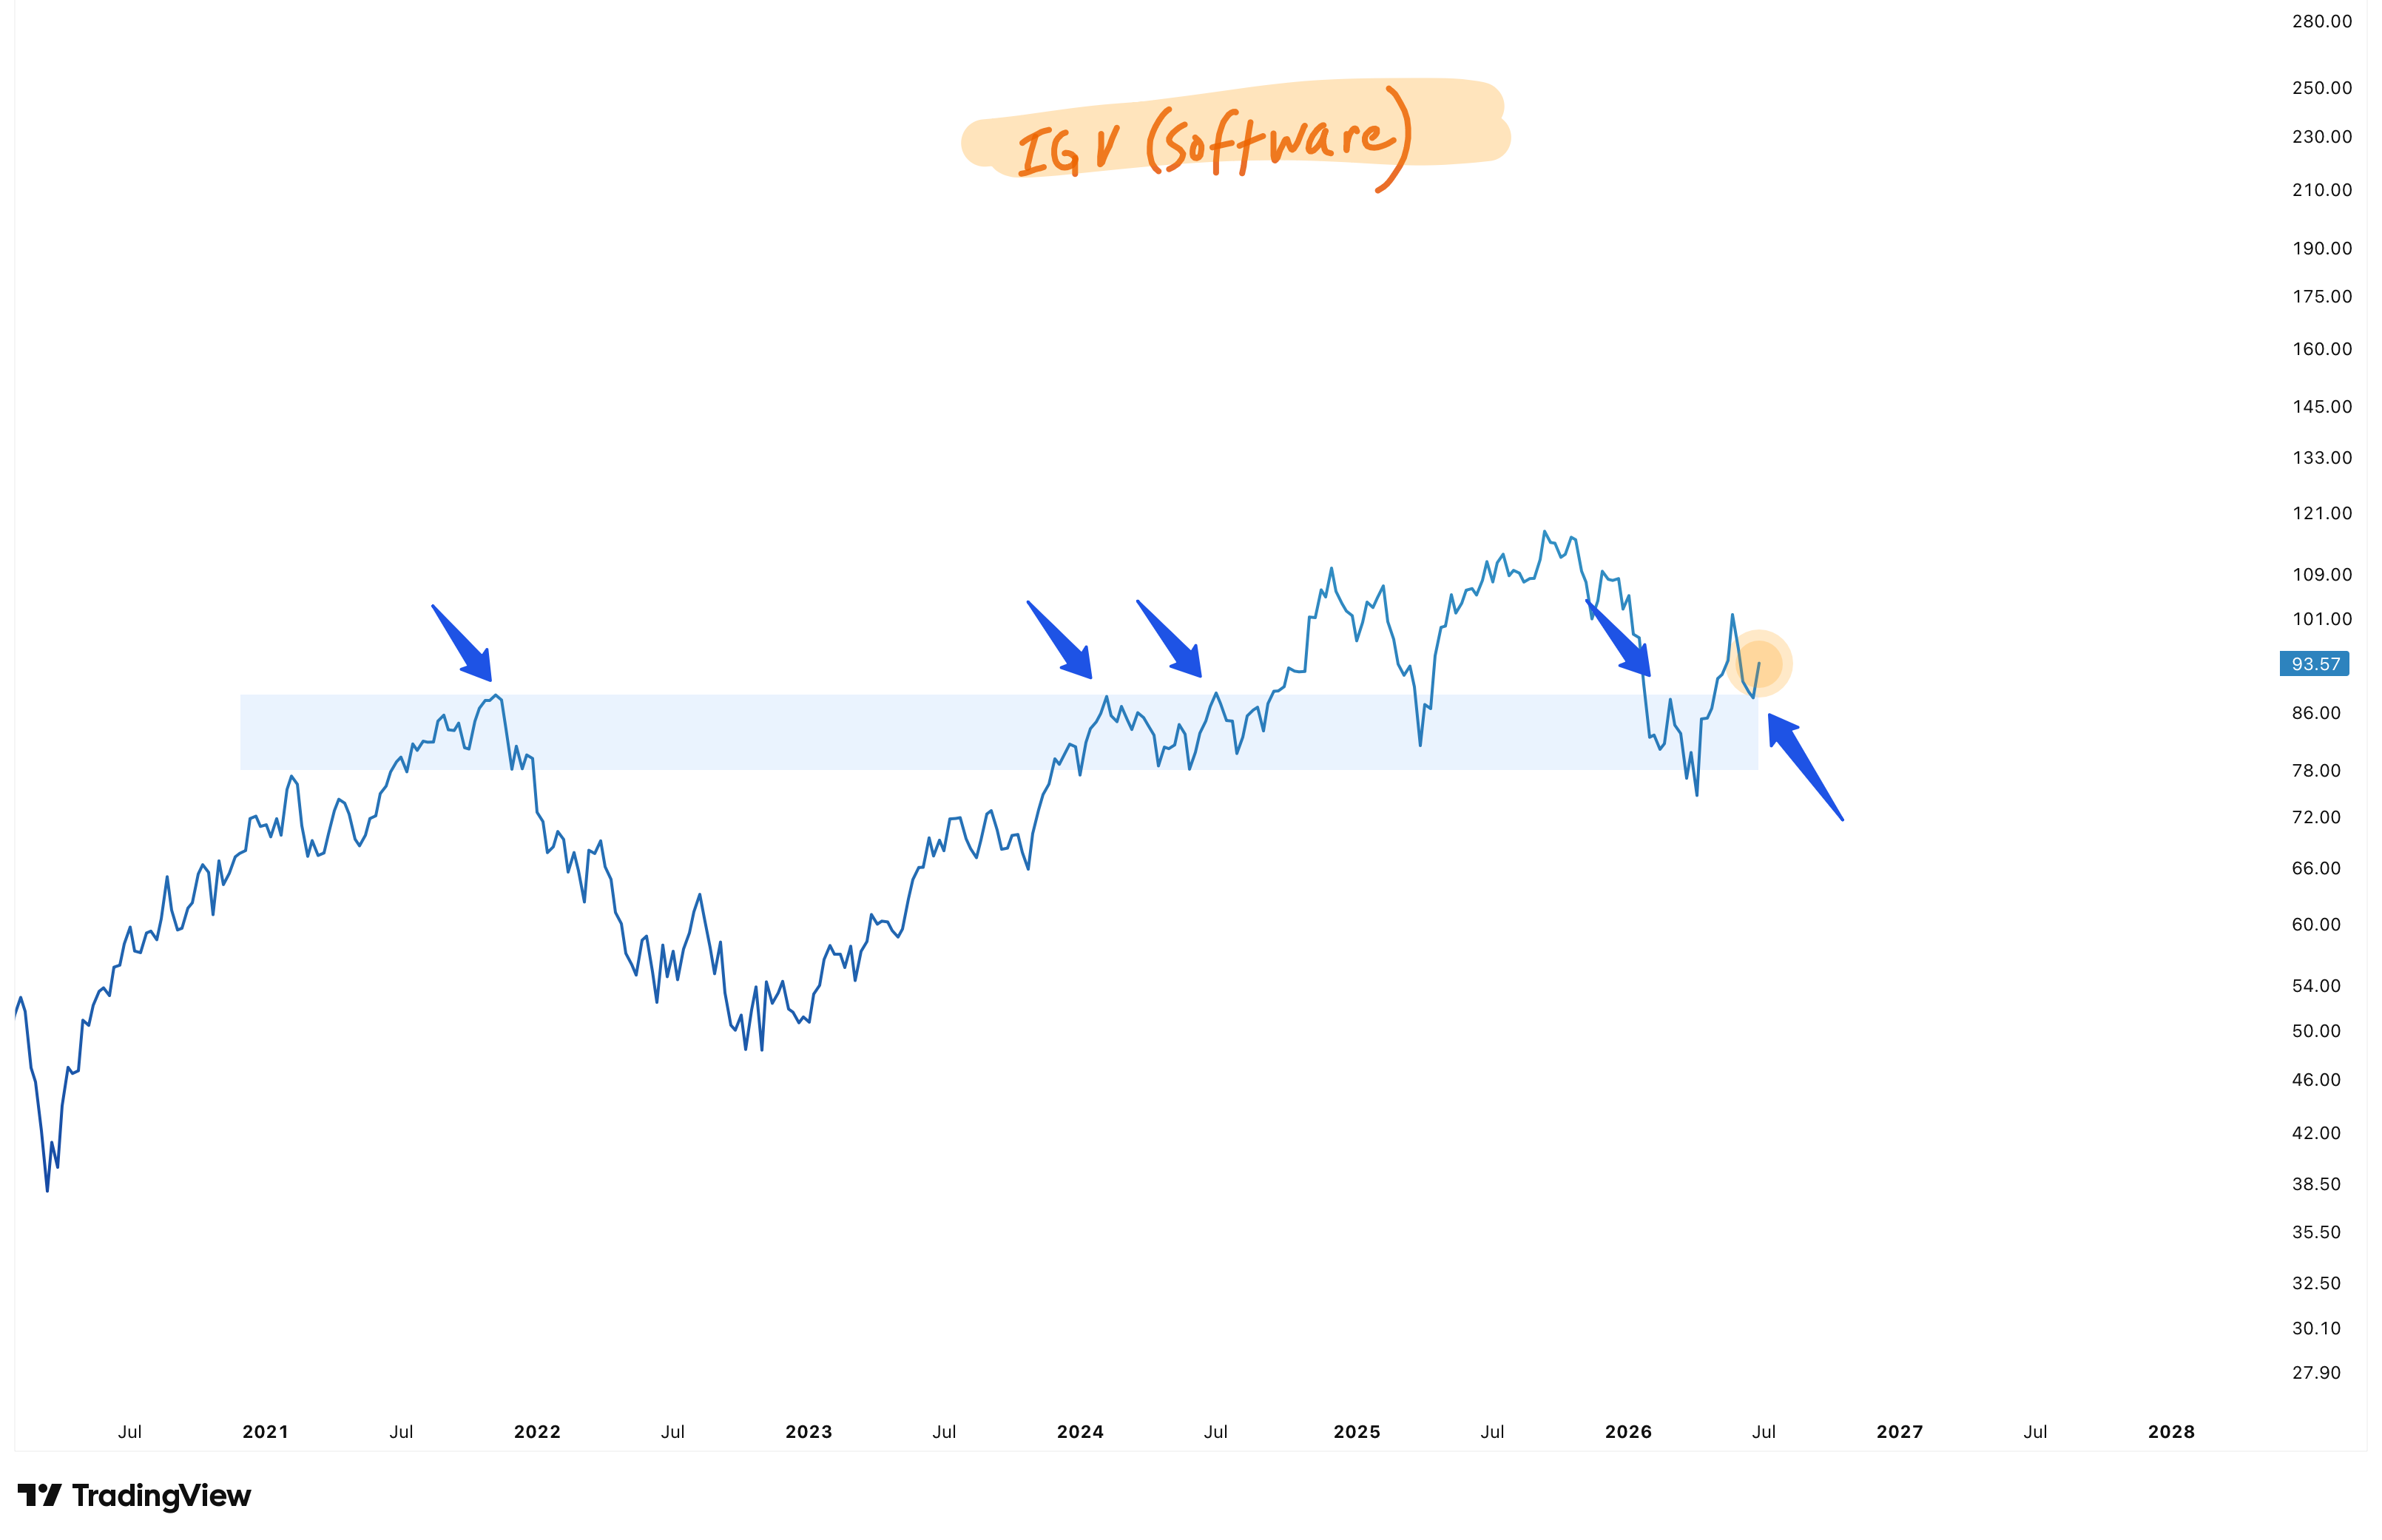
For the swing account, software looks like a beautiful false breakdown - you can see the arrows I’ve drawn showing what was resistance become support:
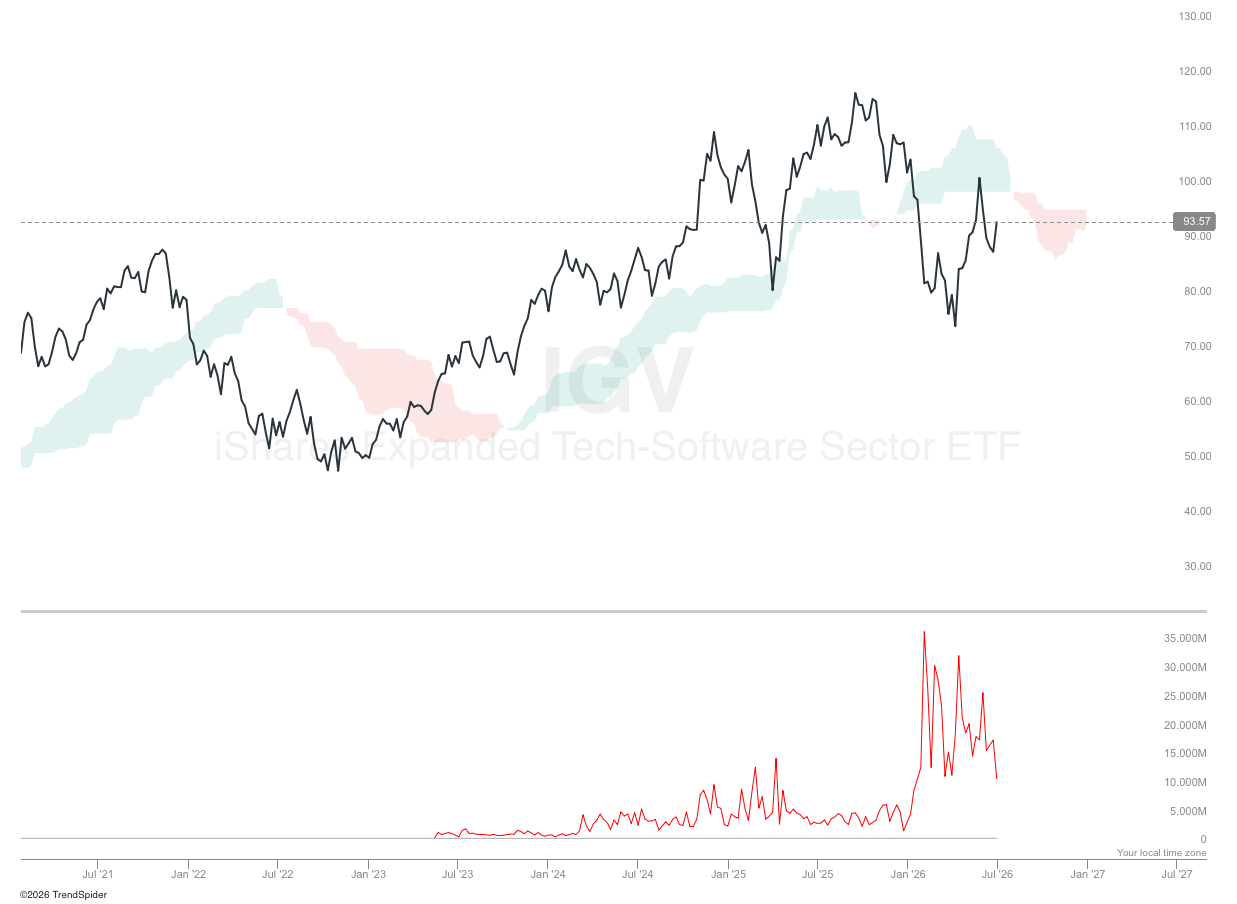
You can also see on this chart of software - that red line at bottom below the price chart - showing the volume of short positions rolling over. This is short-sellers who bet on the death of software due to AI solving everything now running for the exits:
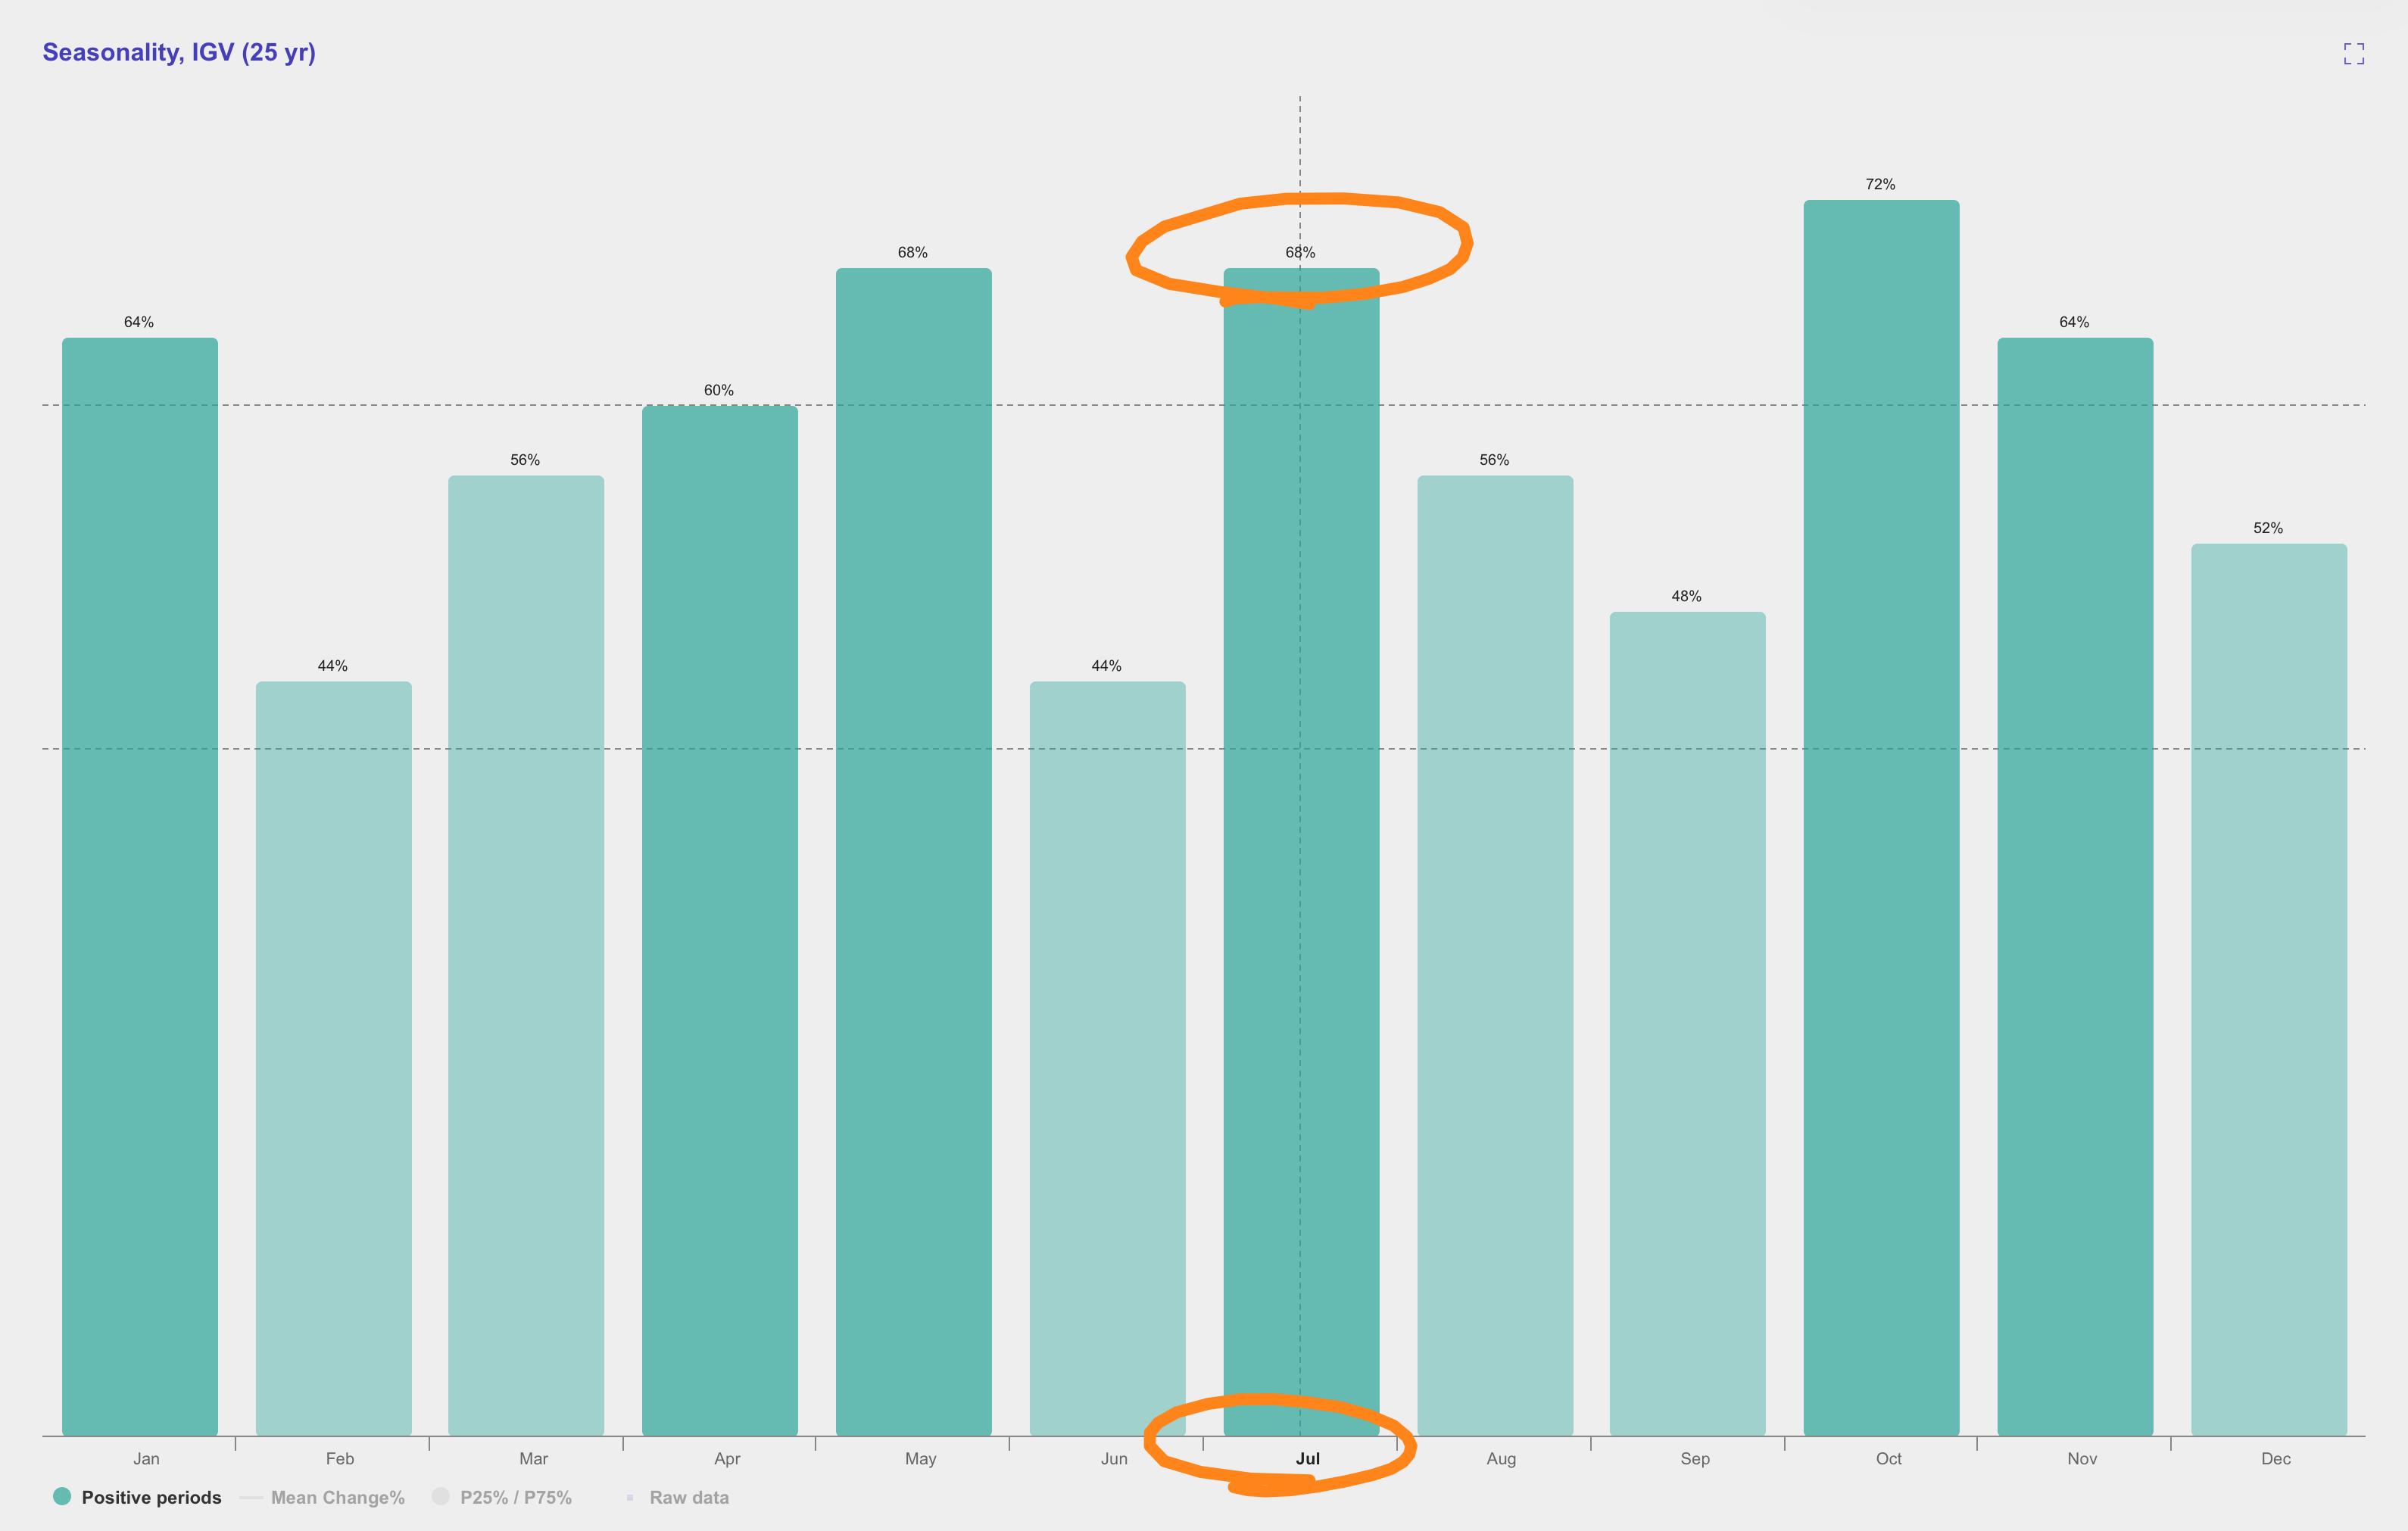
Seasonality for software shows that it has moved higher 68% of Julys over the last 25 years:
And then there’s big banks. You wanna hug ‘em. Just so big and banky.
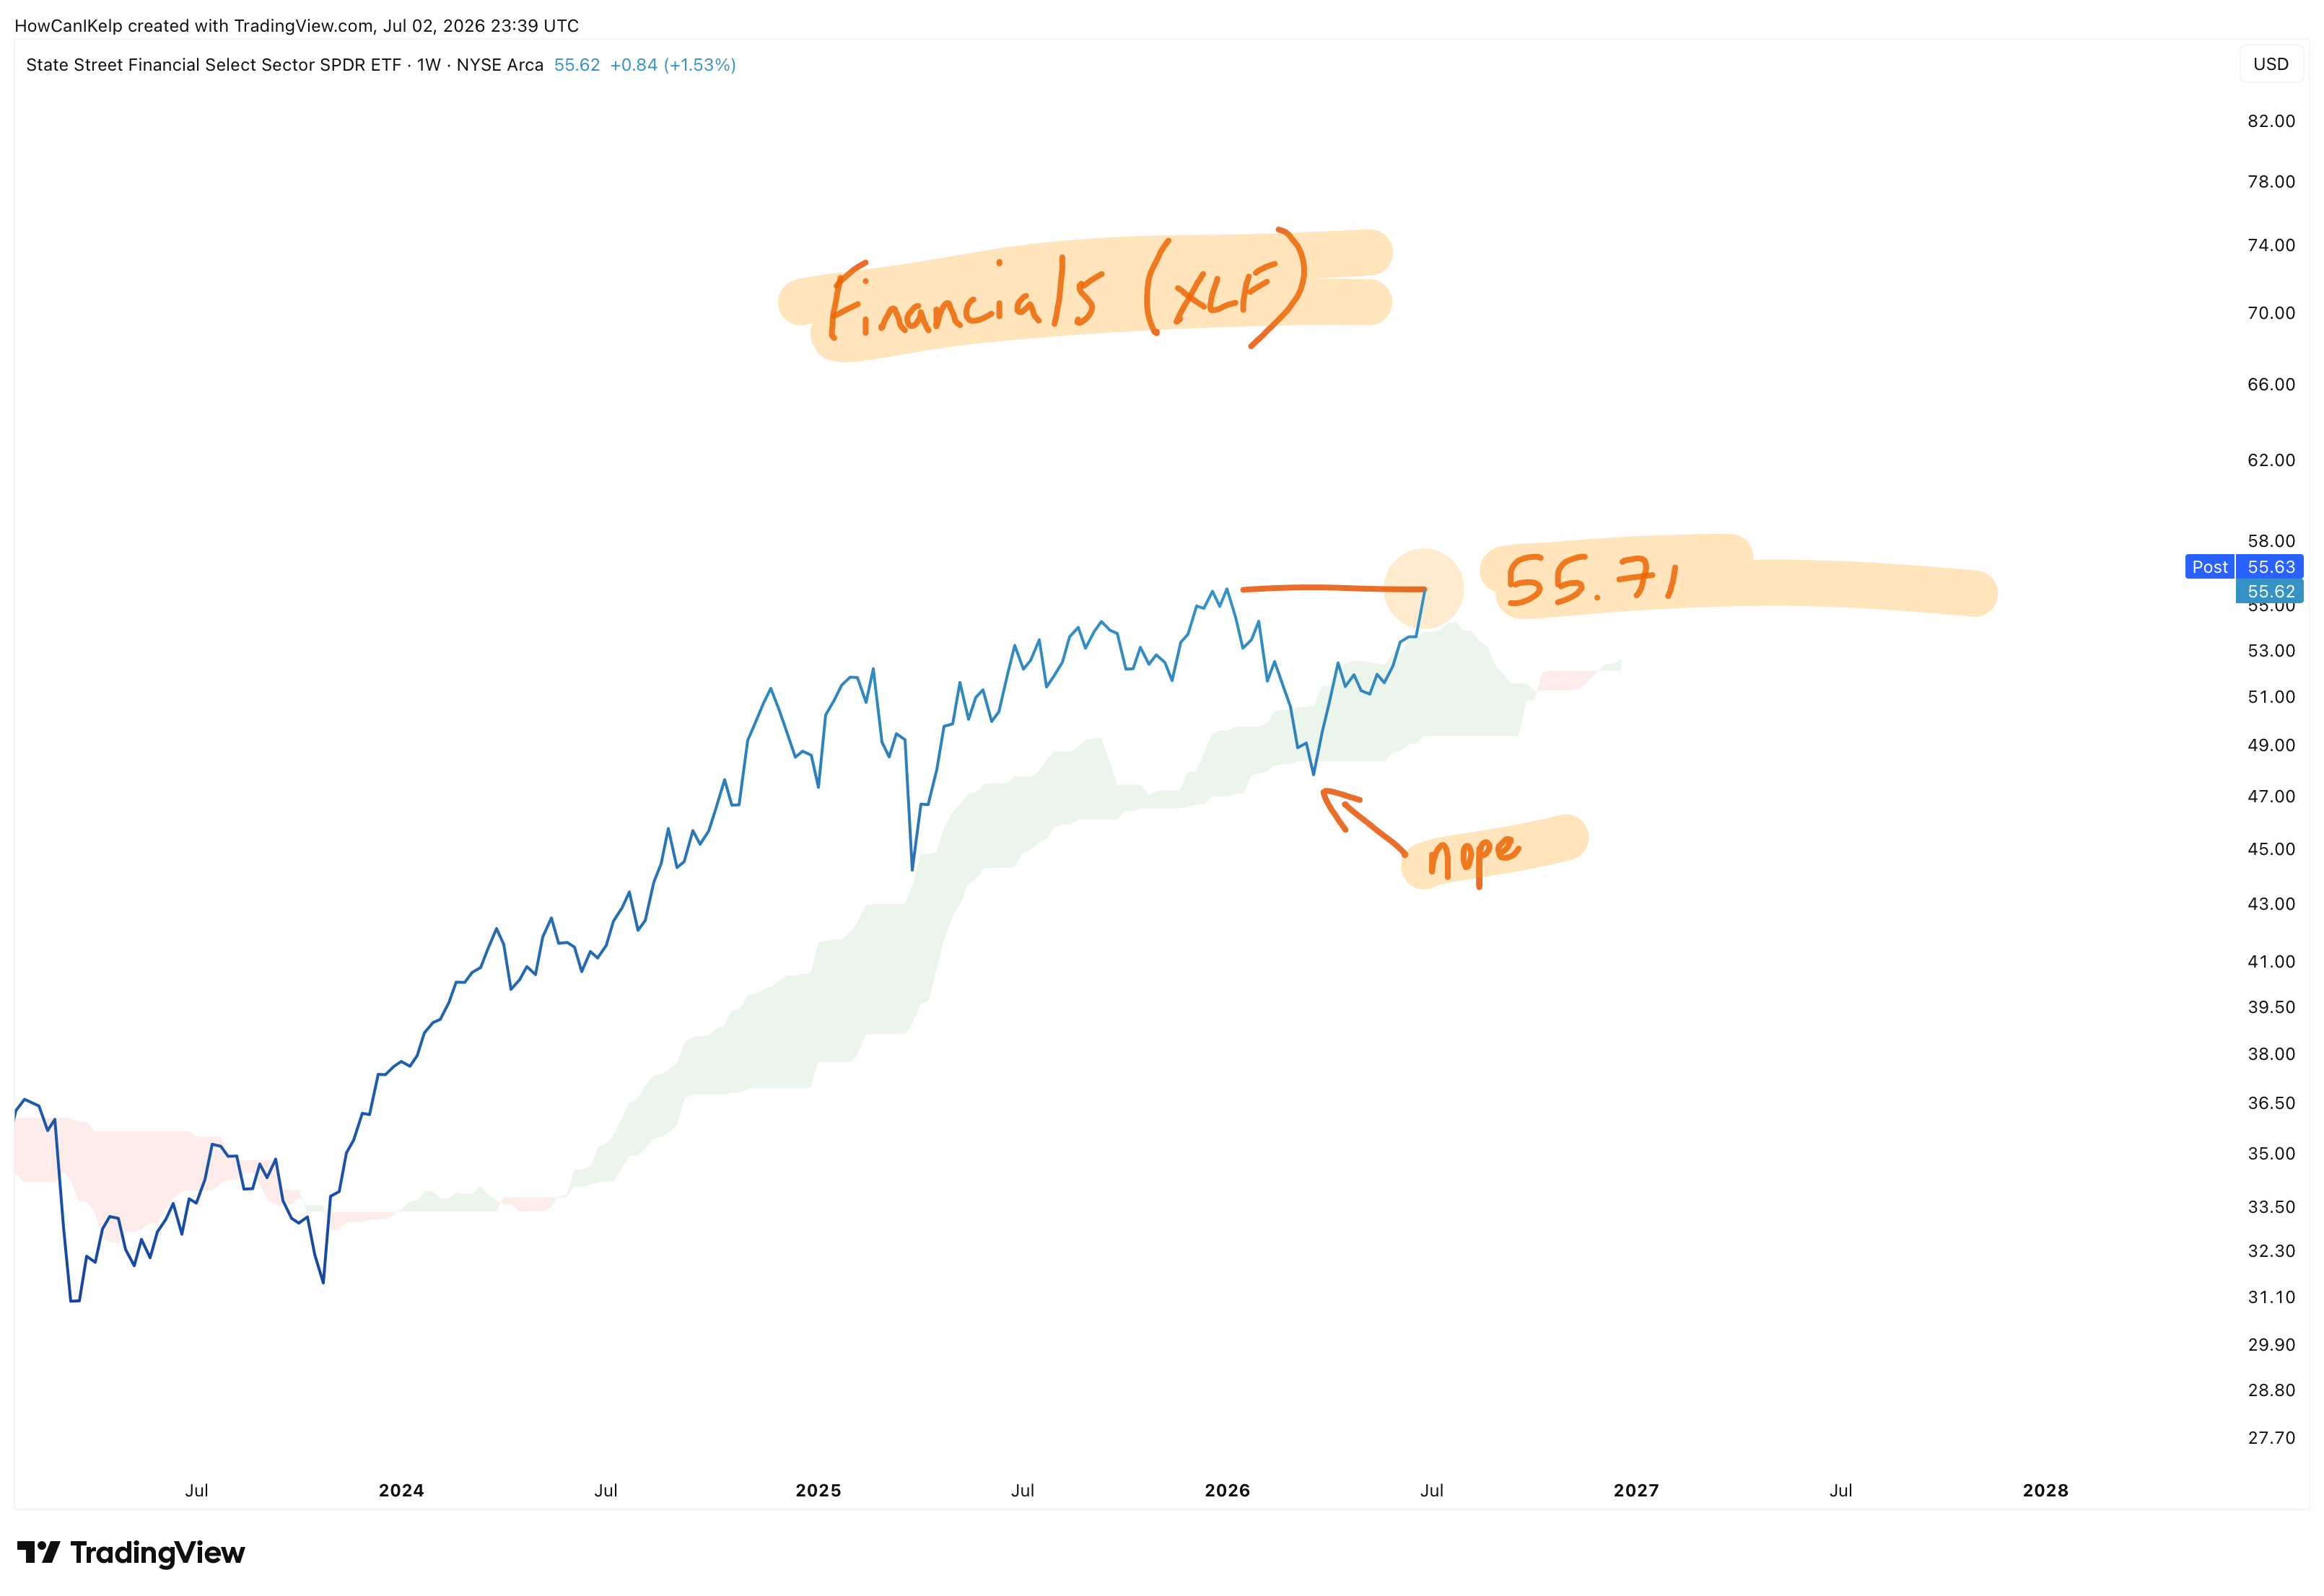
The financial sector ETF is a buy for our long term accounts with a weekly close above 55.71.
Price broke down below the cloud, and then the market said no. And now we say yes.
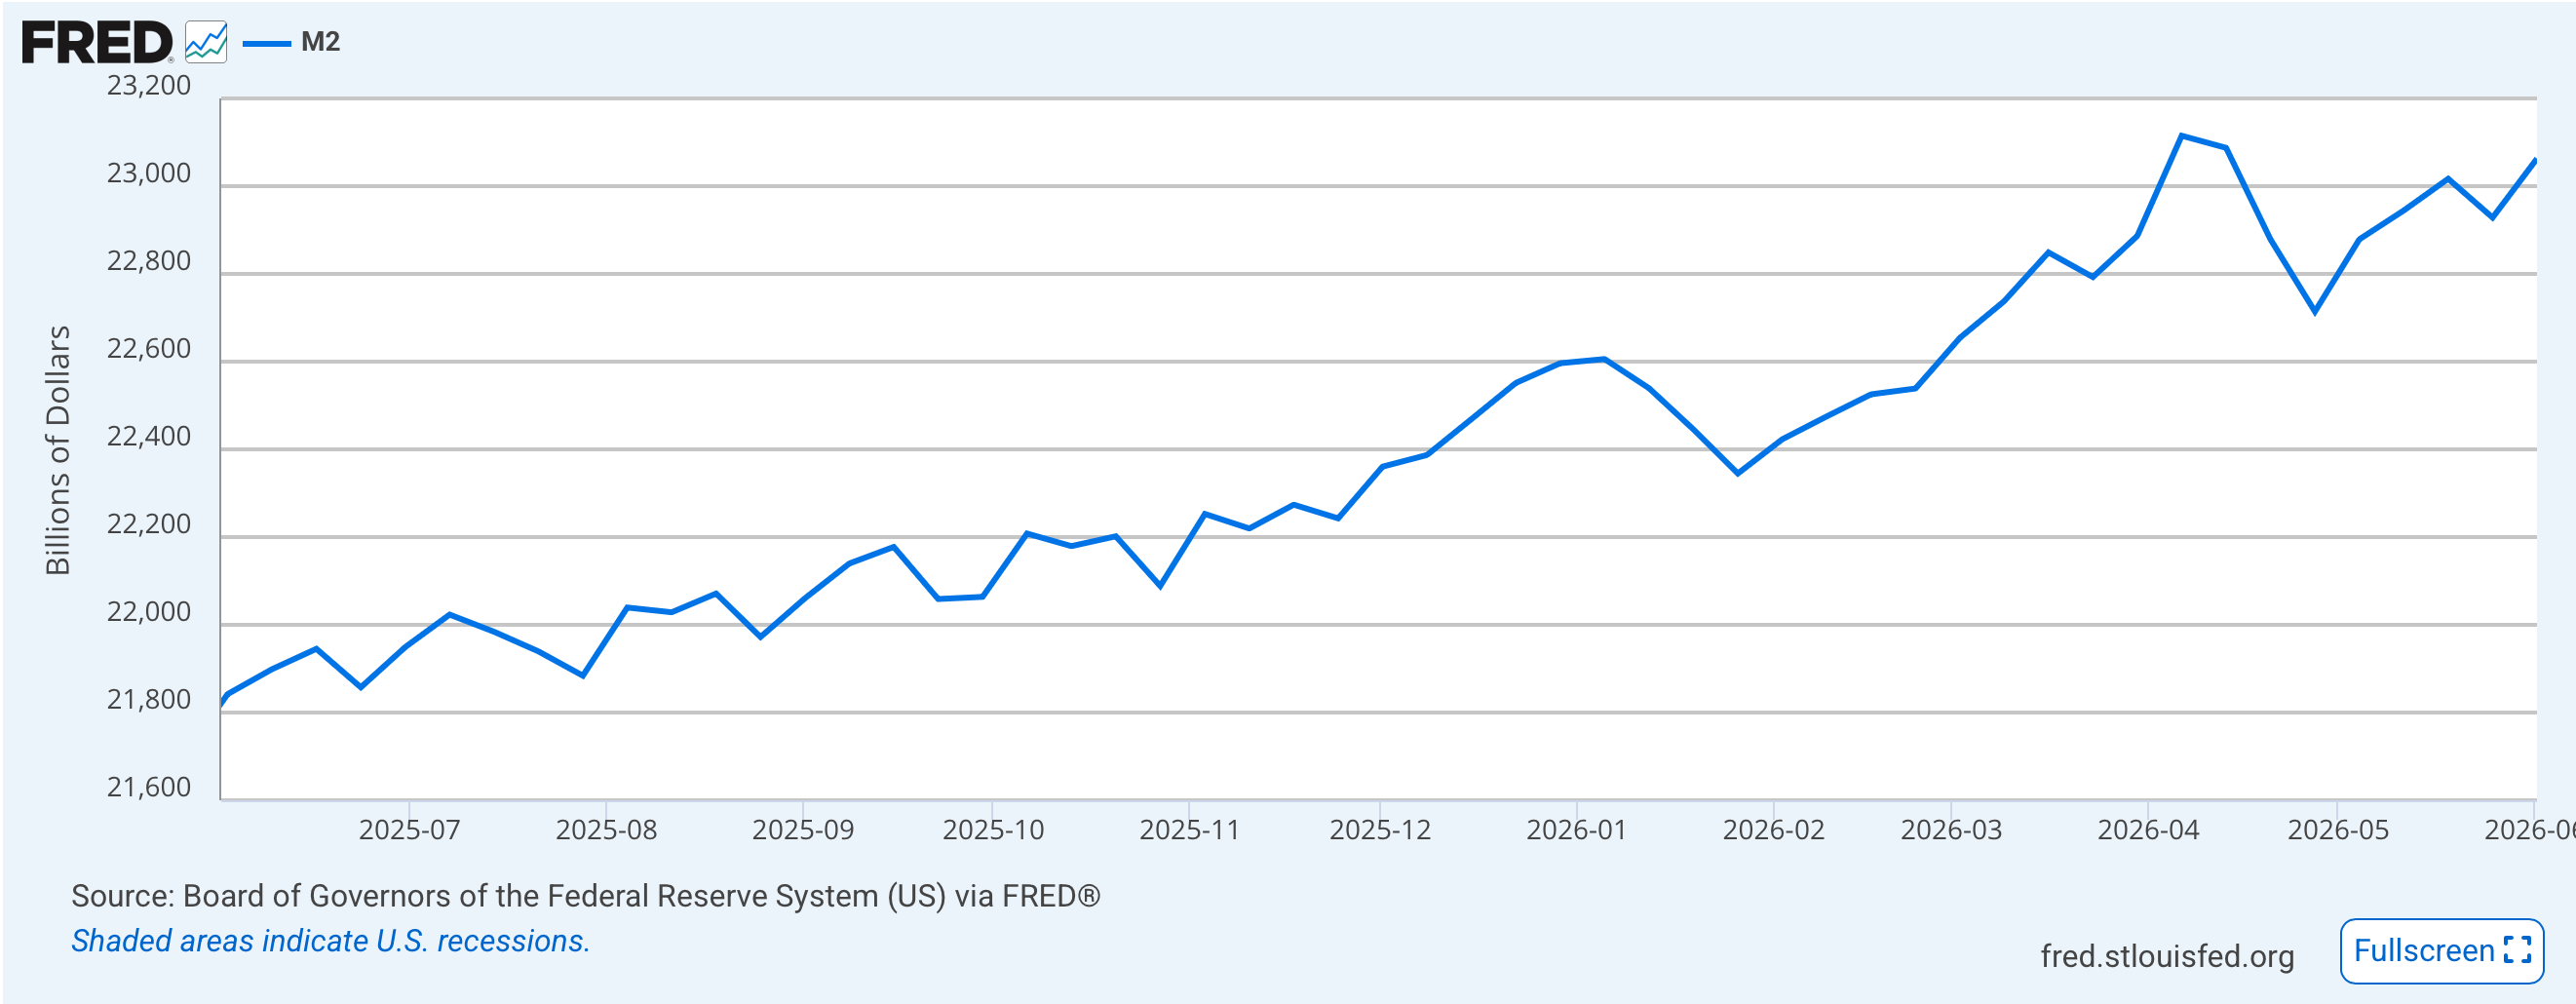
And oh my God do I see a lot of bearish shit on the tweeter out there right now - even from permabulls. I would not be surprised to see an air pocket or two this summer - sudden price drops that will test everyone’s nerve. The markets are so good at that. But how y’all gonna be monolithic-market-bearish when money supply is doing this:
Bears…

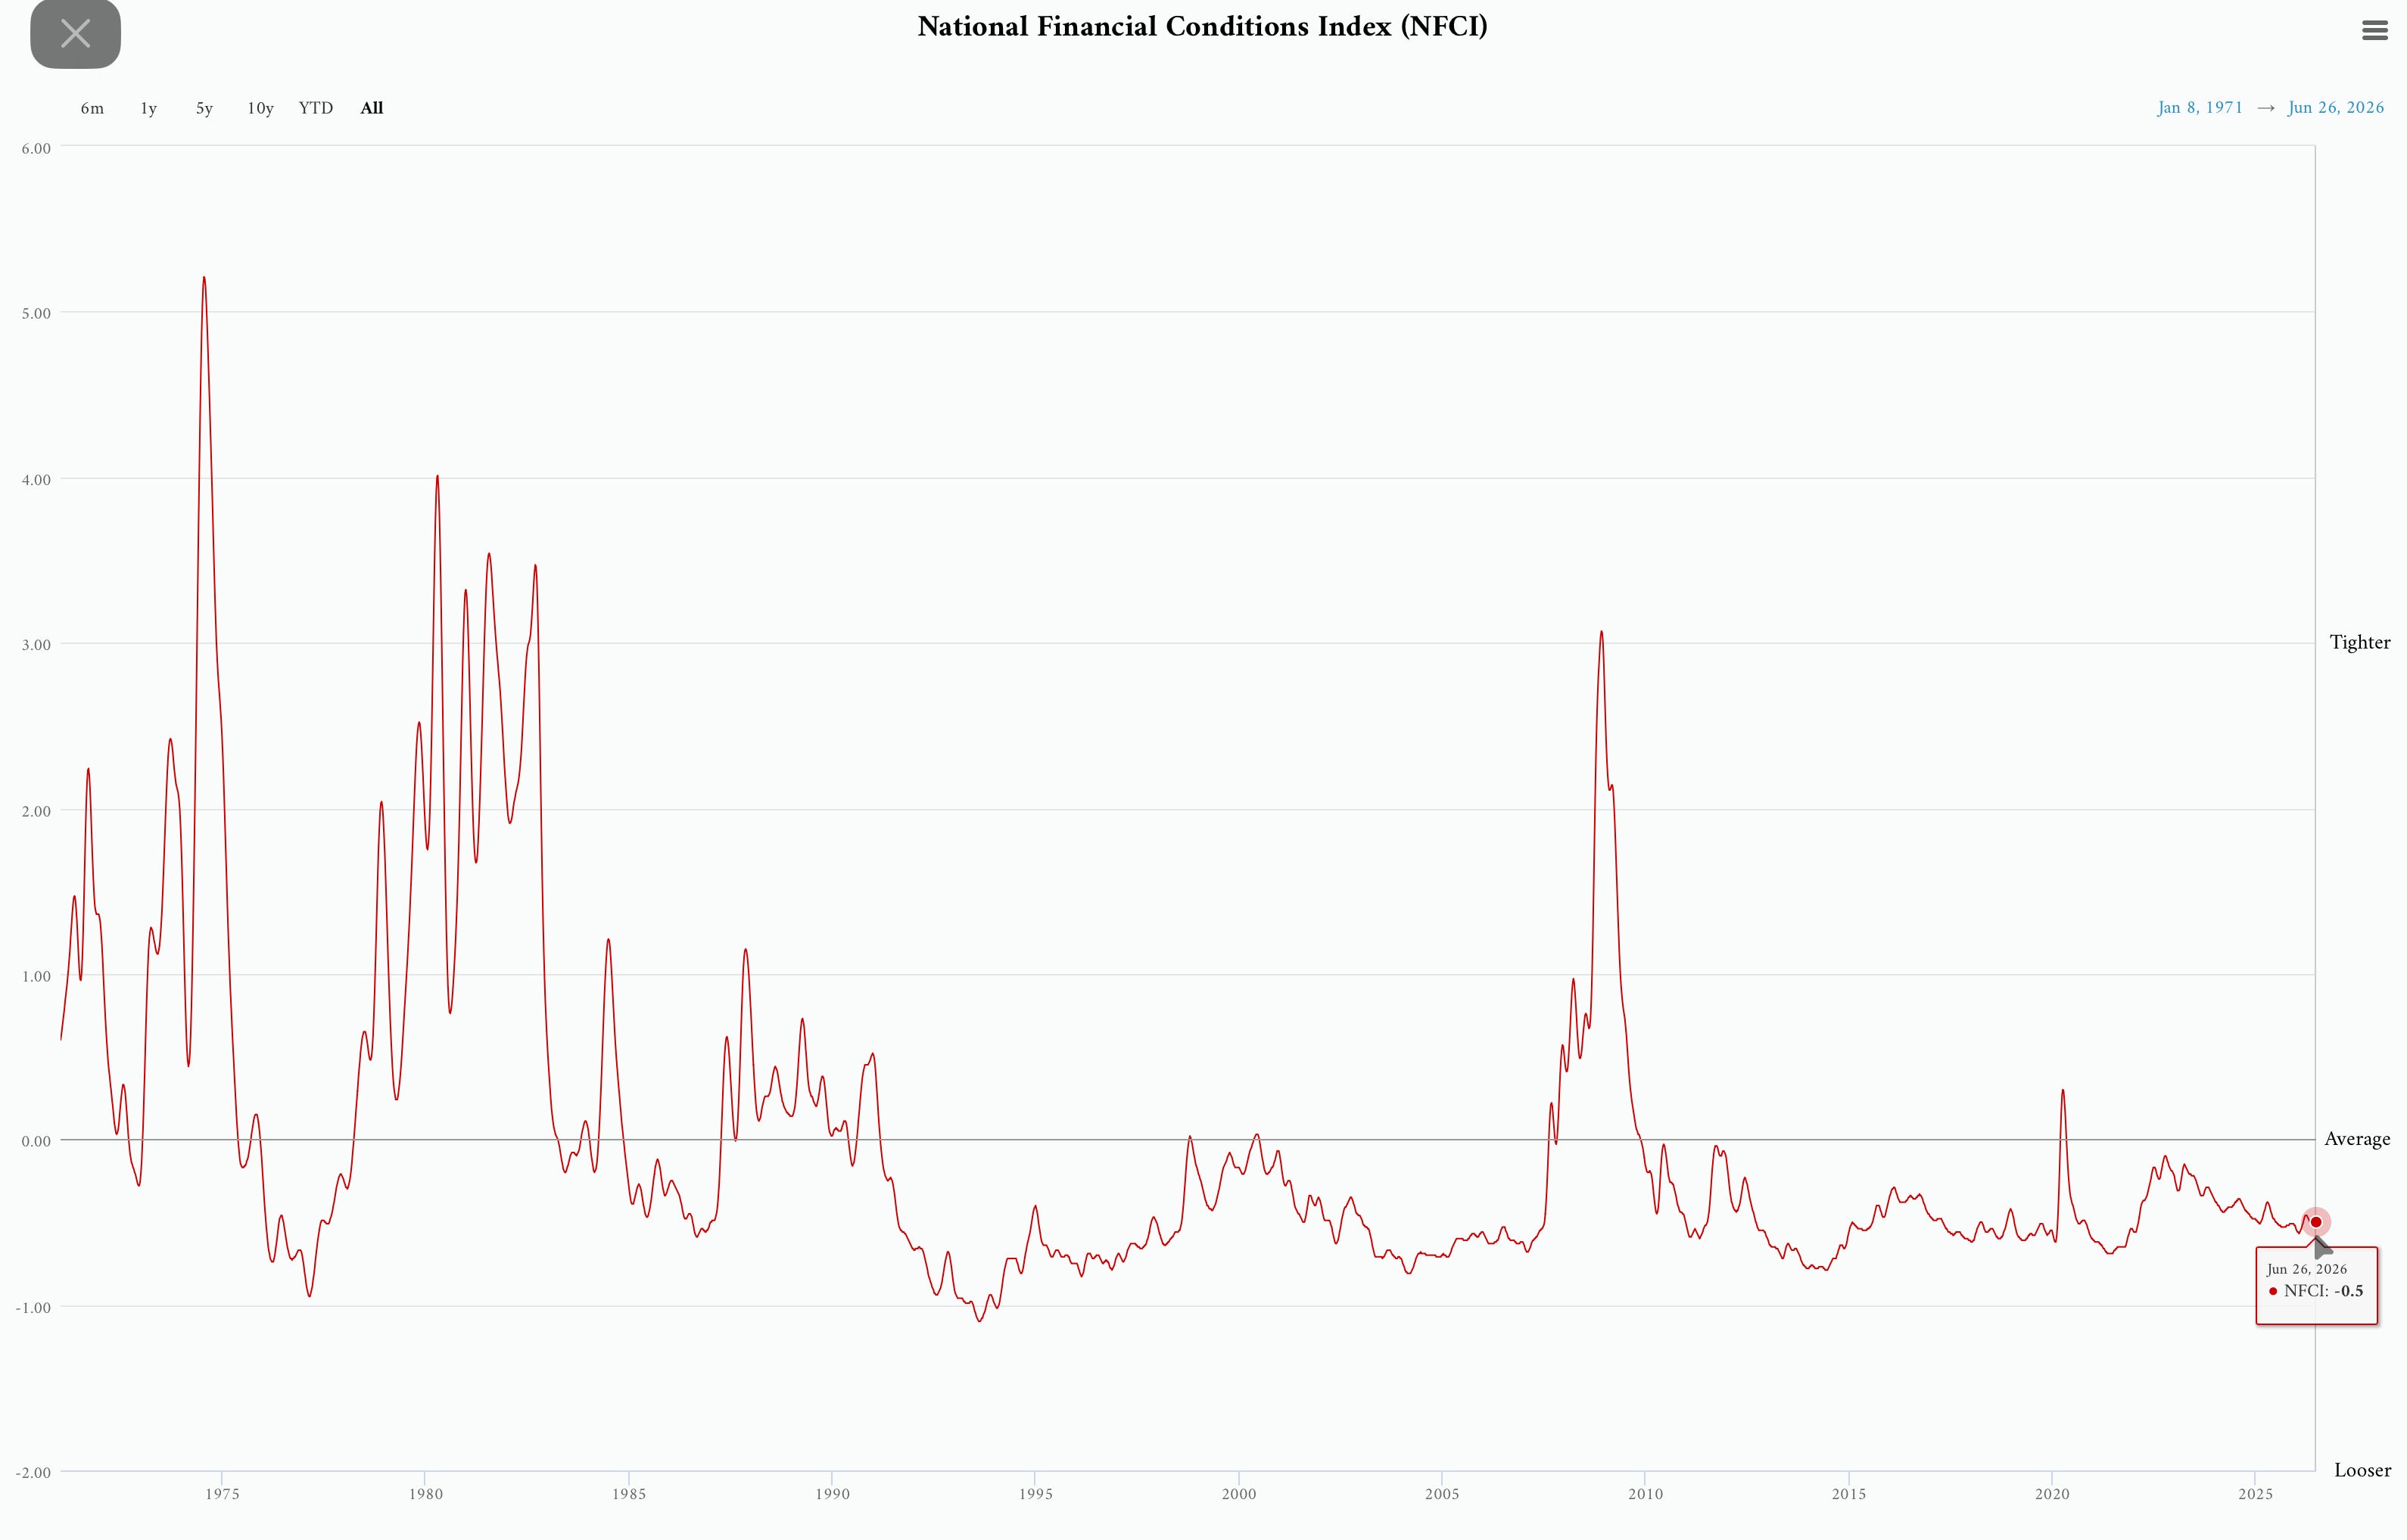
The Chicago National Financial Conditions Index shows that financial conditions are looser than the historical average - where average conditions are calculated to be zero on this index. Specifically - this is a weighted composite index of 105 varied measures of financial conditions such as credit spreads, liquidity indices, lending risk indices and even oil volatility — with the historical average calculated to be zero shows a current reading of -0.5. The below chart does not tell you that everything is going to be fine. It shows you that the grease of the financial system — which is confidence expressed via the relative affordability of debt and leverage — that these financial expressions of confidence by are pretty easy to buy and sell right now. It shows that market participants are not currently pricing above average risk on leverage, credit, or more speculative risk assets.
On the one hand, this confidence is unnerving and on the other re-assuring for traders. It’s always both. Keep it simple. When price goes down, you sell.
See you this weekend,
-Andy
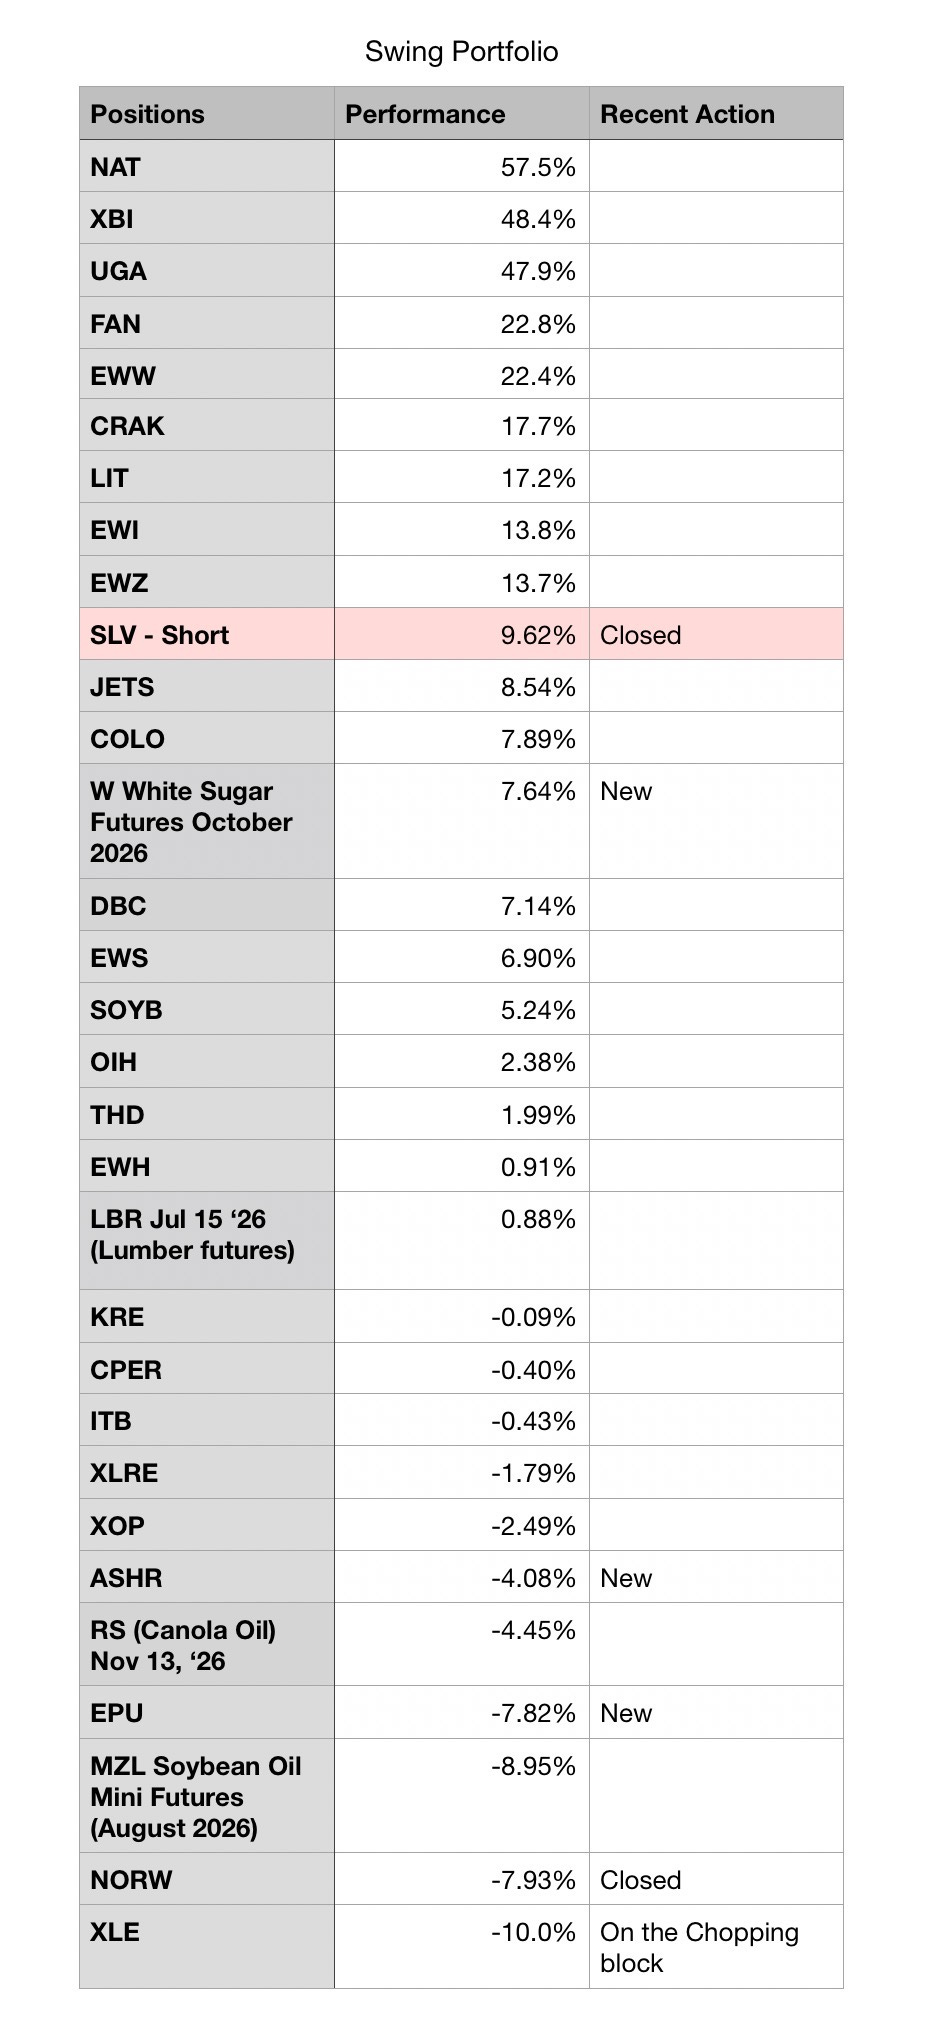
Swing Portfolio Year-to-Date Performance: 11.36%
Thanks for reading Analogics! Subscribe for free to receive new posts and support my work.
Comments
Nothing yet. Say the first thing.
Sign in to join the conversation.