

Good Morning. Brief note today - the market is super boring right now and there isn’t much to do. I’m not supposed to say that. Culturally, ‘content creators’ about financial markets are incentivized to dangle partial information and create an illusion of special insight — constantly appearing to see something you cannot.
Meh. I don’t give a fuck. It’s you and me - and we are beyond bullshit.
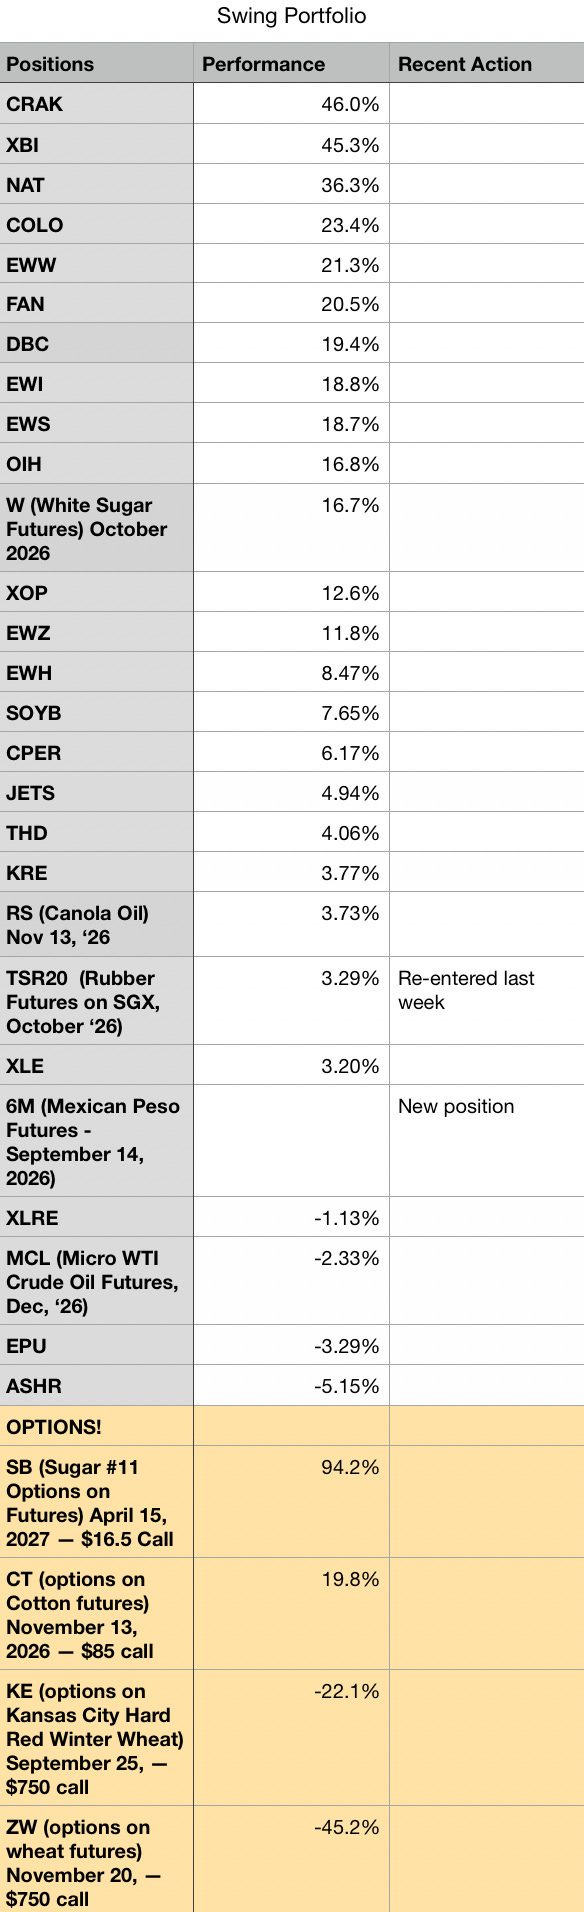
We went long the Mexican Peso (must’ve been around the same time Jason Perz wen’t long) this week, which is providing some nice diversification alongside our current commodity exposure.
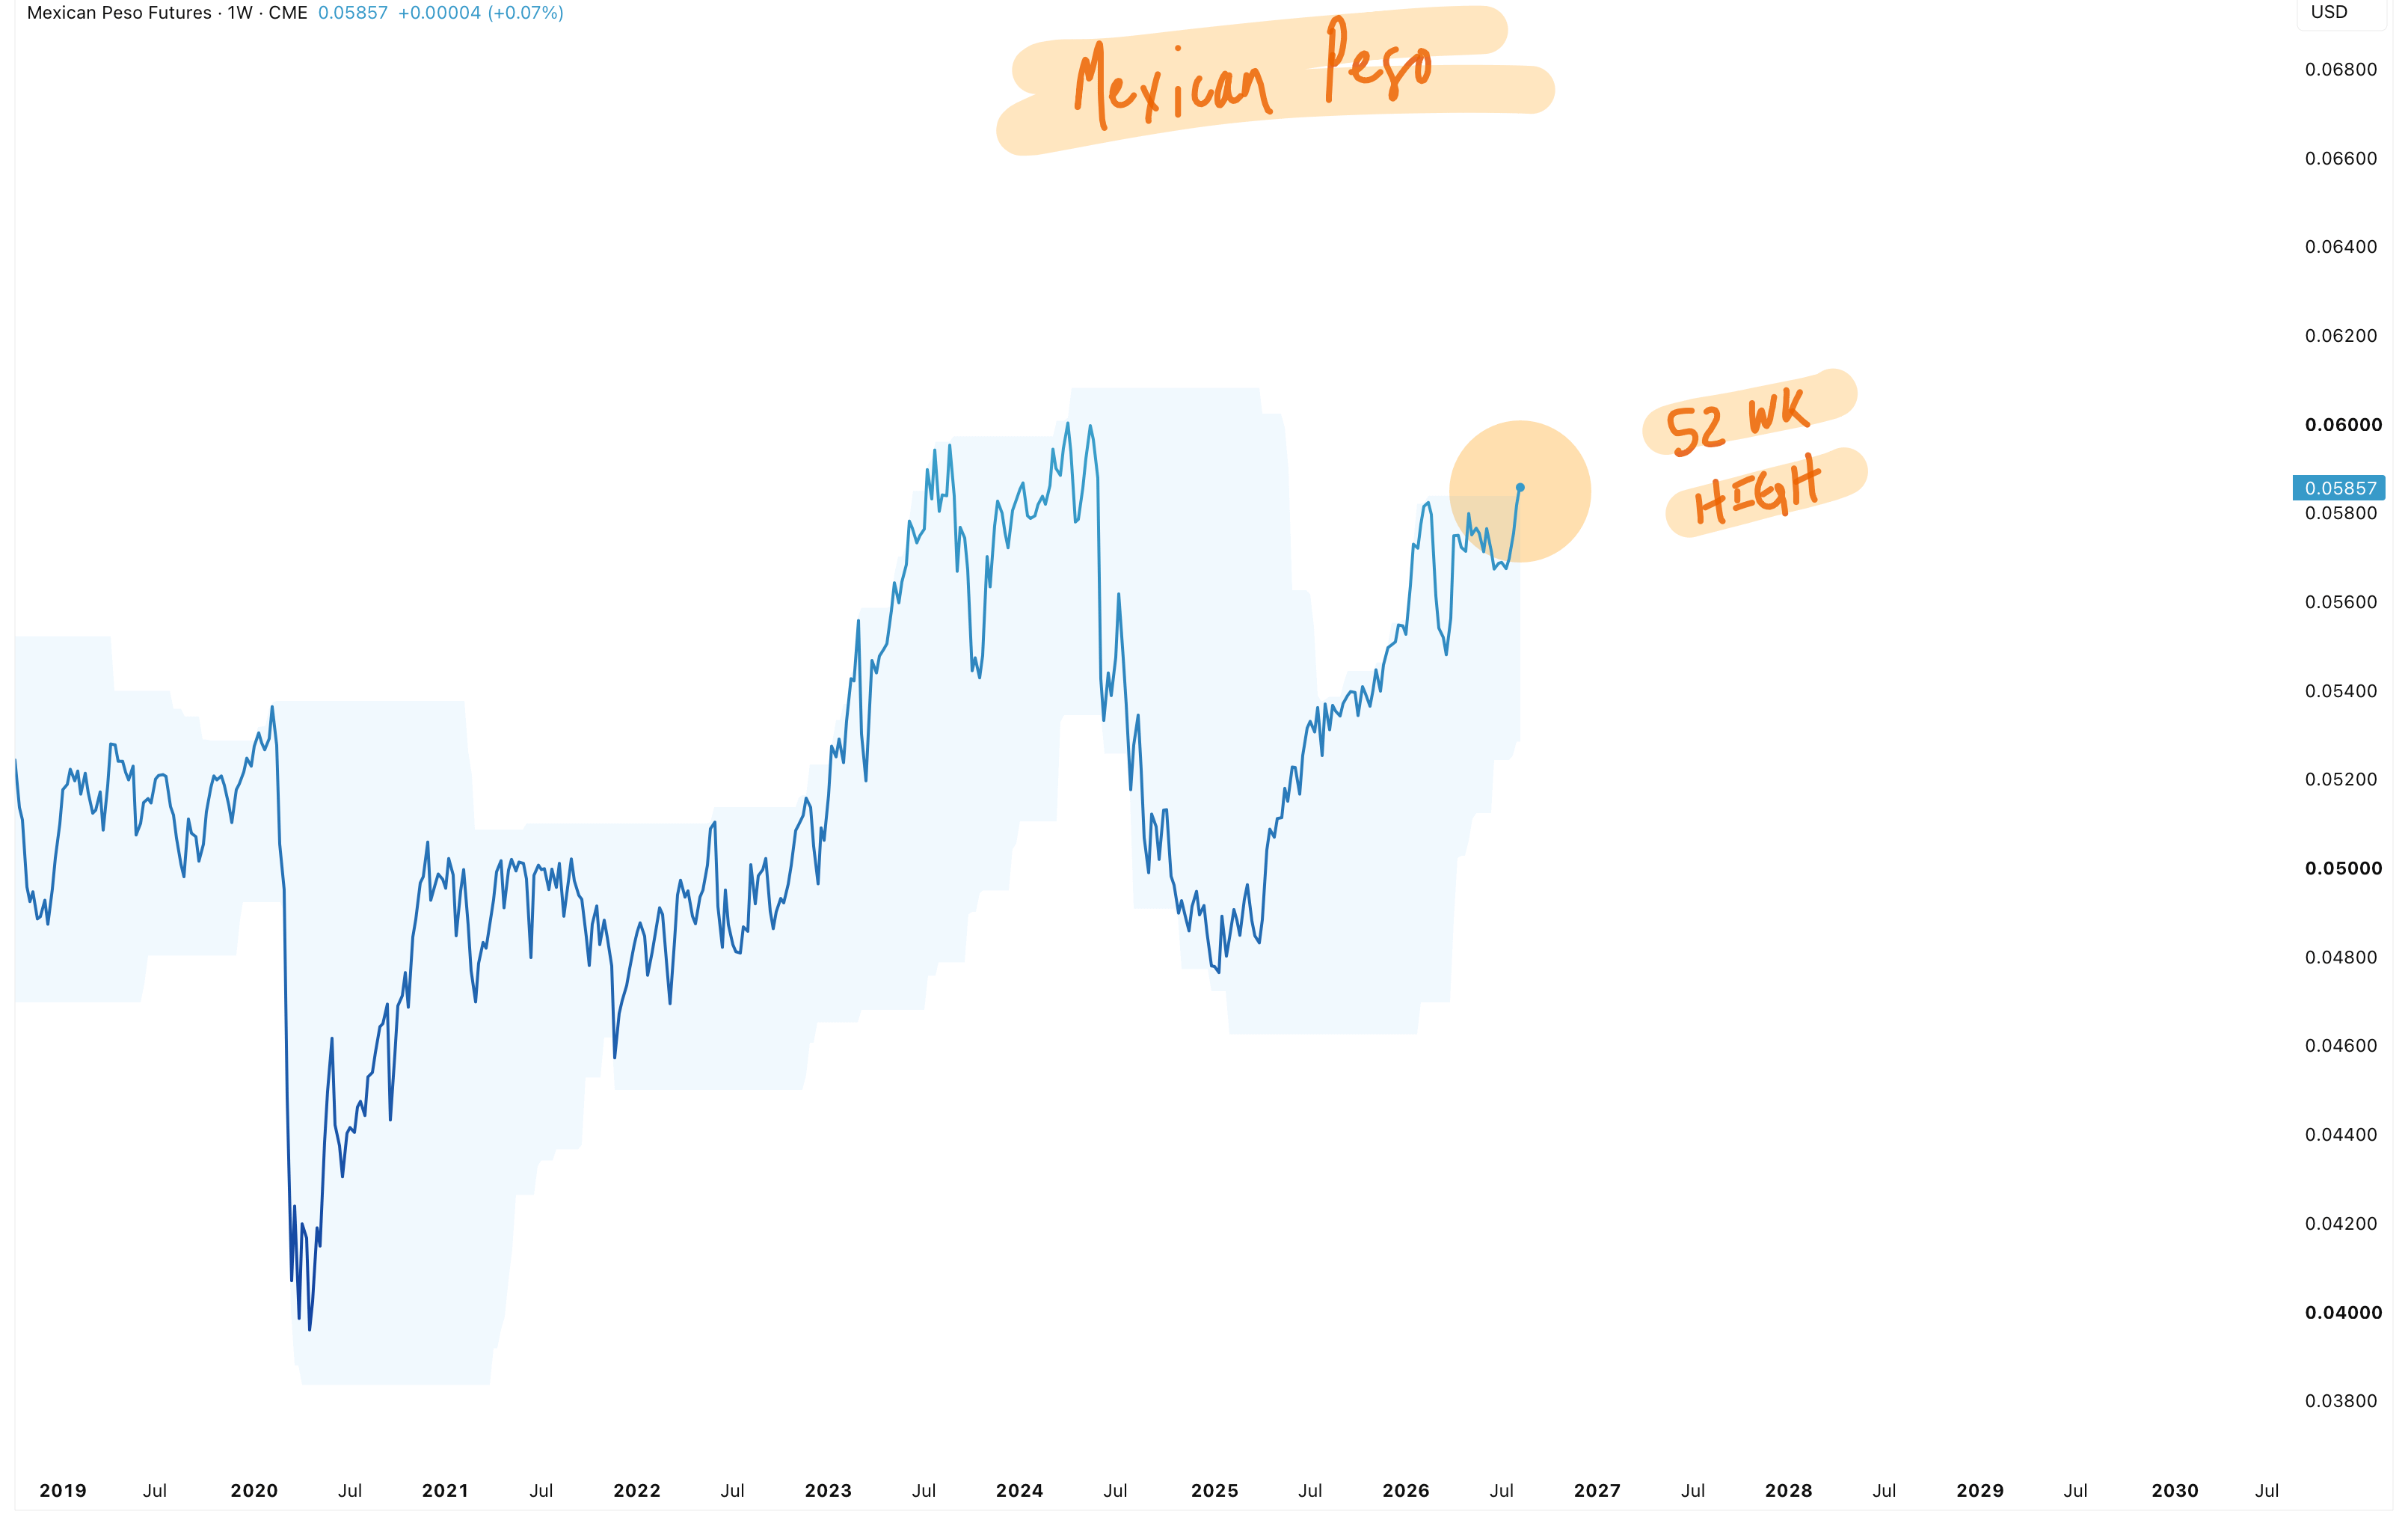
We’re holding all other positions.
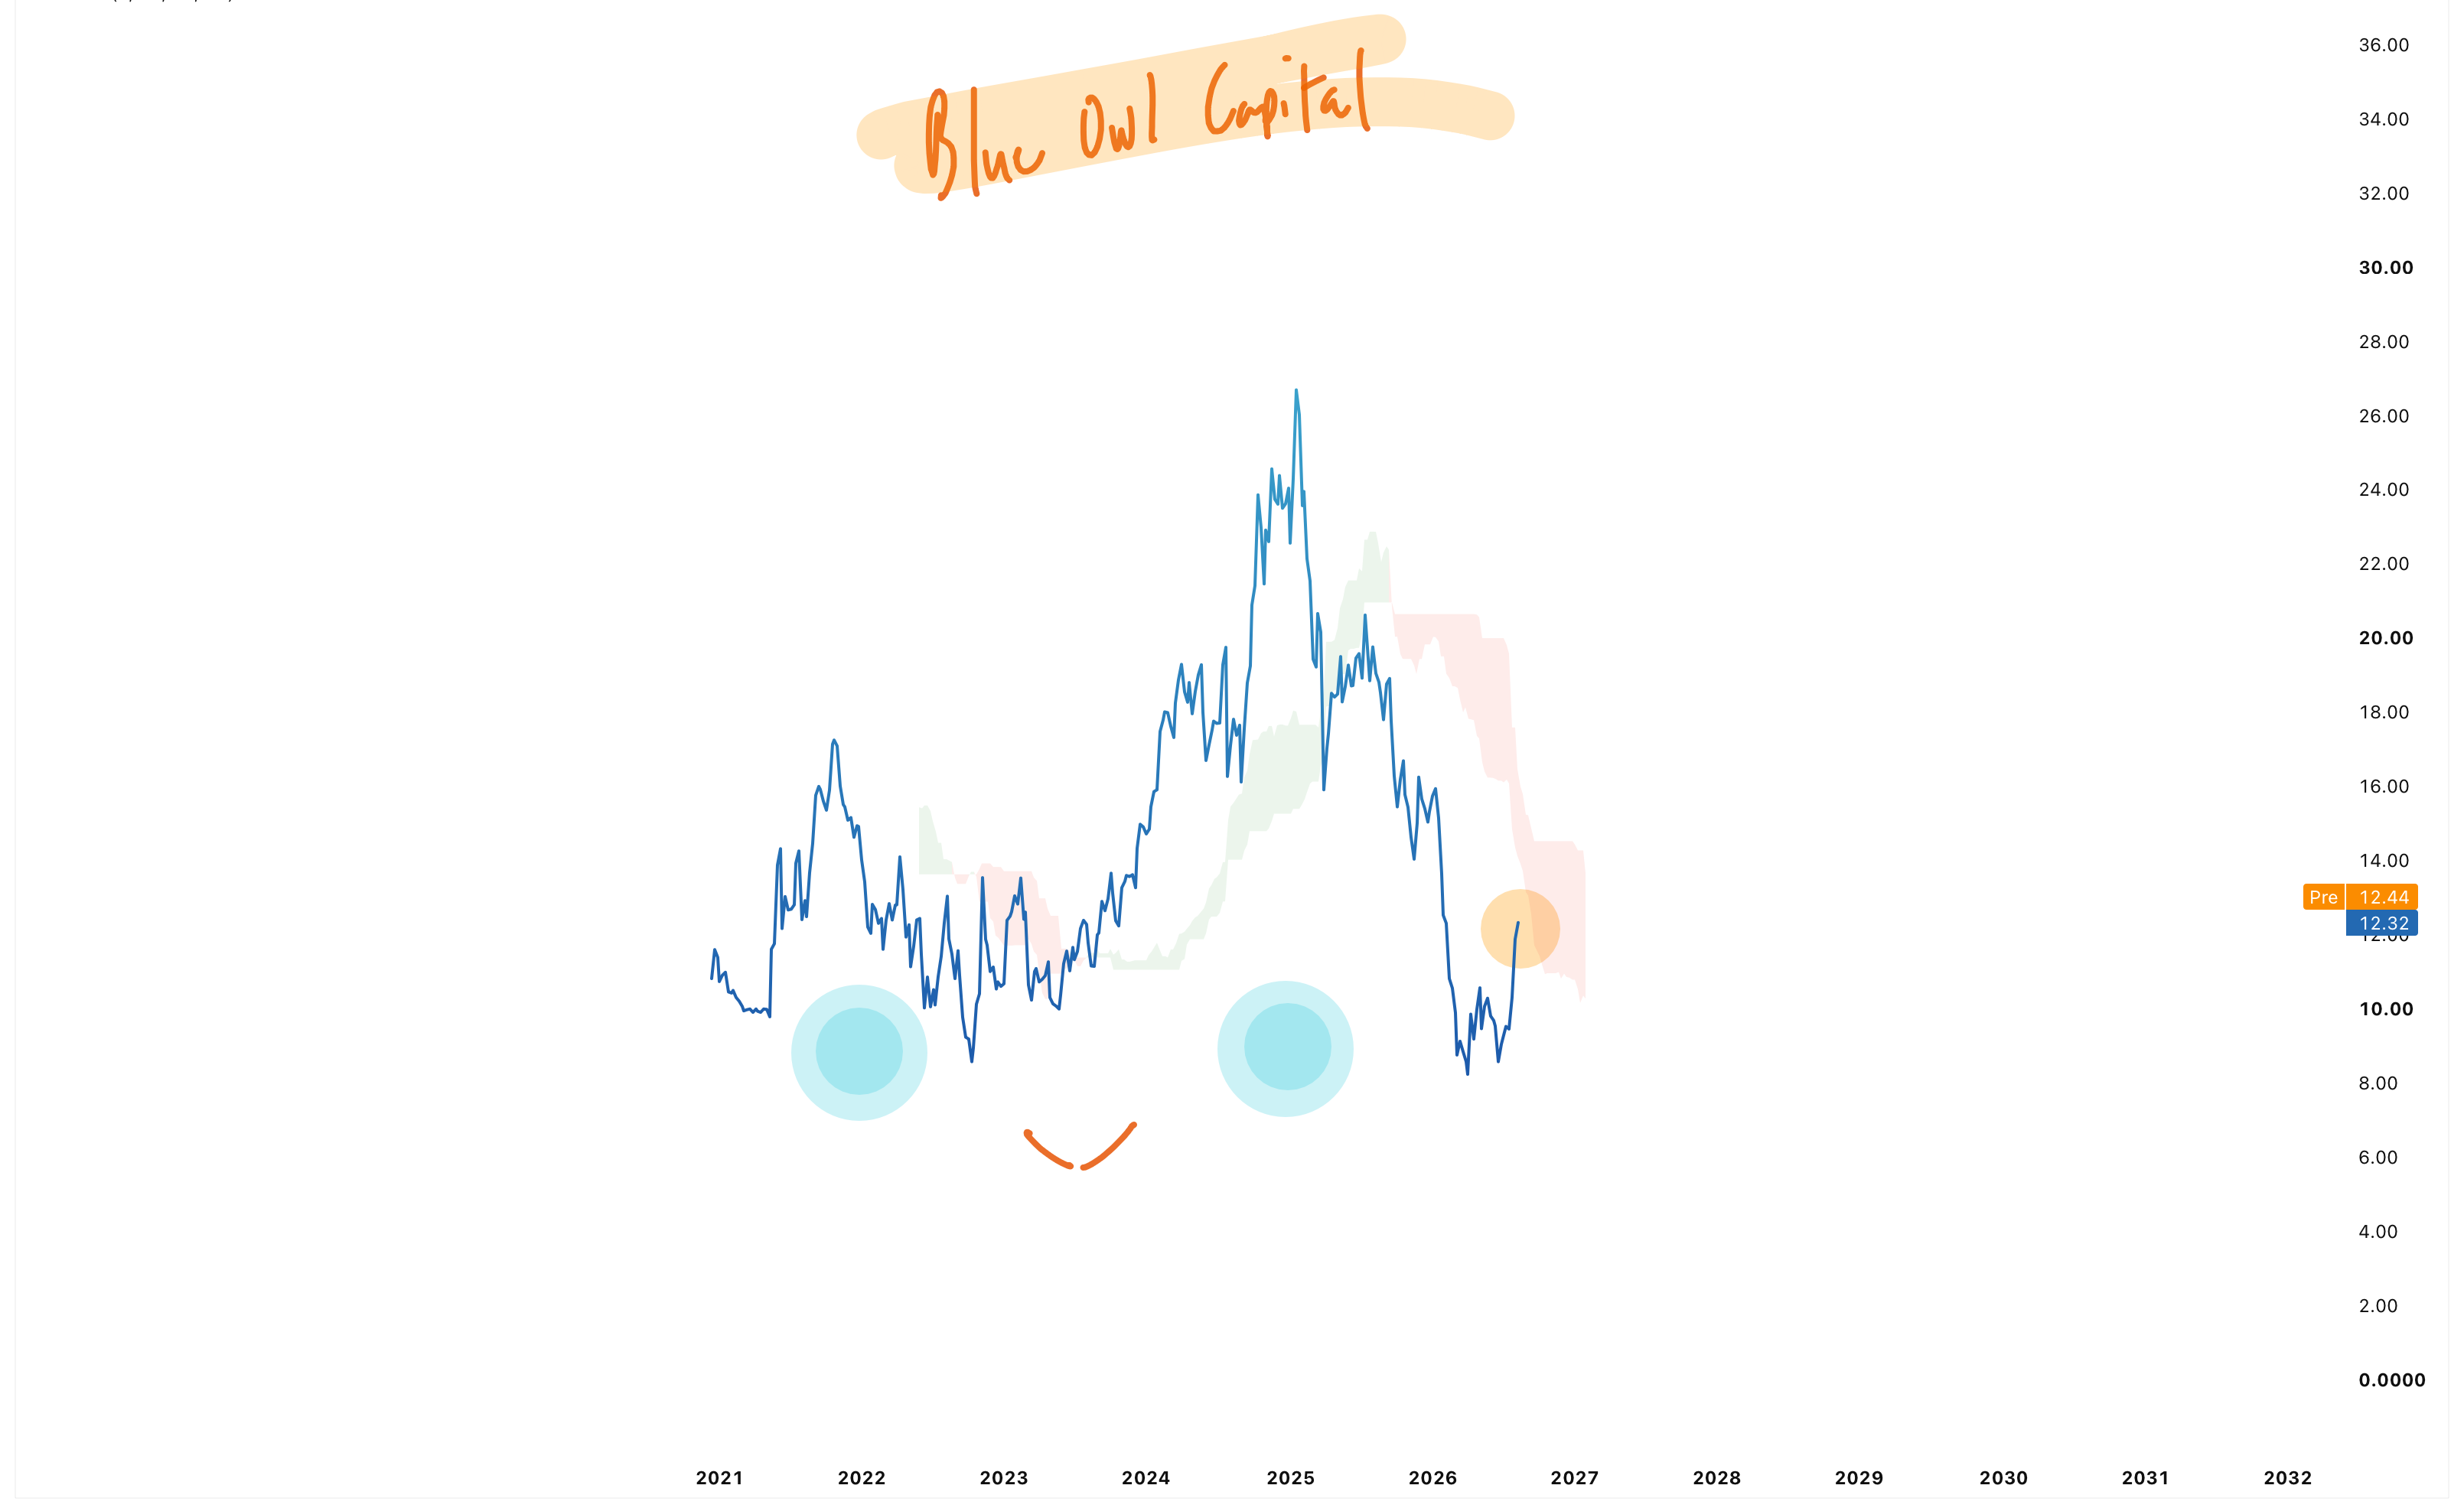
Liquidity is so abundant that even private credit and equity names have perked up. Blackstone, Ares, KKR, Apollo — they all look good. Look at Blue Owl capital - heavily dramatized as the poster-child for impending credit doom. Looks like it has found support and is reversing trend higher. Also looks cute.
Little Owly guy.
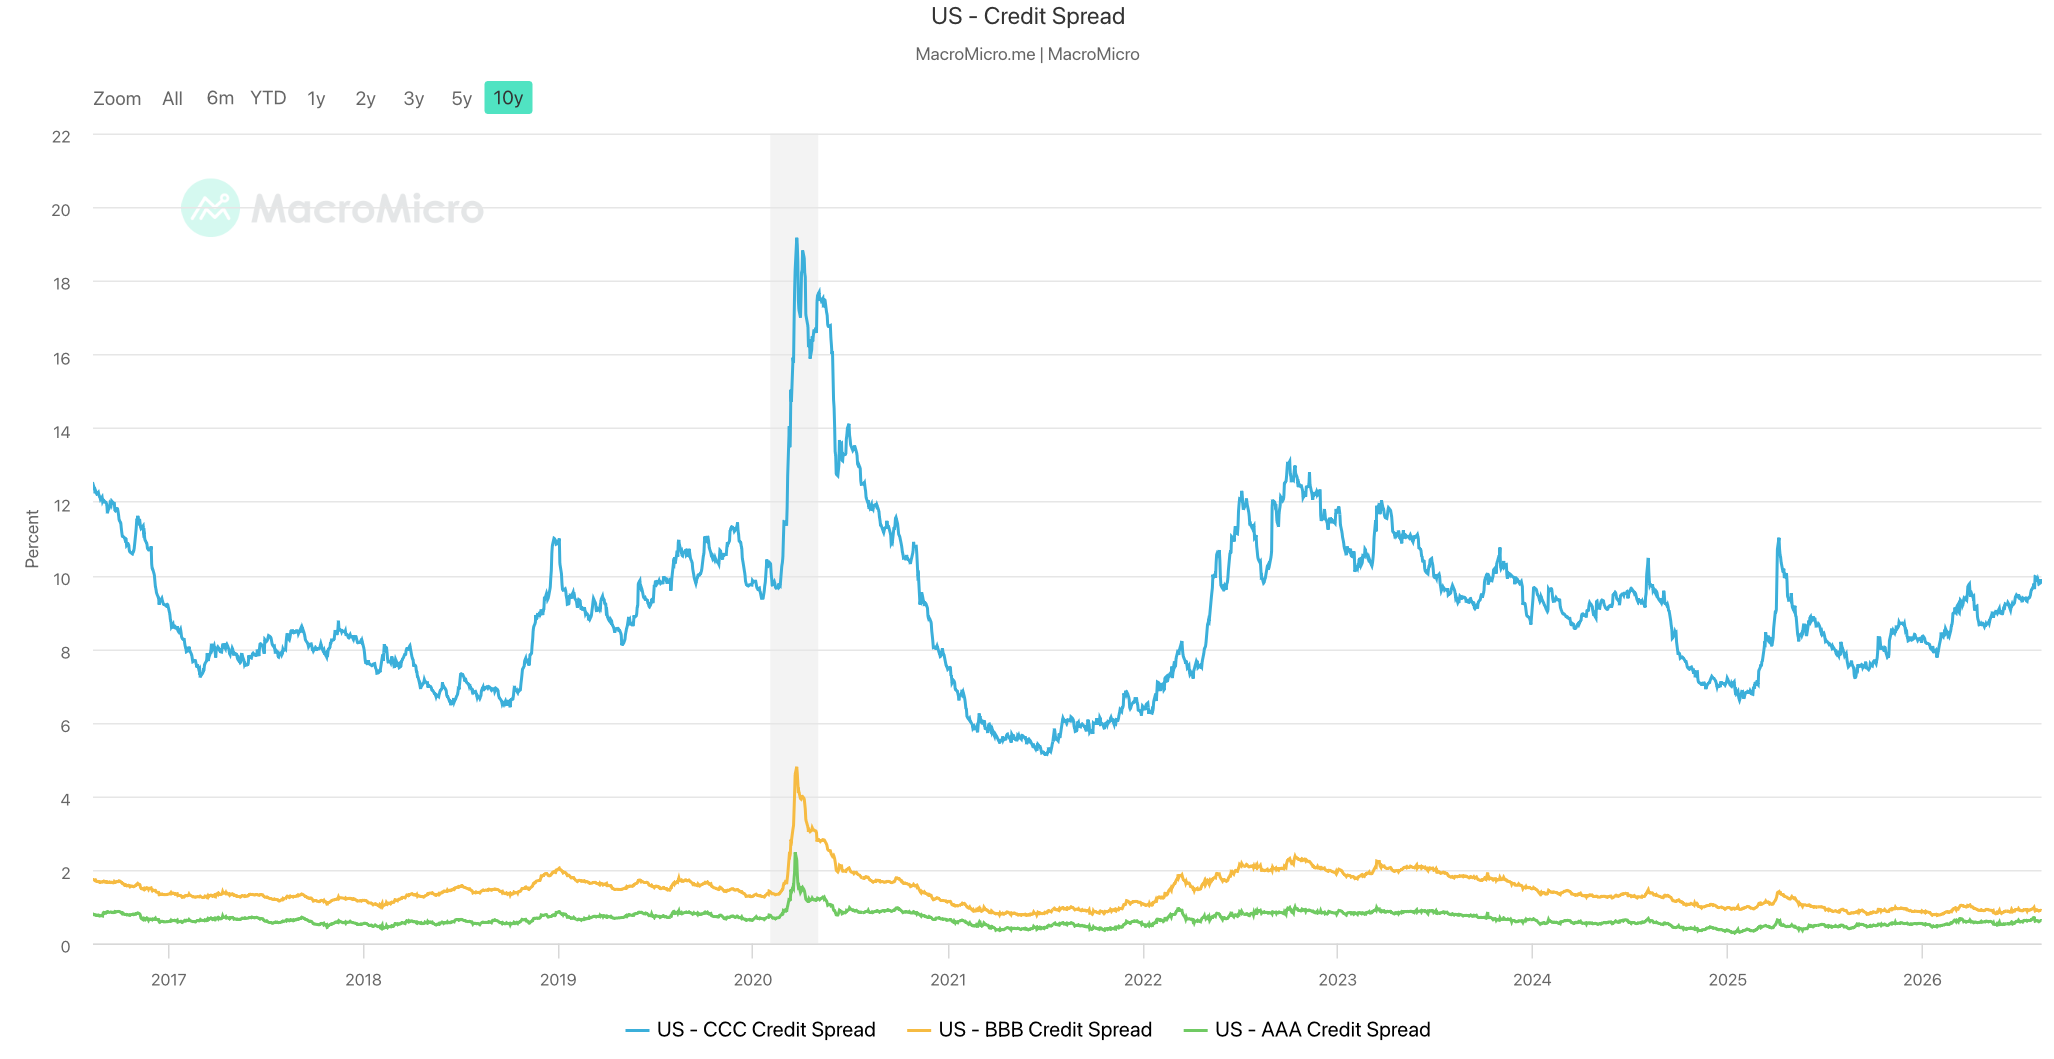
10-year credit spreads (the yield differential between higher-risk corporate bonds of various grades of quality vs the ‘risk free’ 10-year US Treasury — which tells us how traders of debt are pricing risk)… AAA’s, BBB’s and CCC level bonds look fine. CCC’s have been grinding higher this year but look pretty tame considering the amount of debt and equity being sold across the AI complex.
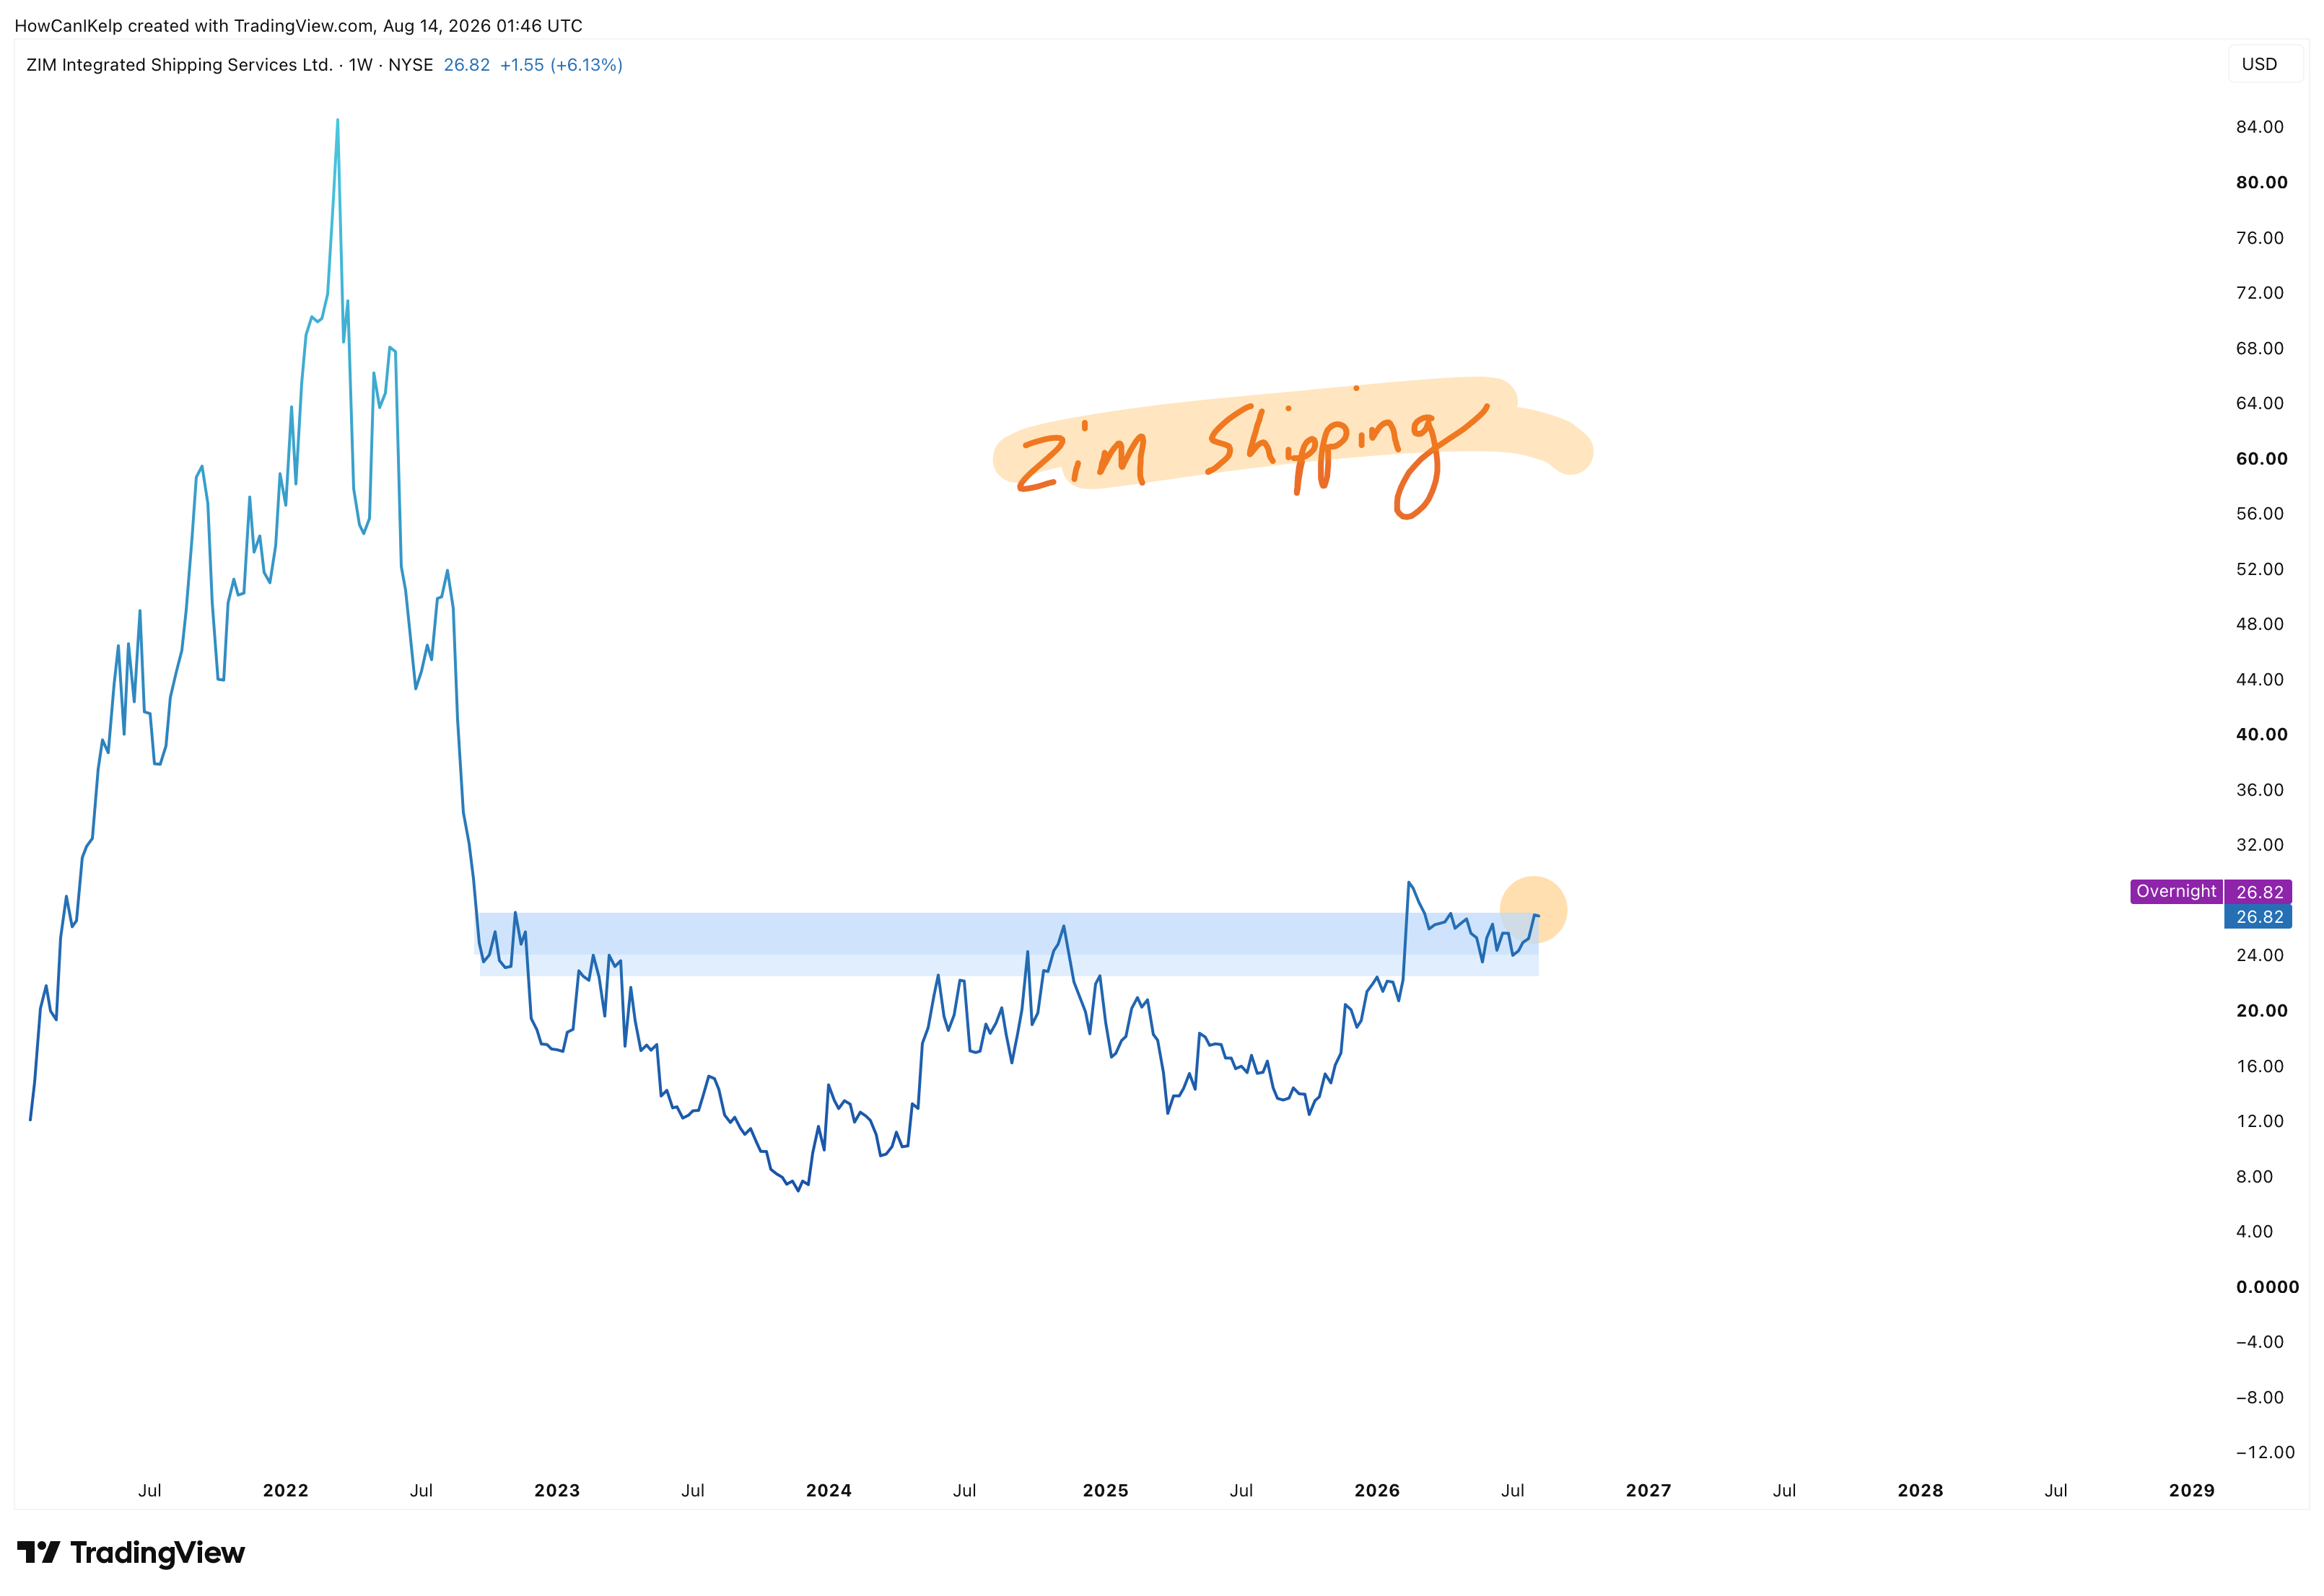
The shipping sector continues to outperform. I like the Israeli shipper ZIM 0.00%↑ above this range.
Energy trade ain’t even started yet according to this chart of DBC 0.00%↑ - mixed energy commodity futures etf. A weekly close above 30.20 and I’ll add to our position again.
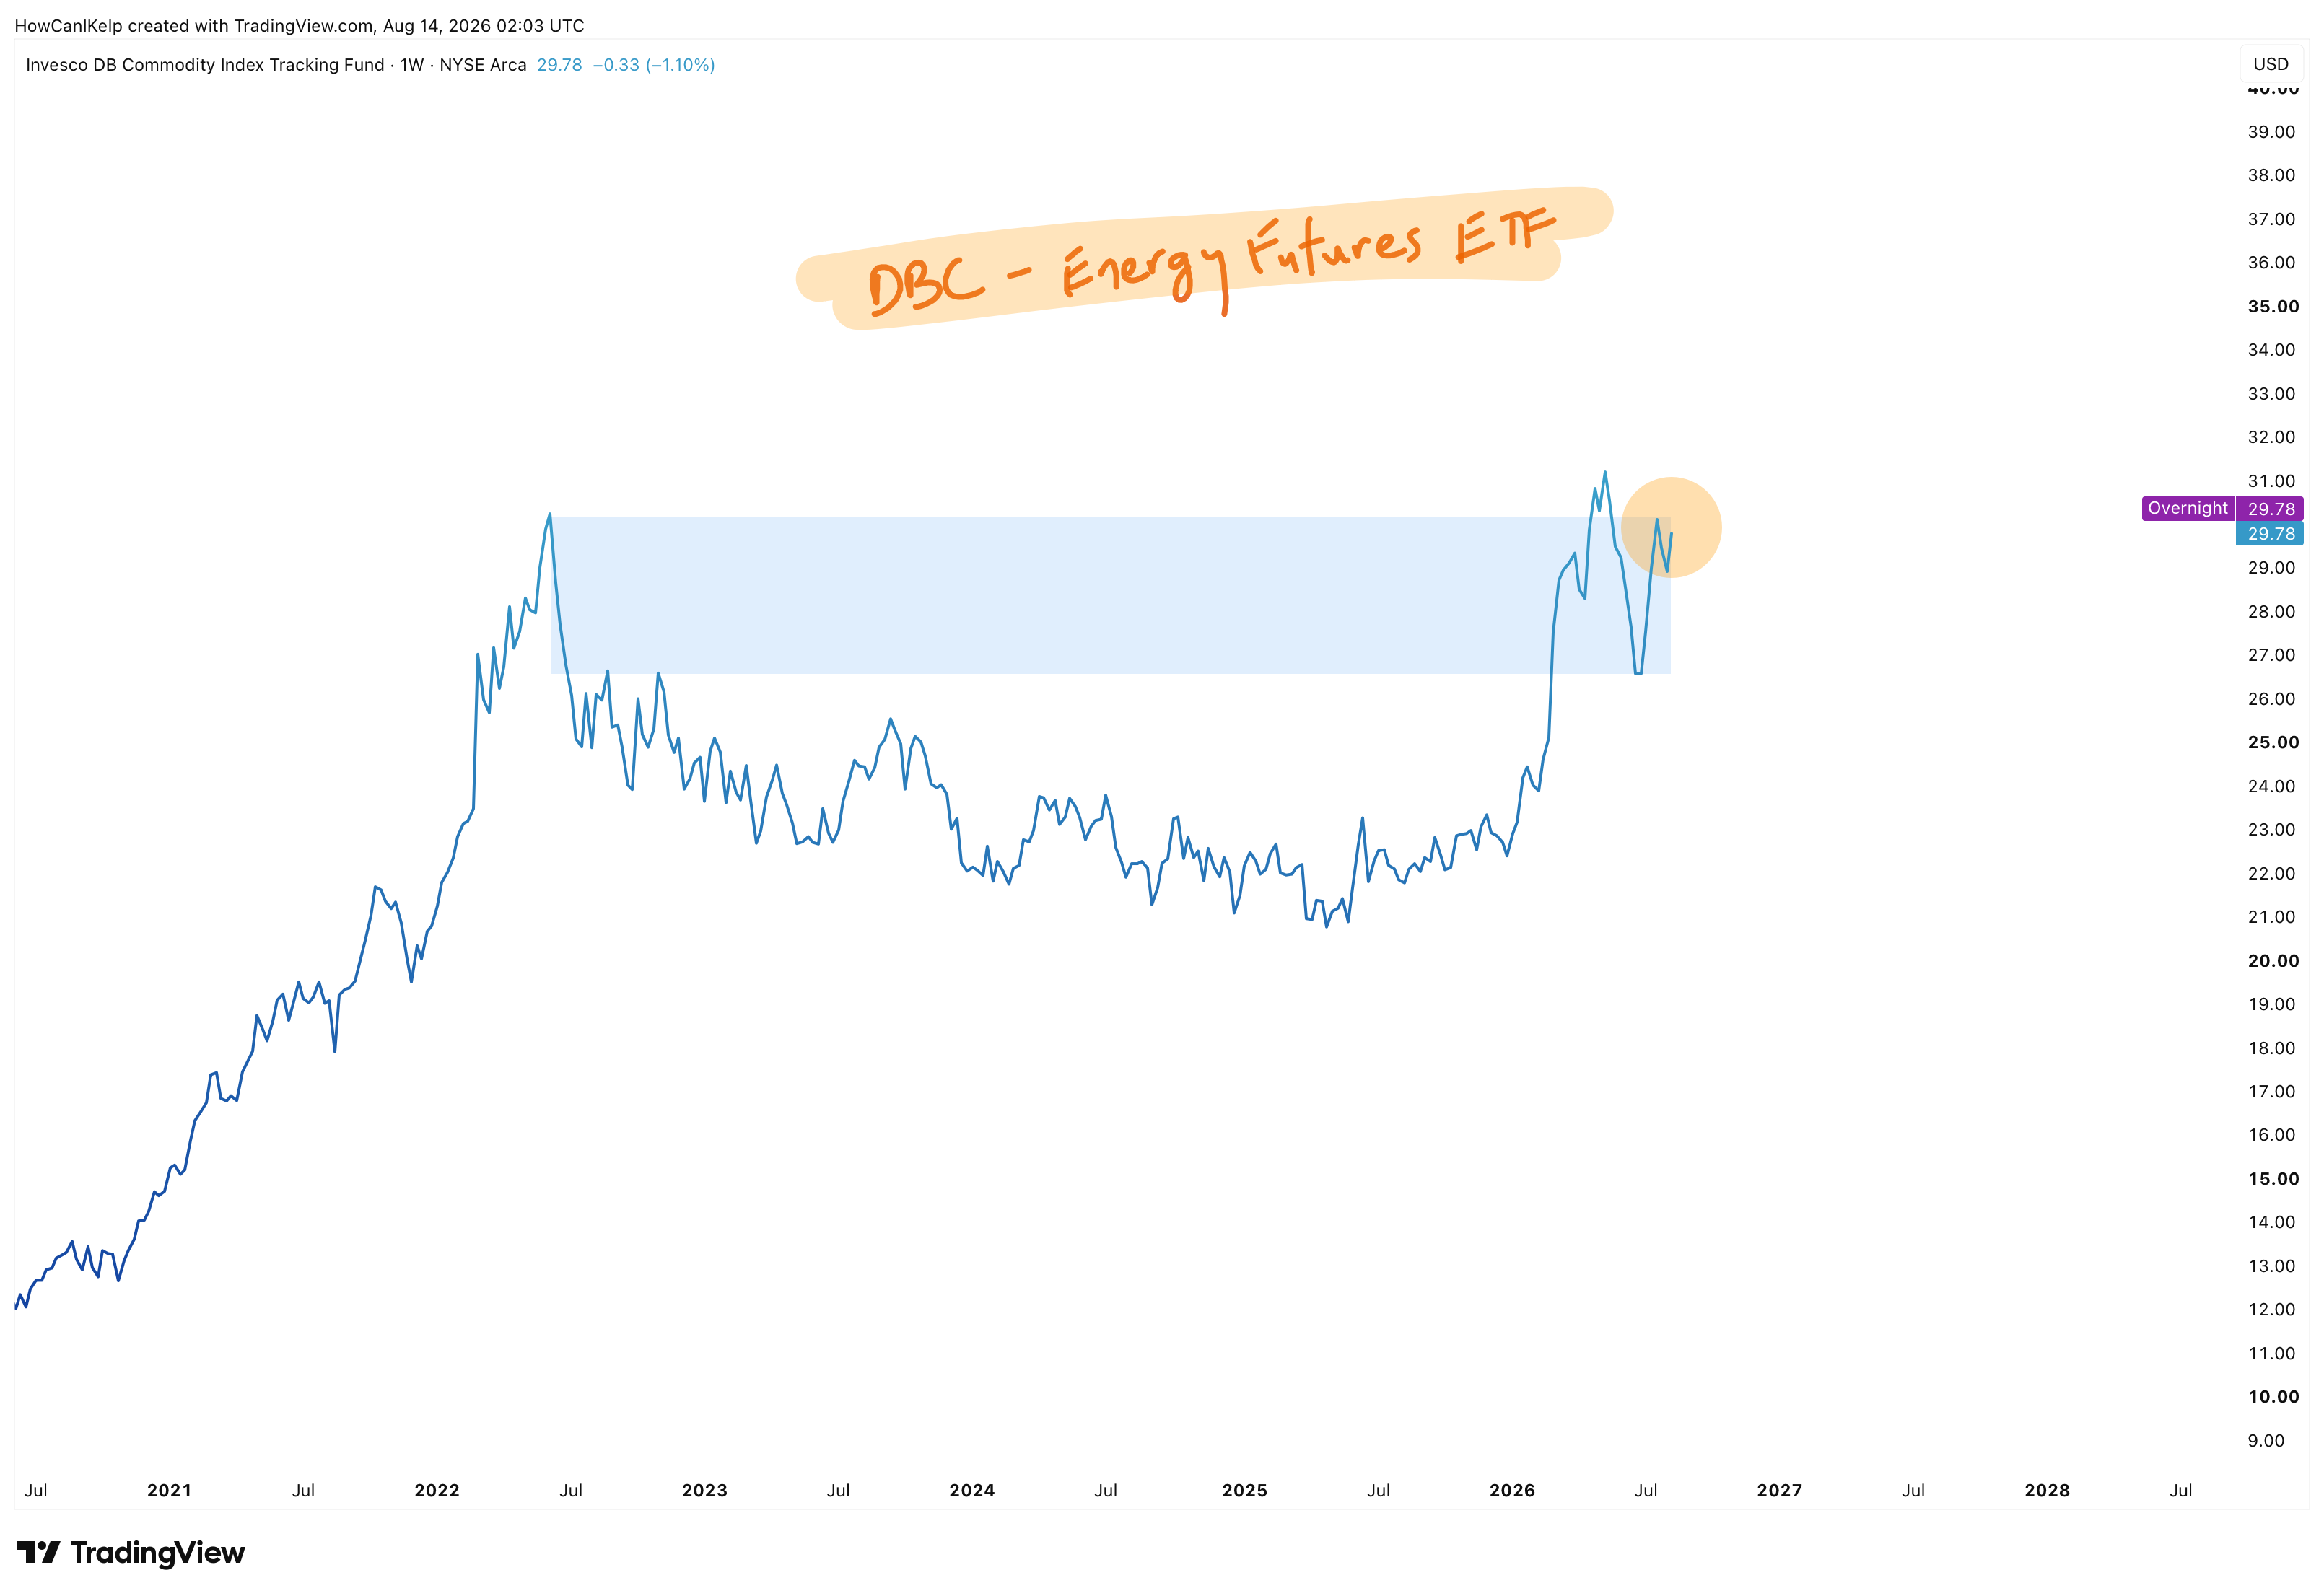
When you look at the portfolio at bottom of this letter - it’s biotech, shipping, commodities and energy that are leading the way. Even the wind power etf FAN 0.00%↑ is still in a primary uptrend in the context of the most vehemently anti-wind power administration imaginable.
These market leaders reveal more about the state of the economy than any politician ever could. And they reflect a profoundly reflationary outlook. The most speculative sectors of the market alongside real shit.
One last thing I found remarkable this past week: look at a year-on-year sector breakdown of inflation (the consumer price index) the Fed1 uses to come up with an overall inflation number - CPI - of 3.4% year on year. Just using your intuition at a glance - does 3.4% accurately represent what you see here and feel at the grocery store?
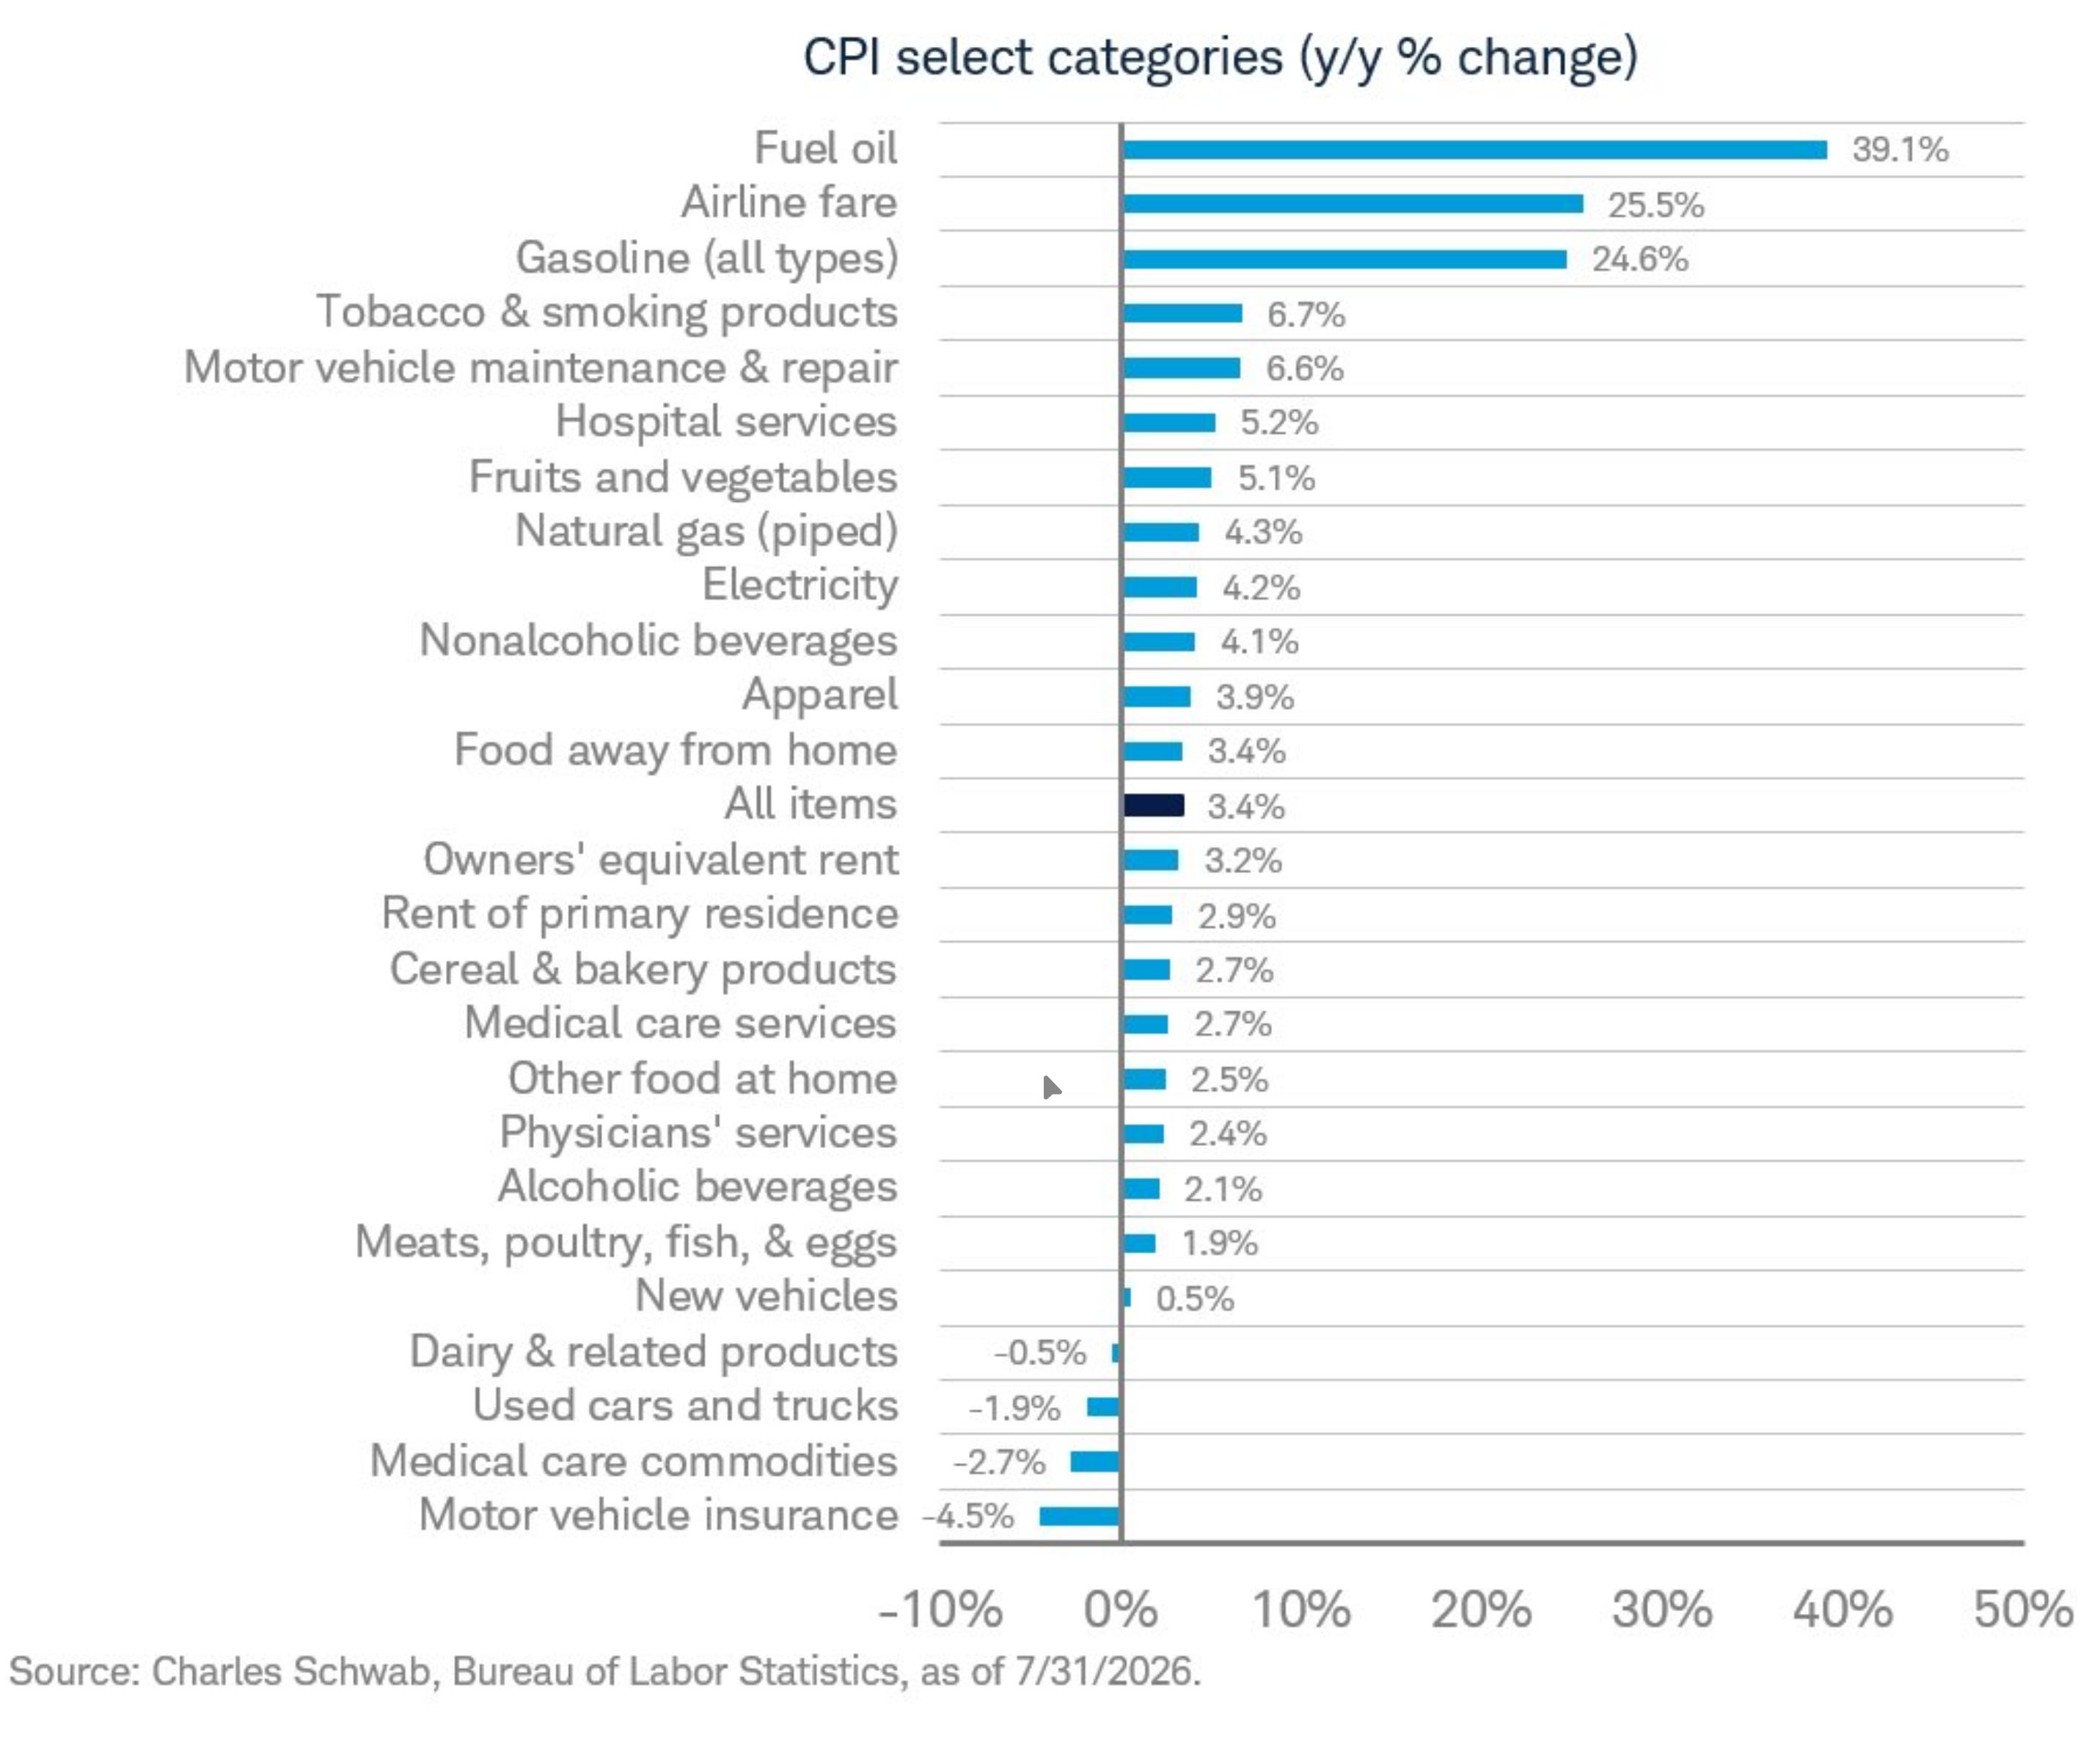
Fed mandate of price stability my ass.
Have a great weekend,
-Andy
Swing portfolio year-to-date performance: 18.04%
*via the Bureau of Labor Statistics
No posts
Comments
Nothing yet. Say the first thing.
Sign in to join the conversation.