
A few weeks ago I had an interesting conversation with a colleague about which states receive the most federal dollars for disaster aid relative to their tax base, and which receive the least. Put another way, which states are disaster donors and which are recipients? The framing of donor/recipient is entirely too simple and risks giving the wrong signal (we don’t expect every state to pay their “share” across every policy domain), but it is a common way of discussing the relative flows of resources in, and out, of the federal government. I had some strong priors on the question, but have never analyzed disaster data to know for sure. To quote Kevin McCallister, I’ll give it a whirl.
I used Claude Code (see AI Statement below) to pull data on federal disaster aid from 2000-present, focusing on a few core programs:
FEMA Individuals and Households Program (IHP)
FEMA Public Assistance (PA)
FEMA Hazard Mitigation Grant Program (HMGP)
HUD Community Development Block Grant Disaster Recovery (CDBG-DR)
I excluded events like COVID, the Boston Marathon bombing and the 9/11 attacks to focus squarely on disasters driven by natural hazards.
This approach captures much, but certainly not all, of the monies that go to states after disasters. For example, it does not include certain FEMA programs (like the National Flood Insurance Program or Disaster Unemployment Assistance) or disaster spending from agencies like the Small Business Administration and the Department of Agriculture.
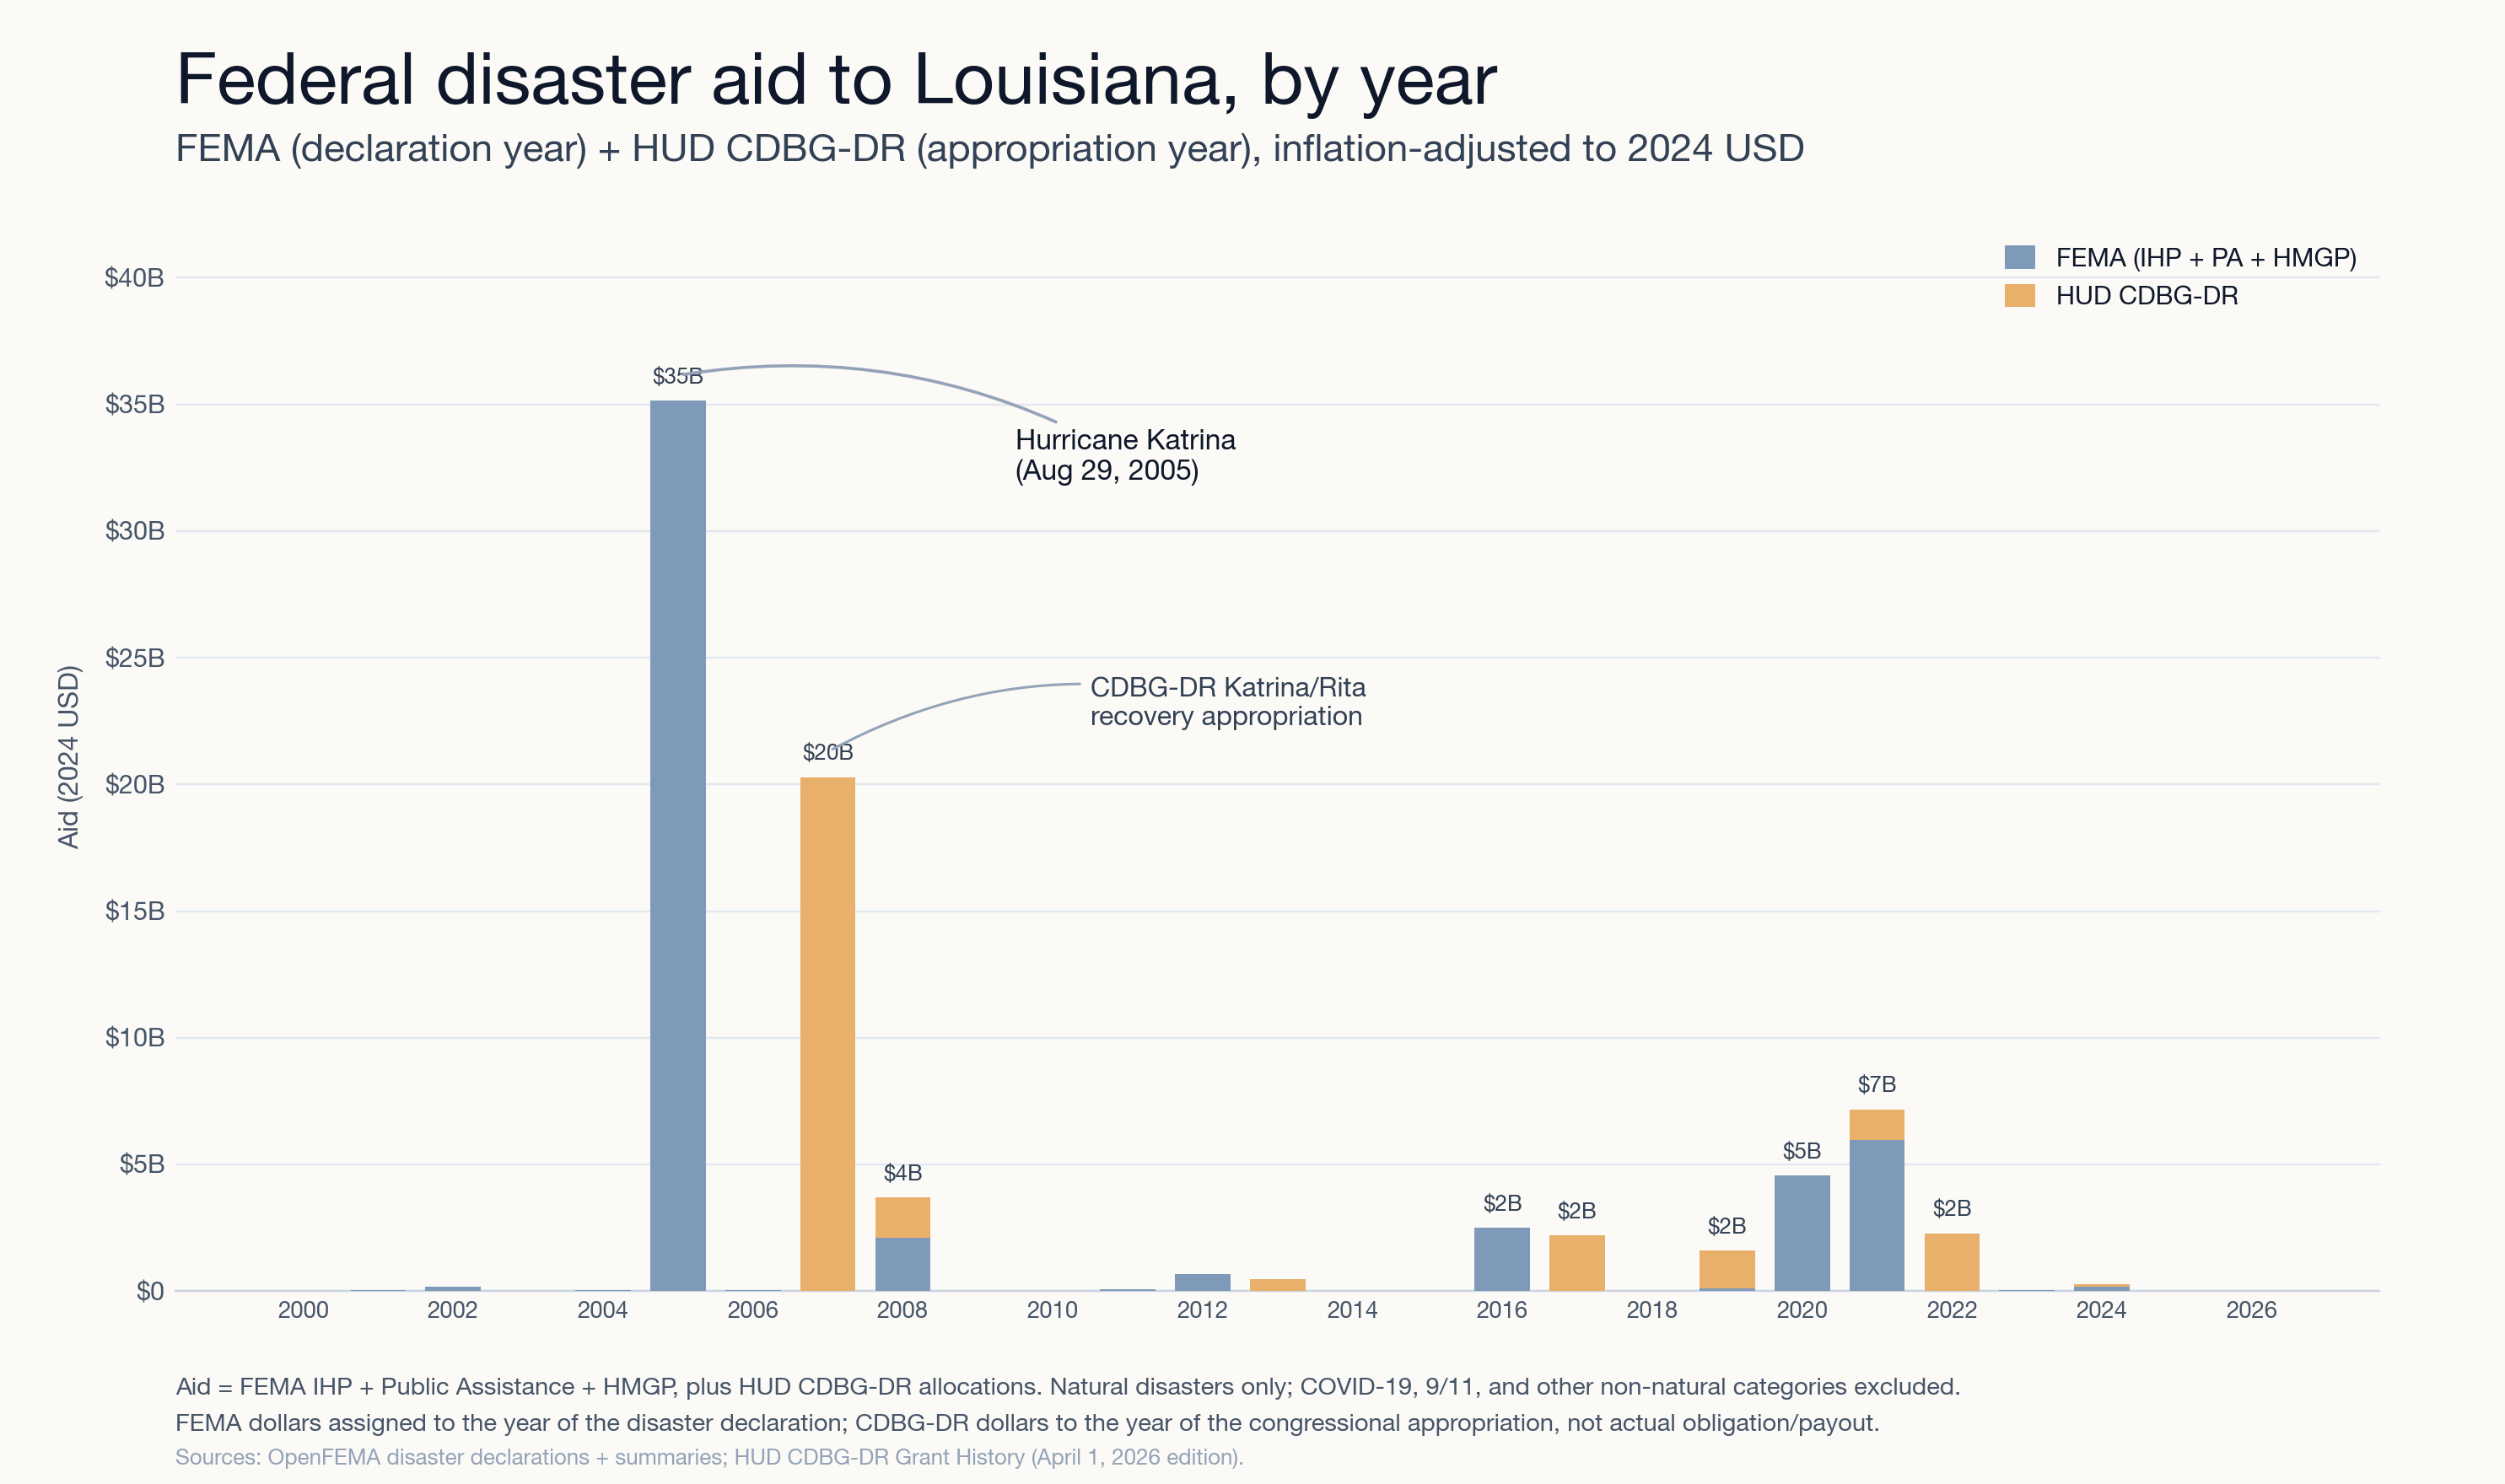
I chose 2000-onwards because it is a long enough period to capture the large but infrequent disasters and helps paint a more balanced portrait of losses than narrower periods. It is still a relatively small window, however, and some results will be skewed. In Louisiana, for instance, Hurricane Katrina accounts for 68% of the state’s $81 billion in aid over the 25 year period:
Ideally I could use disaster data from a longer period, but the further back you go the larger the issues with data availability and quality.
This analysis will also not capture a lot of current spending, like Hurricane Helene and the Milton, because many of the biggest-ticket projects and programs have not yet been accounted for, i.e. obligated by FEMA or HUD and therefore visible in the PA or CDBG-DR data.
With those caveats in mind, here is where disaster aid flowed over the past 26 years:
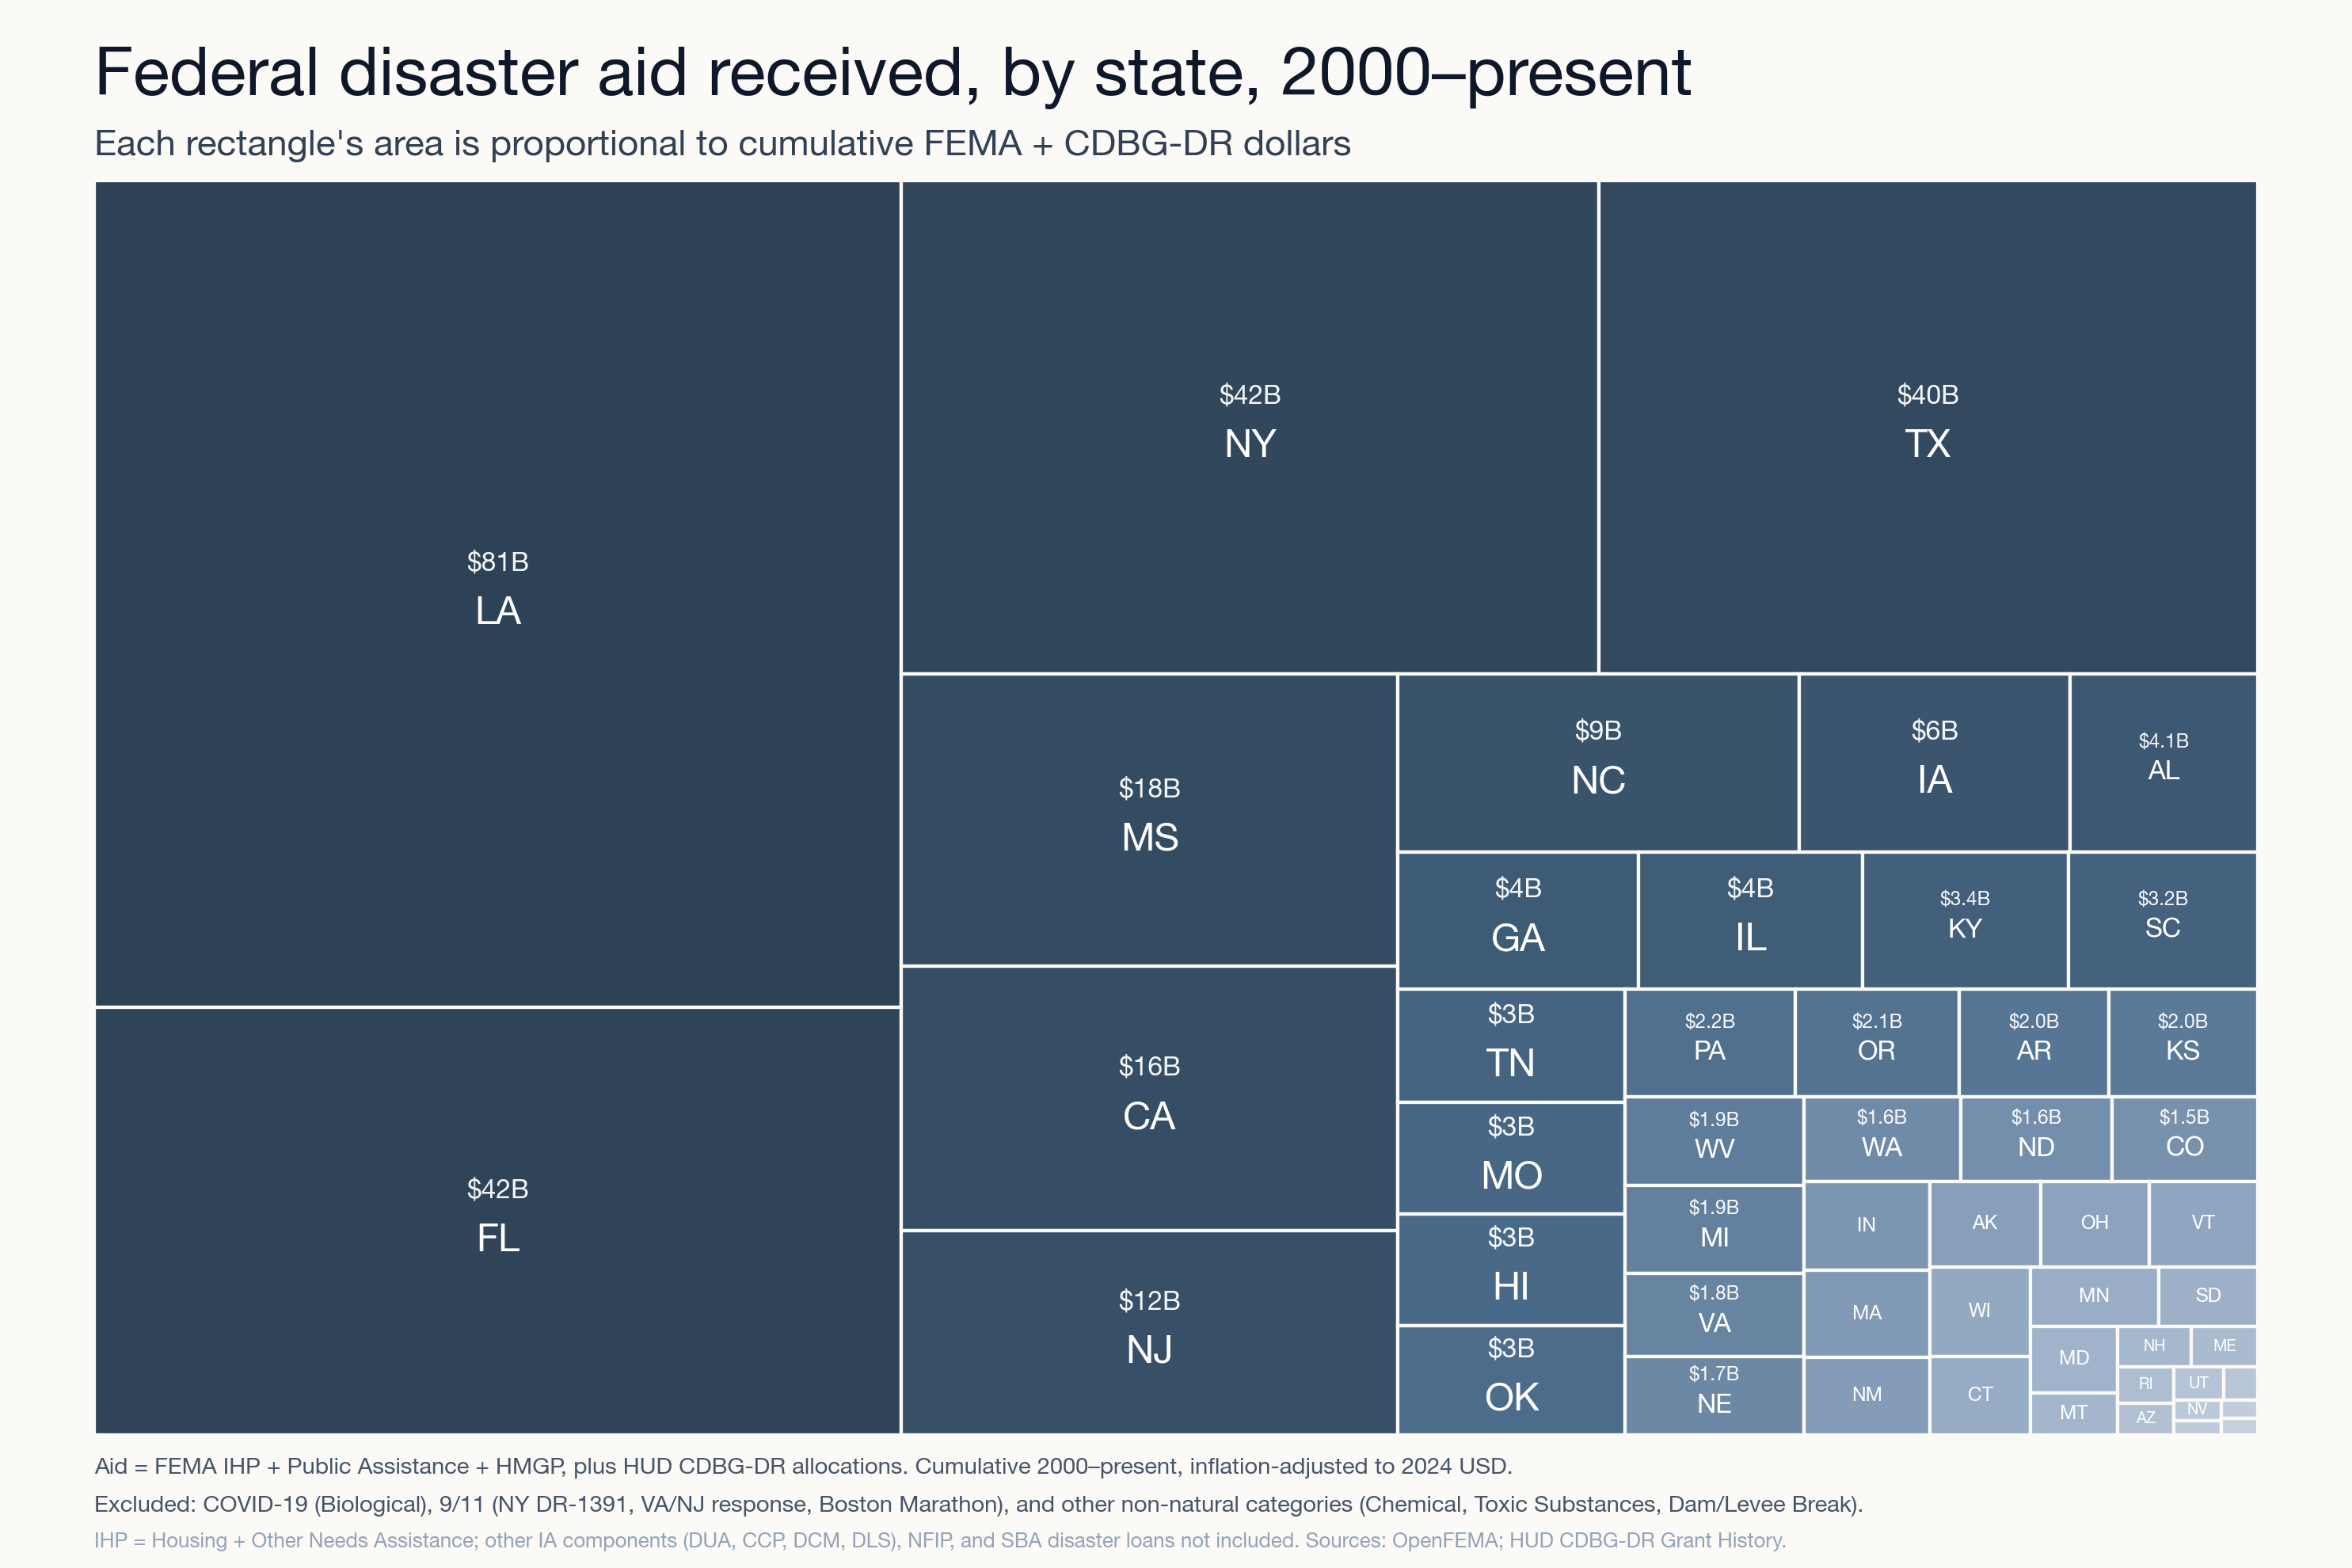
Not surprisingly, we see Gulf Coast states like Louisiana, Florida and Texas accounting for the majority of spending…hurricanes are quite costly. Together with New York, Gulf states accounted for ~$227 billion of the $331 billion of federal disaster spending, or about 69%.
I was also curious how disaster aid tracks (or doesn’t track) the political leaning of each state. Do red or blue states receive greater amounts of aid, i.e. does a state’s political leanings predict the relative amount of federal monies they receive? I mapped the above disaster aid amounts (per-capita) against the political leaning of each state, as measured by the share of votes that President Trump or Vice President Harris received in 2024. This is a VERY imperfect way of answering the question, for a bunch of reasons - political lean changes over time, for instance, and some states (like Ohio or Virginia) voted differently earlier in the period under study versus 2024. Nevertheless I thought the findings were interesting:
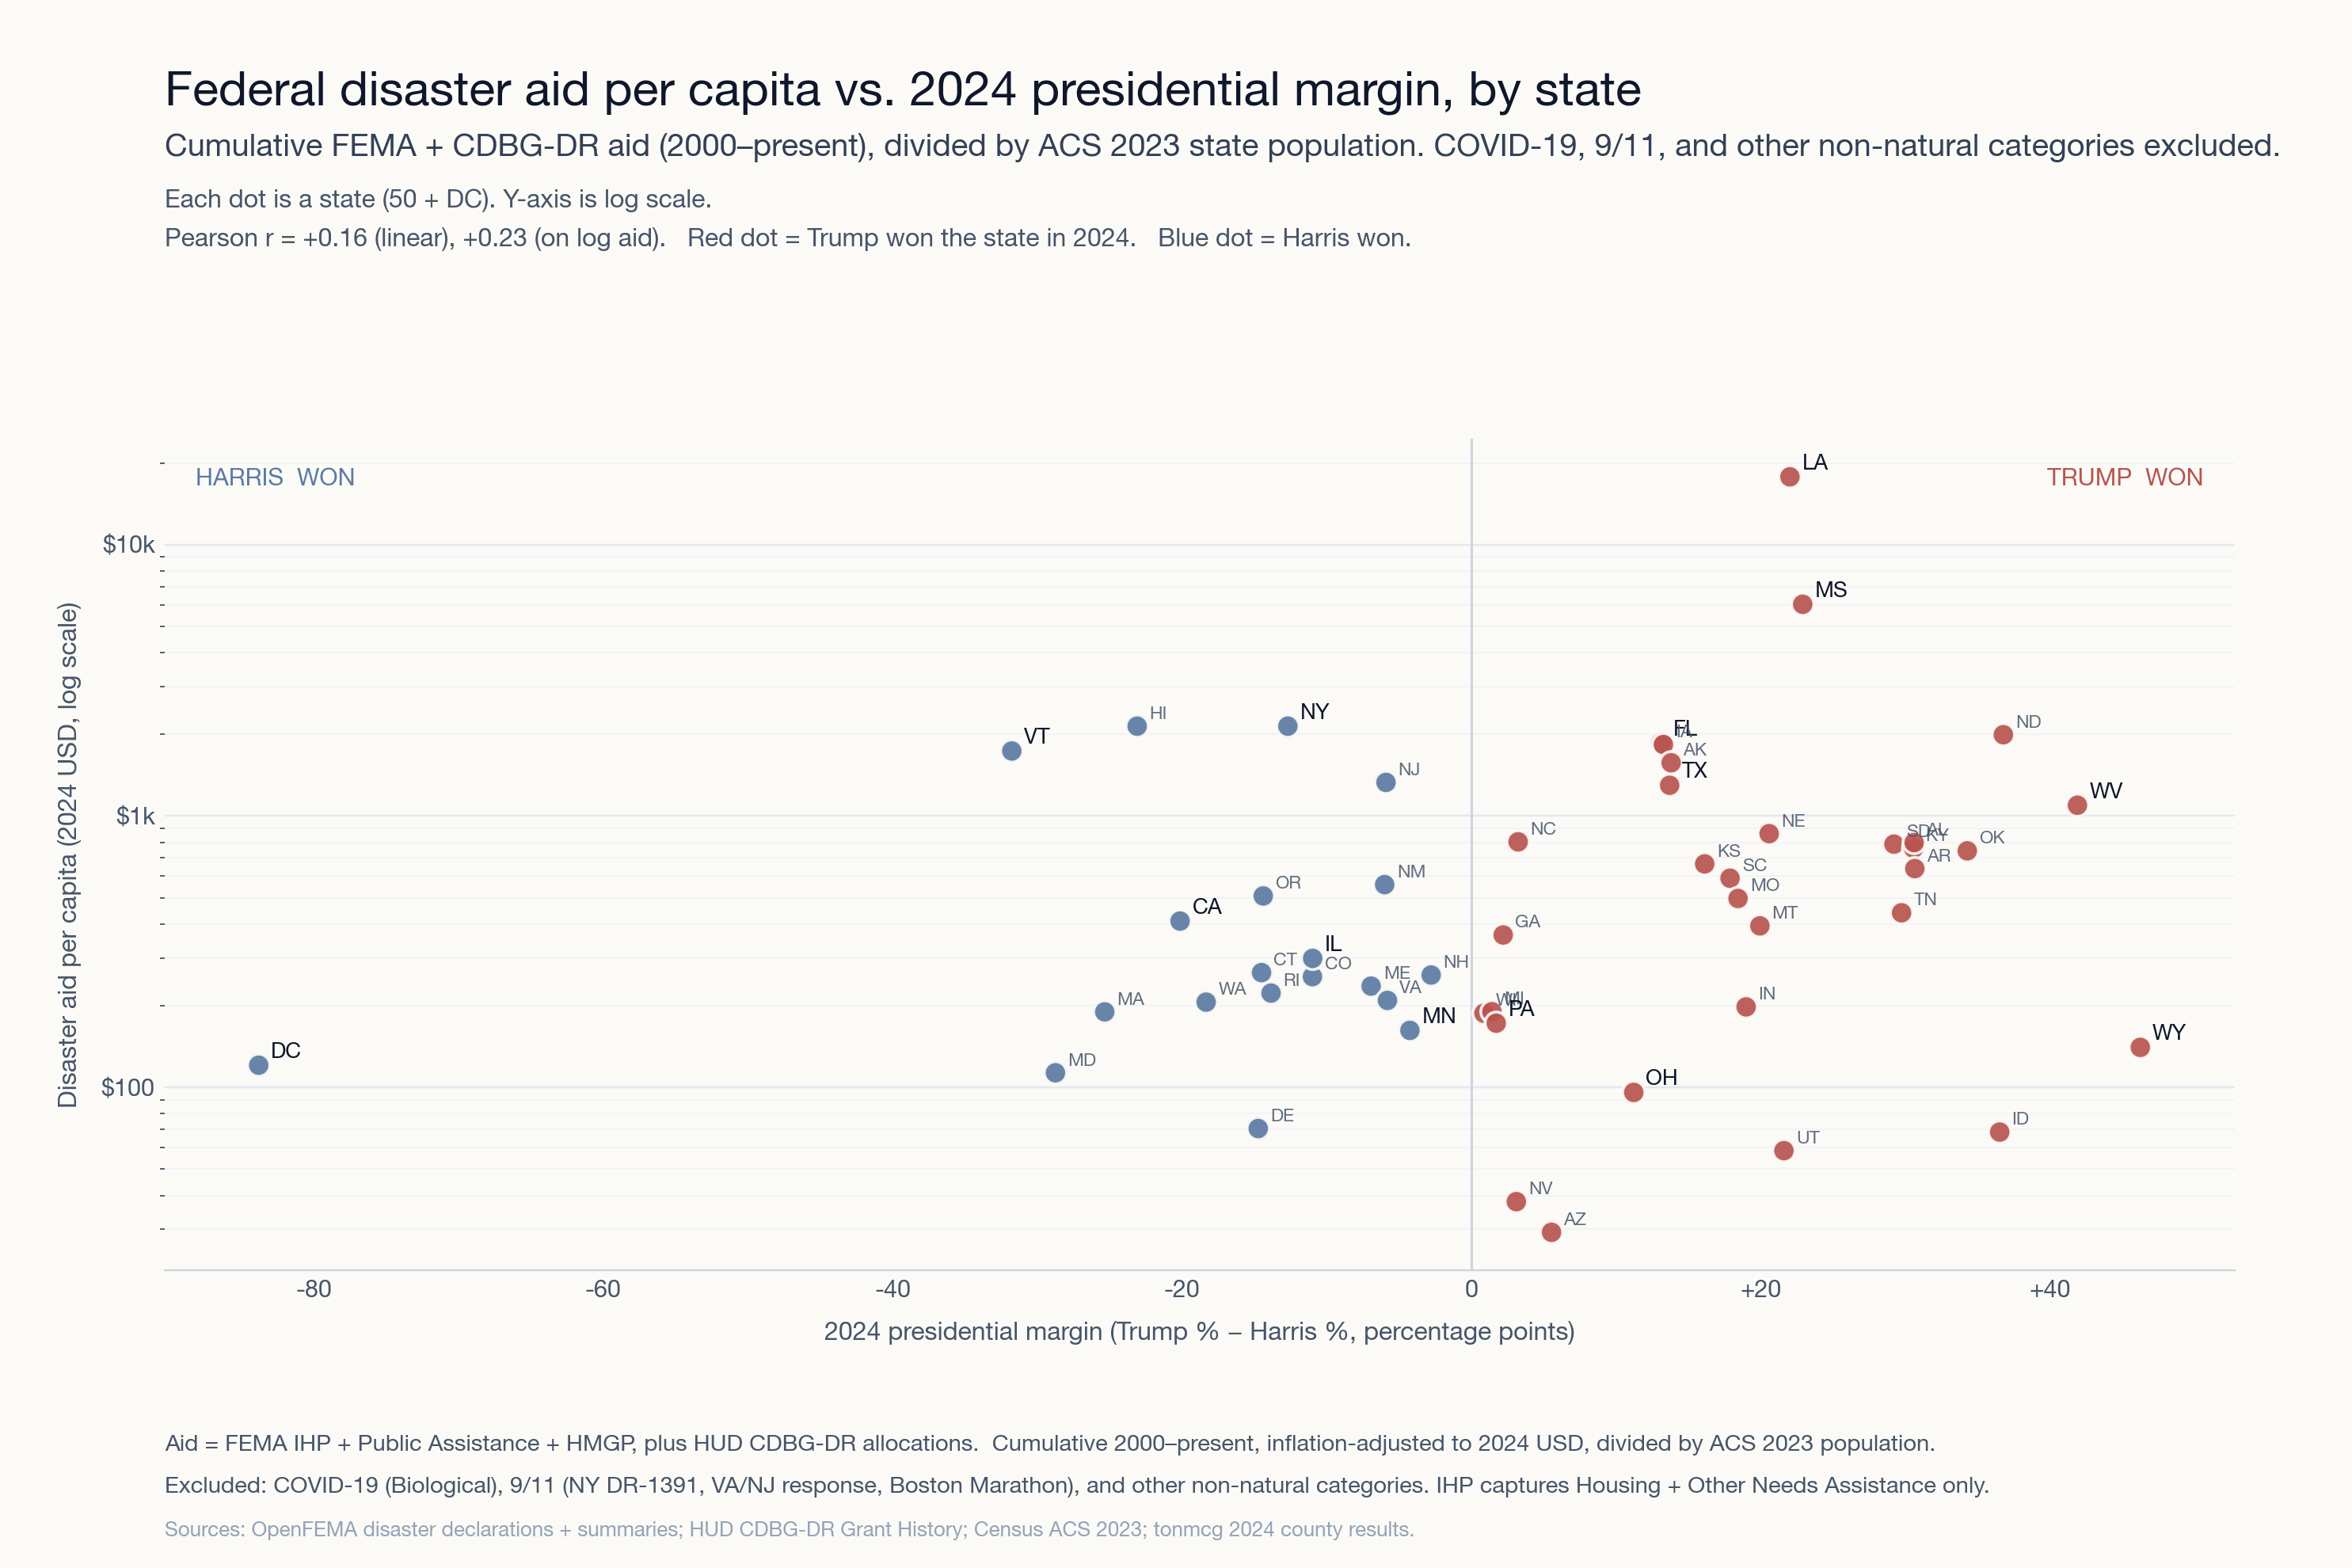
As you can see, the state-level correlation with 2024 Trump margins and per-capita aid is weak but positive (Pearson r linear scale is +0.156, log scale is +0.230). The driver of that relationship appears to be geography and not partisan allocation of disaster aid, however. Gulf States and those in Tornado Alley (Kansas, Oklahoma, Iowa and Nebraska) are the places where many of the costliest disasters occur, and are also deep red. When you put other disaster aid in the mix, like COVID and 9/11, there is no meaningful difference.
Now to the headline question…which states are disaster donors and recipients? For this analysis I pulled additional data from the Internal Revenue Service (IRS), specifically gross collections by state for fiscal years 2000-2024. After adjusting for inflation (to 2024 dollars), the 50 states + the District of Columbia paid about $100 trillion to the federal government over that period, compared to spending $331 billion on disaster aid. That means that for every $100 in federal tax revenue, we spend about $0.33 on disasters.
Two caveats, one major and one minor:
I used gross tax collections, meaning that dollars are attributed to whatever state the tax return was filed from. Since many large companies are based in states like Delaware, New York and California, there is an HQ Bias that inflates those states’ share of tax contributions (versus spreading those revenues out over the many states where those companies actually operate).
There is a mismatch between the IRS fiscal year and the FEMA/CDBG-DR reporting that is calendar year.
And here are the results:
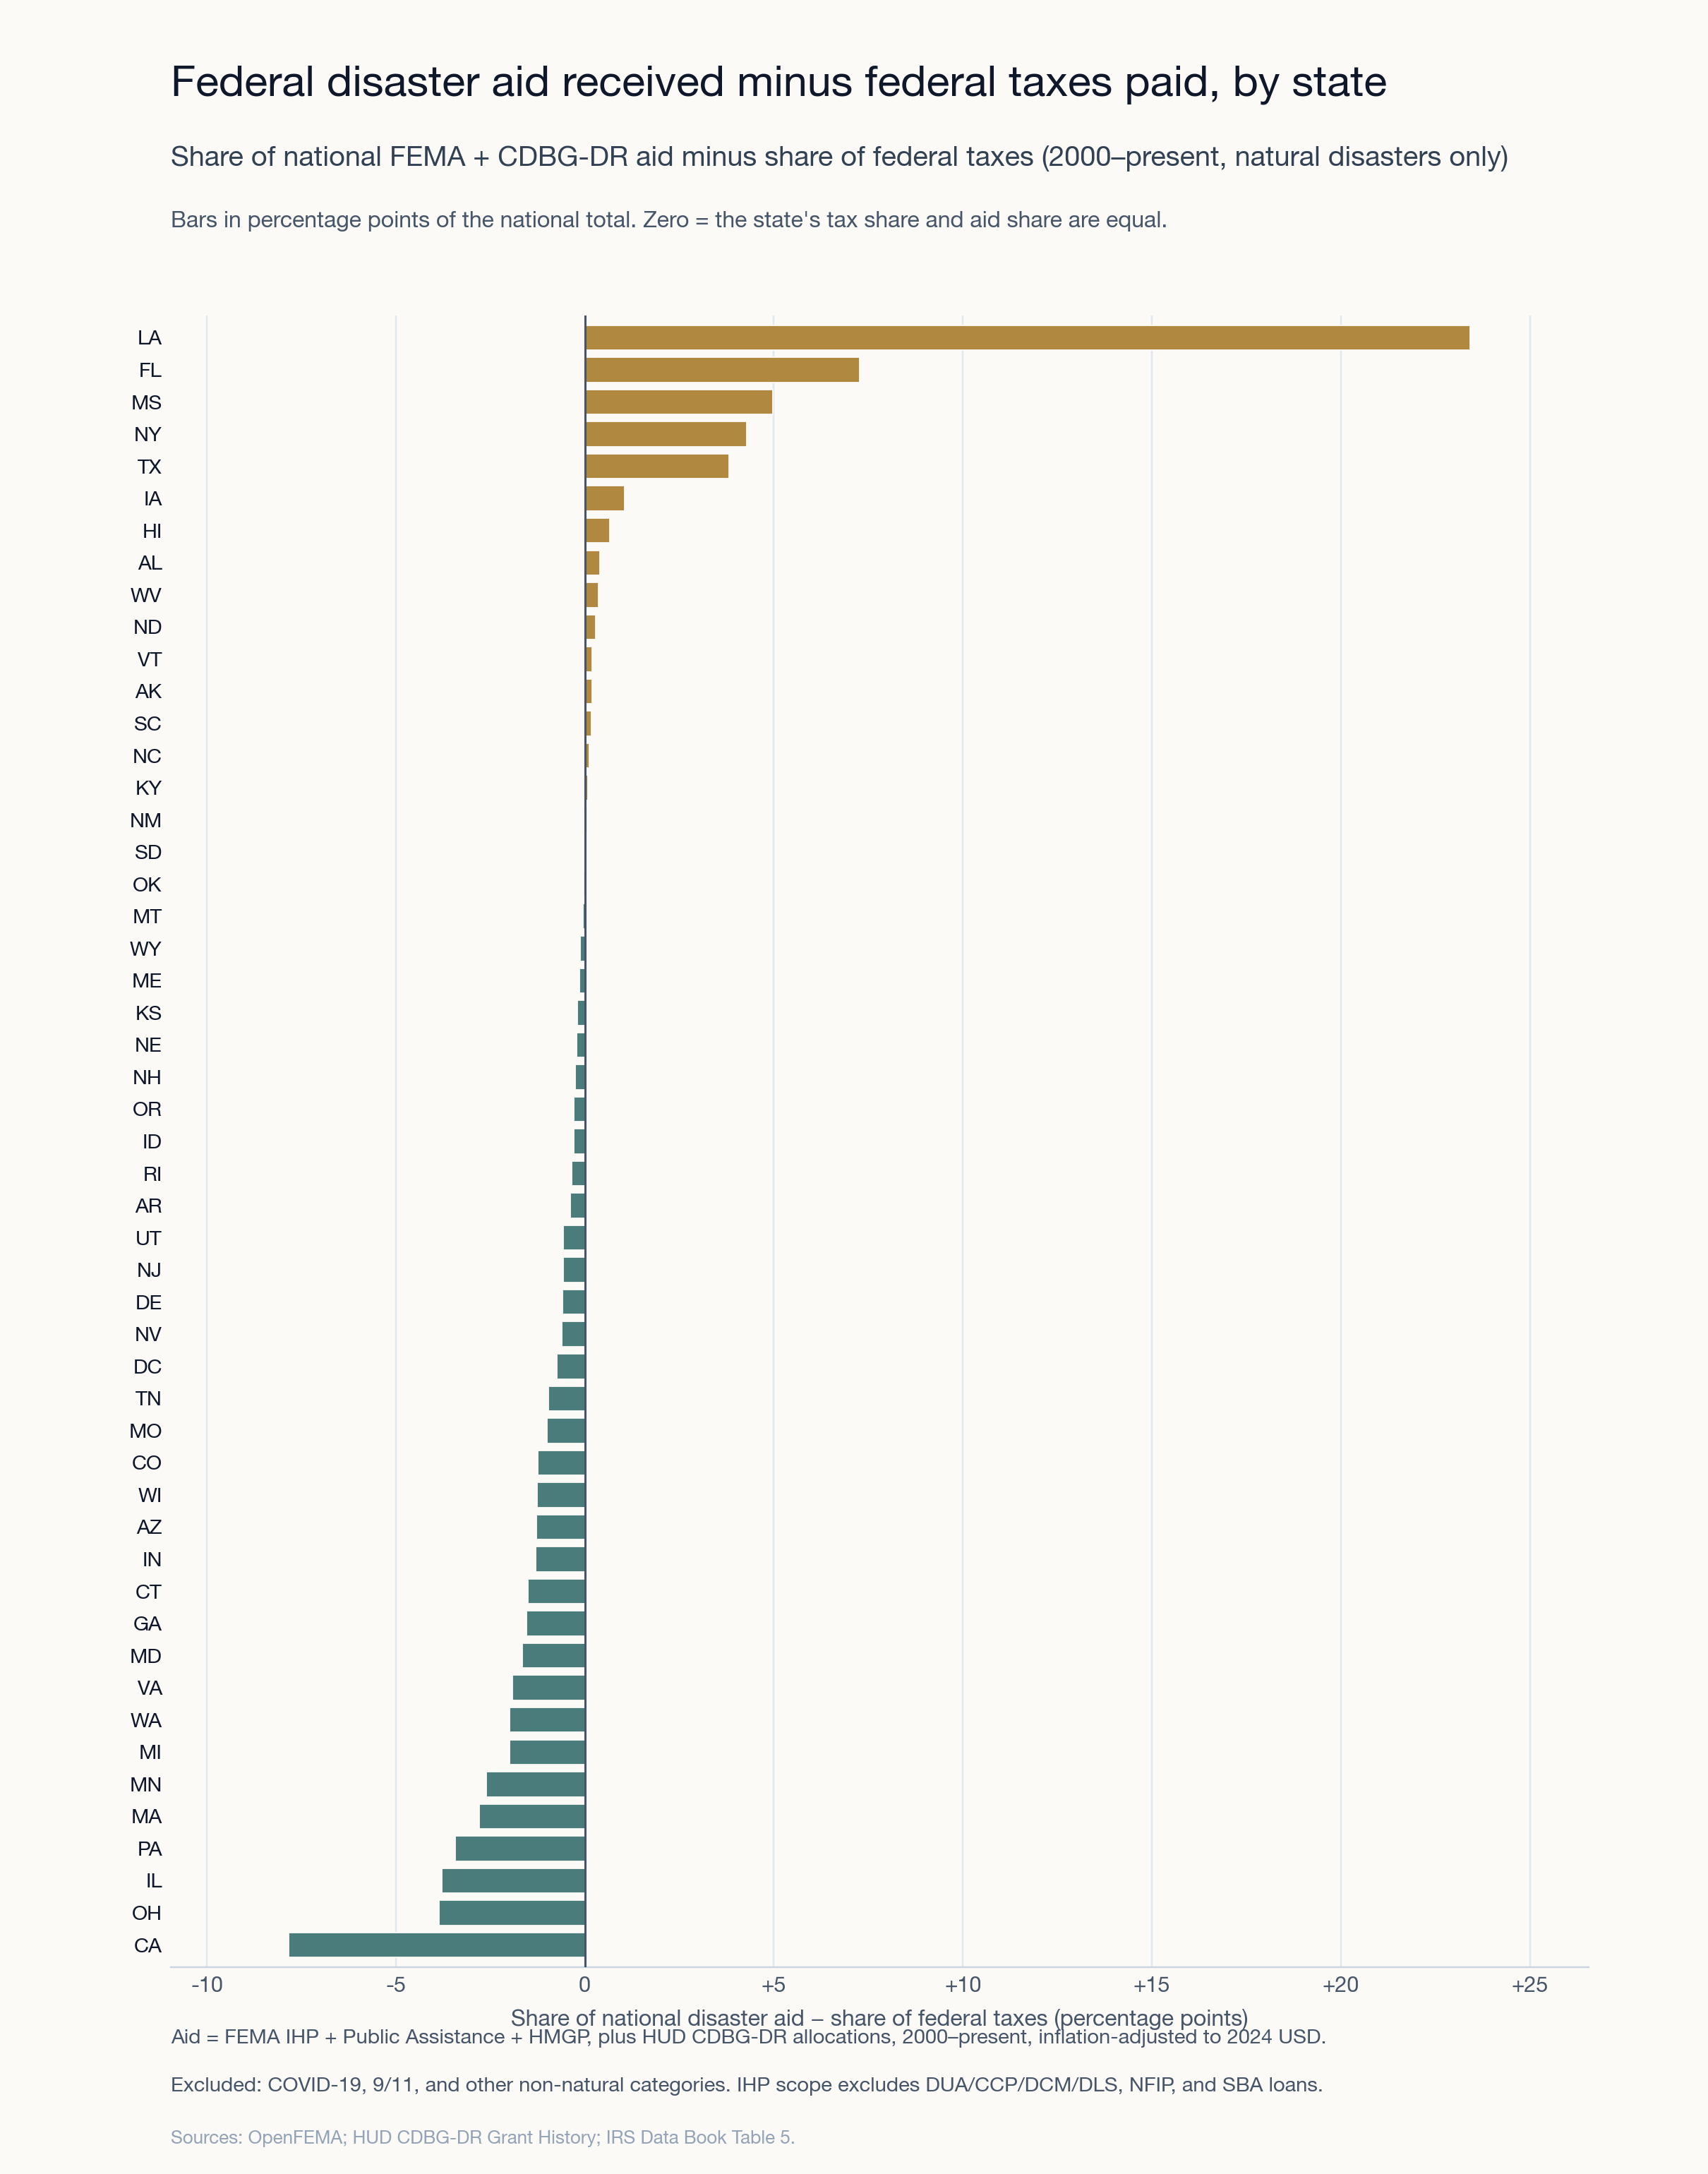
As you can see, states in the Gulf Coast dominate the recipient side of the graph. Louisiana, for instance, received $24.59 of every $100 in federal disaster aid since 2000. It also received $6.99 in disaster aid for every $100 it paid in federal taxes, which is 21x the national average of $0.33. Texas received $11.98 of every $100 in federal disaster aid, but given its much larger tax base that is only $0.49 of every $100 it paid in federal taxes.
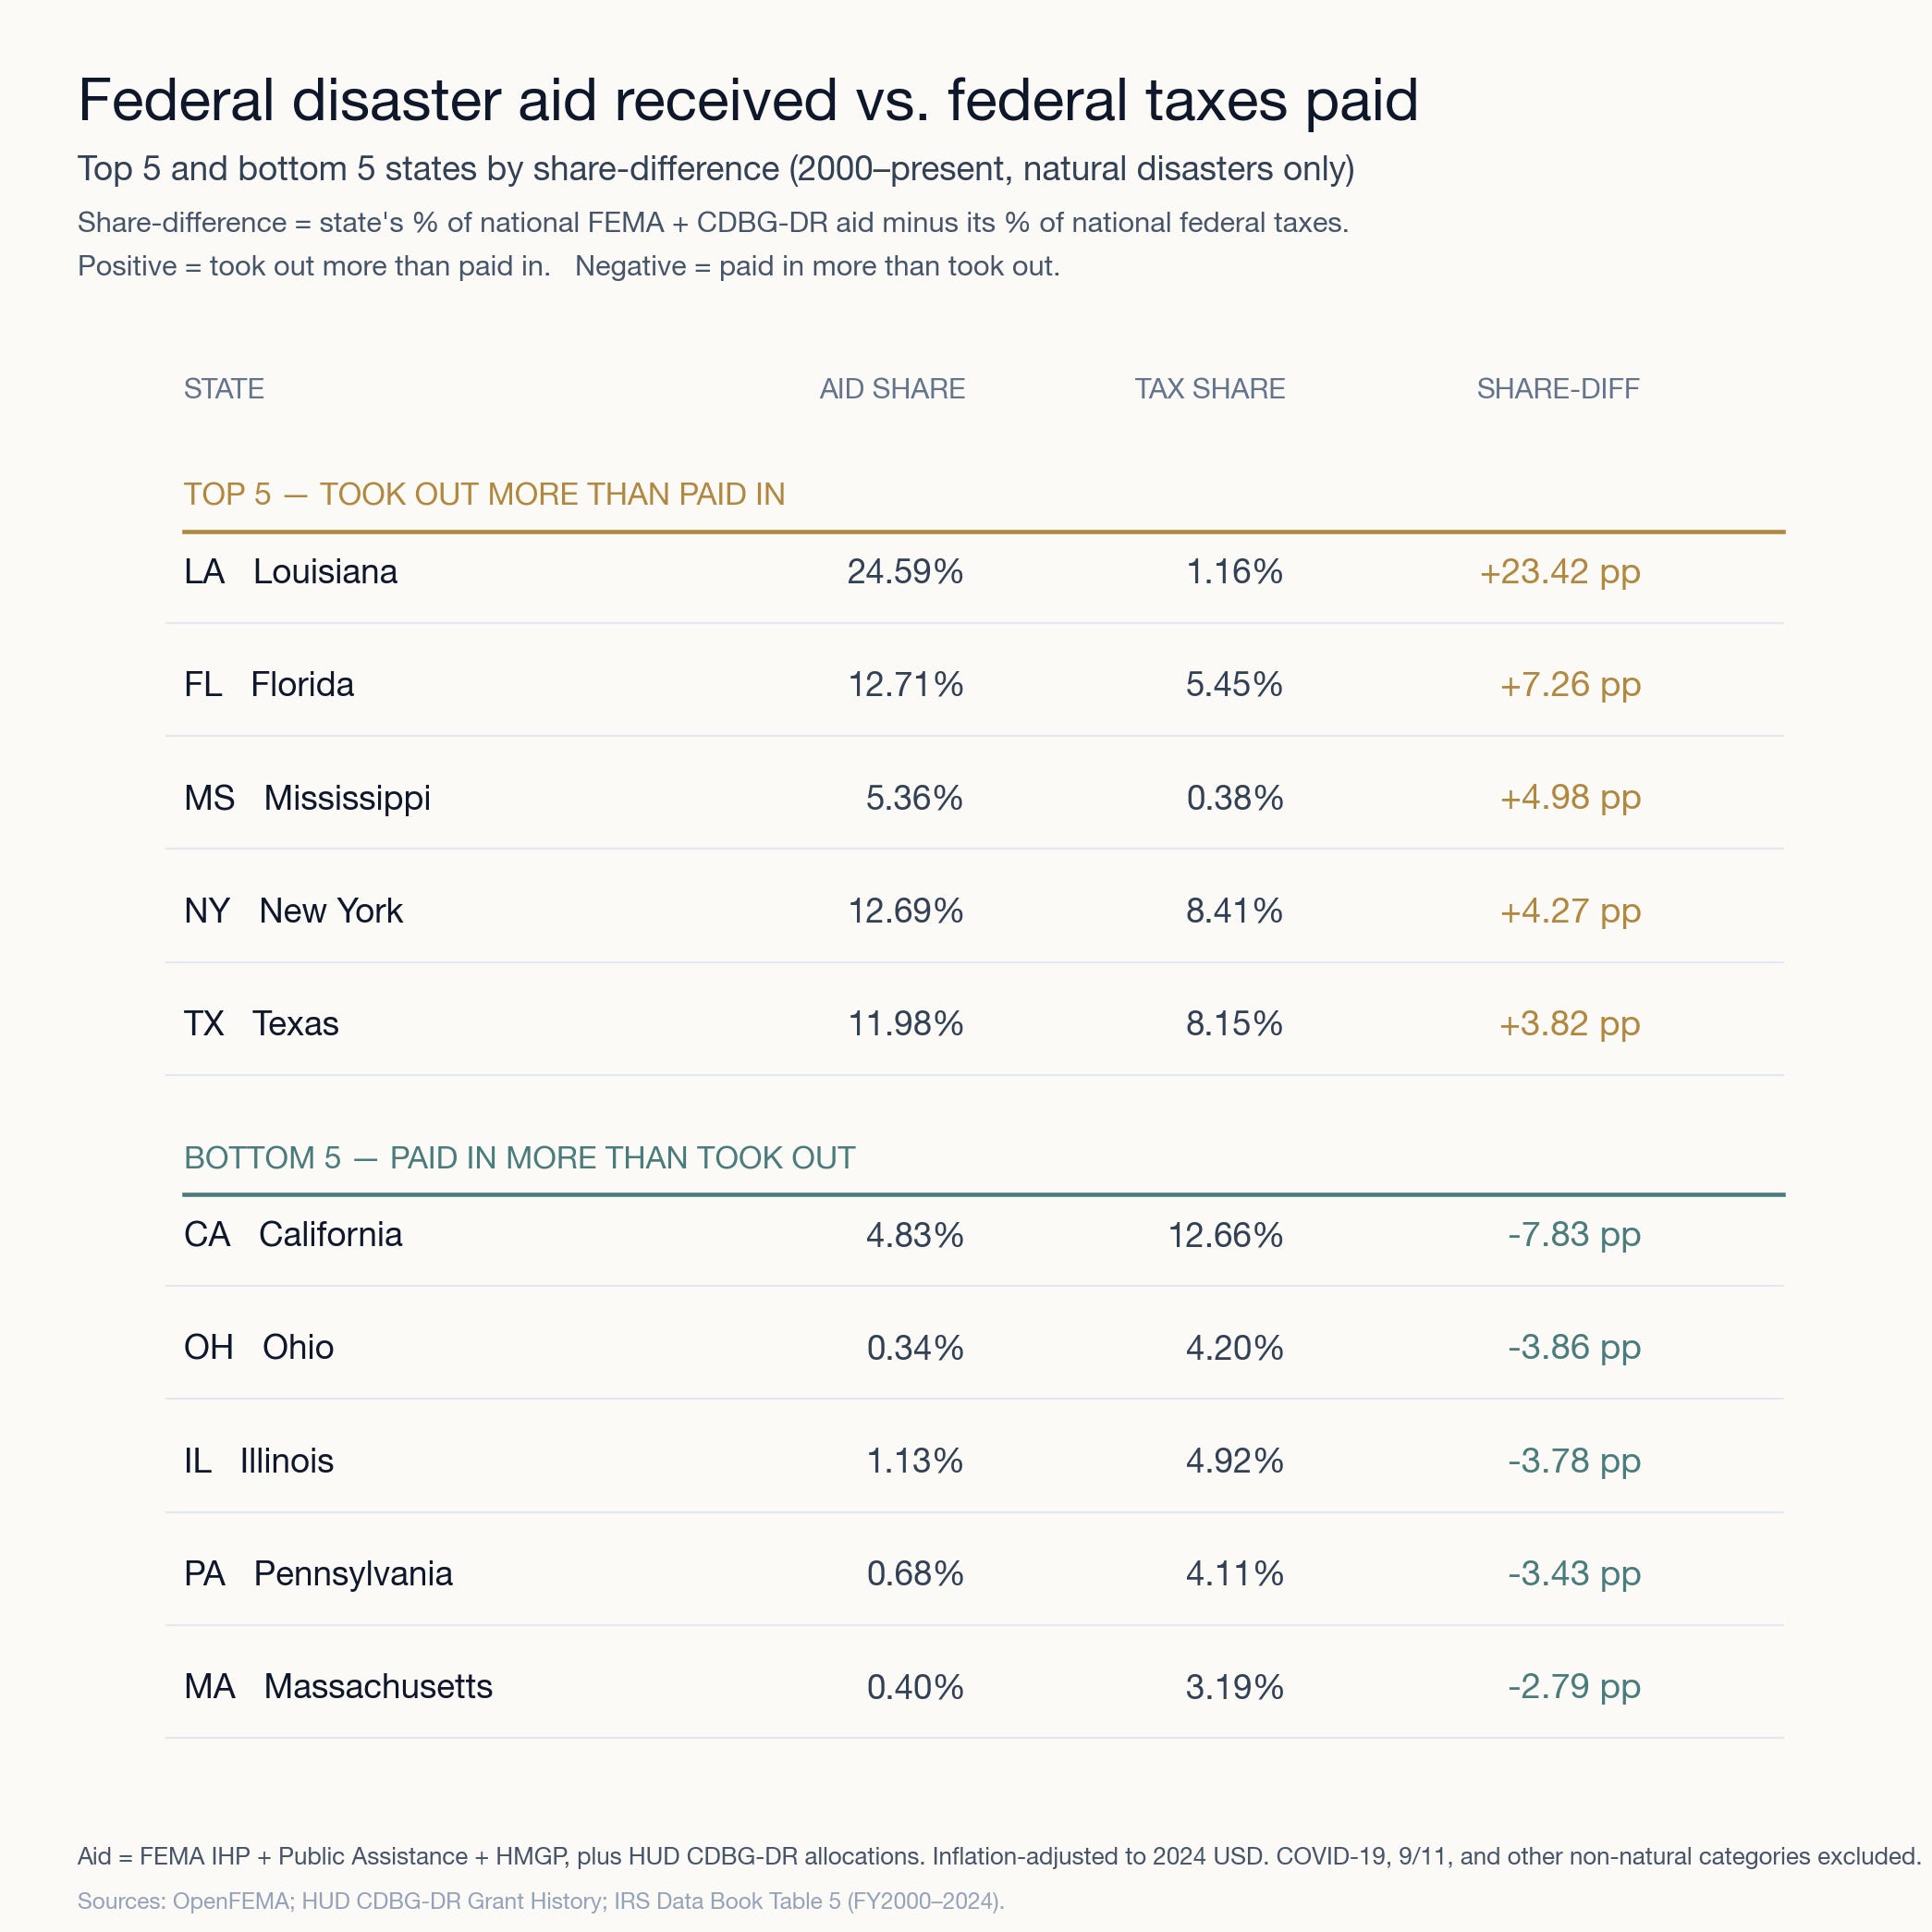
States like California, Ohio and Illinois are net donor states. Ohio received just $0.34 of every $100 in disaster aid from 2000-2024 - not surprising since its largest disaster during that period was a 2005 storm that cost $183 million (DR-1580).
I’m looking forward to conversation around this analysis. How do these results match with your assumptions? What further tests would be interesting?
For me, I’d love to update this article with a longer time horizon and some additional sources of federal aid thrown in. I am particularly interested in the Texas and New York numbers...Hurricanes Sandy and Harvey were both generational events, but Sandy had much higher infrastructure costs (paid by PA) compared to Harvey, which was hugely impactful on residential housing. I’d like to know how including NFIP and SBA might shift the story.
Still reading? Then please consider liking and sharing this post…it brings new readers to Place + Resilience. And thanks!
AI Statement
I used Anthropic's Claude Code, a coding tool, to help pull data, conduct analysis, and produce graphics for this article. I selected the data sets, provided the analytical logic, and validated the findings by spot-checking them against manual downloads from FEMA and the IRS. I did not use AI to conceive, write, or edit the article.
Have questions or want to talk further? Contact me.
Comments
Nothing yet. Say the first thing.
Sign in to join the conversation.