
I’ve been working on this post for a long, long time. It started back in 2025 with a basic question that many have asked: what are all the sources of recovery funding after a large-scale disaster? Disaster professionals are familiar with funding sources near their areas of expertise, i.e. they know the shape of their part of the elephant. For emergency managers, that means FEMA individual and public assistance programs and their state and local counterparts. For housers, HUD and SBA provide the largest and most important sources of grants and loans. And for non-profits, philanthropies and private donors are often key sources for funds. But how do all of these parts add up? What is the complete picture of funding after large-scale events, and what is the relative share of responsibility between different stakeholders?
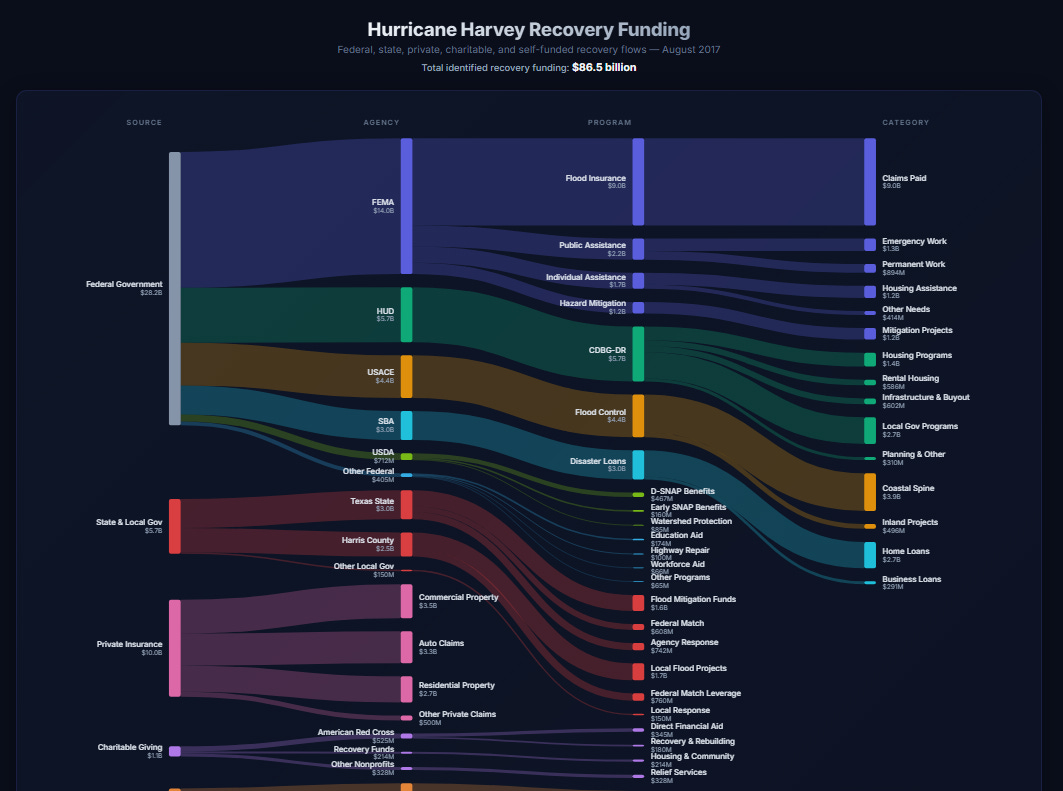
Surprisingly, I had a difficult time finding an example of this kind of analysis. So I decided to take a swing at one myself focusing on Hurricane Harvey, using a whole lot of Google searching and - more recently and blessedly - with the assistance of an agentic AI (Claude Code). The result is an interactive Sankey diagram of $87 billion in recovery costs that I was able to identify, flowing from the pockets of disaster survivors and from the federal government, state and local governments, private insurers, and charitable sources. I am not claiming that this list is exhaustive…I am sure there are things that I missed. I am also not claiming that it is particularly accurate…surely I made mistakes and misinterpreted things. But I think I am getting pretty close to a rough picture, at least as it stands today and about 8.5 years after the storm.
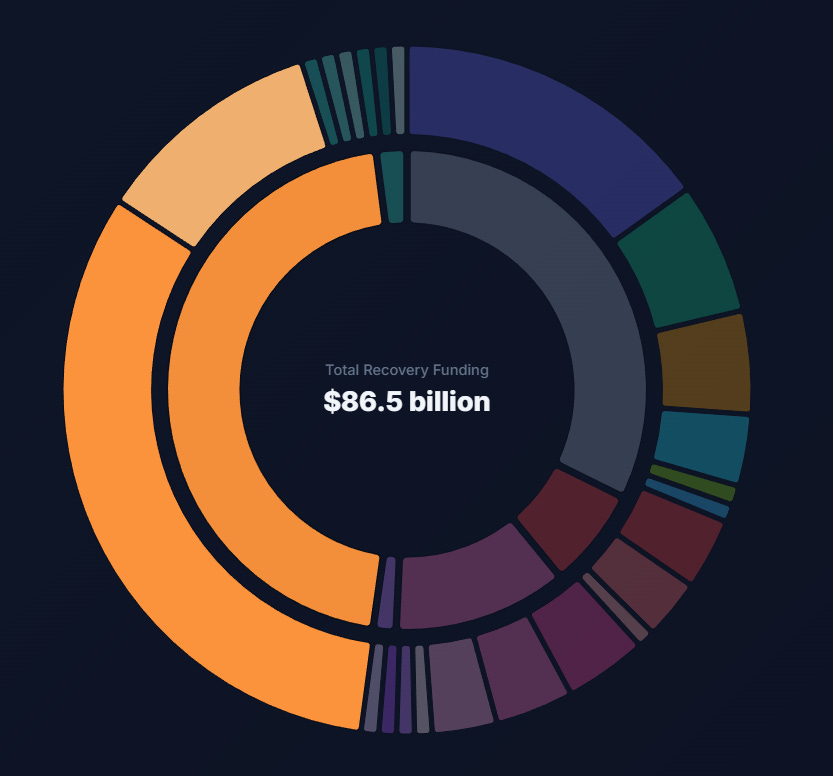
Here is another view of the same data:
A few observations and comments on methodology:
The largest source of recovery funding is disaster survivors themselves, estimated at $40 billion. These estimates are the most speculative part of my analysis and are based on the total estimated costs of the disaster minus the known sources of recovery funding. I pegged this gap estimate firmly in the middle of the range between $30-$55 billion.
It is important to note that we don’t know if this money was actually spent, i.e. this estimate is for unmet needs and assumes they were met using out-of-pocket funds. In reality some businesses shut down, some homes went unrepaired, people declared bankruptcy, etc.
Likewise it does not include the kinds of person-to-person giving or lending that likely occurred. For example, we have no idea how many Go Fund Me campaigns brought money to Harvey survivors and reduced their out-of-pocket expenses. Likewise we do not know how many volunteer hours were committed to individuals and businesses, also reducing their actual need.
As expected, the federal government plays an outsized role in overall recovery spending, totaling nearly $30 billion. This compares to just $6 billion at the state and local level. It would be interesting to try and redo this analysis for a smaller disaster, to compare the overall balance between the two.
Charitable giving is a small piece of the recovery puzzle. This past year we have heard more about the need for private and philanthropic donors to “fill the gaps” left by FEMA as they seek to reduce their role in recovery. I think this analysis illustrates just how large that gap could be in an era of true federal retrenchment, and how unfair it is to expect philanthropies or corporate foundations to fill that gap.
And a few notes:
The sources for these data are linked in the tool tips when available online. Just hover over the ‘node’ on the Sankey and click on the blue link.
These numbers are in actual dollars spent at the time they were reported and are not inflation adjusted.
There is some risk of double-counting spending that served as a match and wasn’t well-broken out in the reporting of the program’s cost. This is one example among many of how this analysis should be taken for what it is, an imperfect analysis meant for generating conversation.
Have fun exploring! I hope this post yields some interesting discussion and questions. Please leave them in the comments below or on social media. Did I miss something important? Please contact me and I can update the analysis.
Enjoyed this fruit of a thousand Google searches? Please like the post by clicking the heart icon below, and share with your networks! It brings new readers to Place + Resilience. Always free, sometimes interesting, never boring.
Comments
Nothing yet. Say the first thing.
Sign in to join the conversation.