
For as long as I’ve been writing about permanent exclusions in England, commentators have consistently found a way to imply that the level of exclusions in England’s schools is at a record-breaking high. However, in the most recent annual figures, it might finally be true.
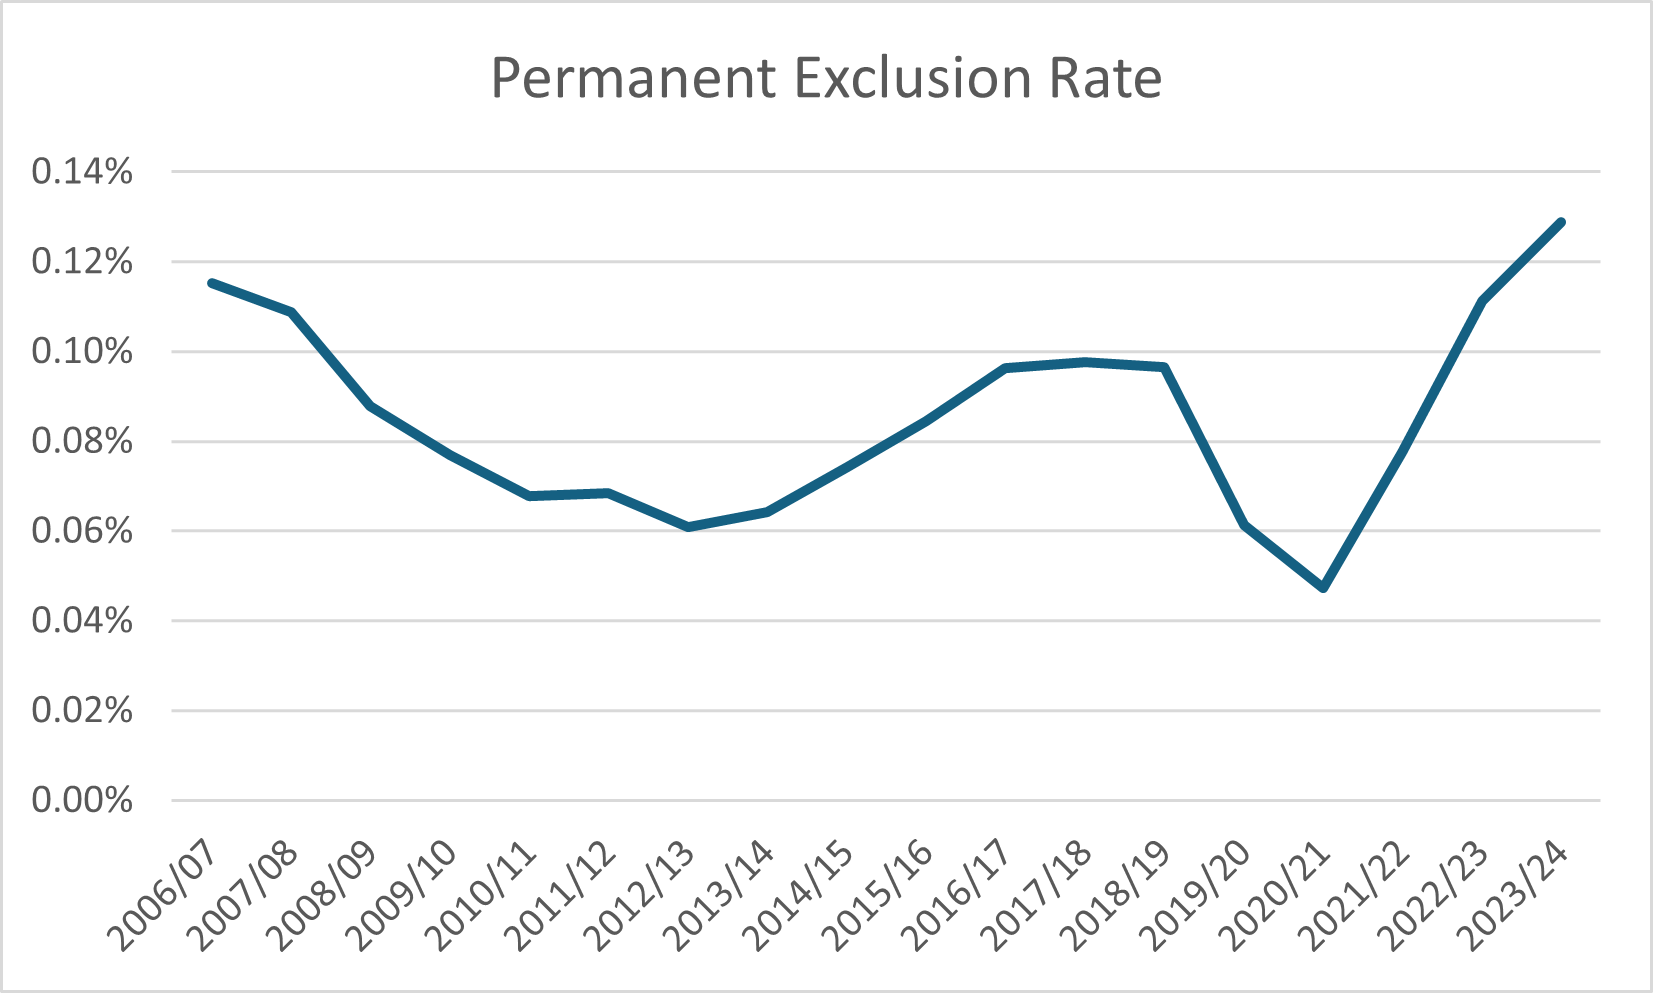
The rate of permanent exclusions has varied over time. This is not a remorseless rise; this is a massive shift that has happened only since Covid. The DfE website distorts this somewhat by referring back to a low point and claiming that:
Although permanent exclusions were relatively stable before the pandemic, the longer time trend over the past 10 years has been a gradual increase, from a low of 0.06 in 2012/13 to 2013/14.
We do have figures from before 2006/7, although they are raw numbers rather than percentages.1 They indicate that exclusions are not at their highest level ever, but are at their highest level of the 21st century
Keep reading with a 7-day free trial
Subscribe to Andrew Old's Education Battleground to keep reading this post and get 7 days of free access to the full post archives.
Comments
Nothing yet. Say the first thing.
Sign in to join the conversation.