

As the week unfolds, the charts tell a story of quiet tension and cyclical motion. Major forex pairs and Bitcoin seem to dance to a rhythm dictated by Fibonacci ratios and harmonic structures, each peak and trough hinting at decisions yet to be made. In this review, I take you through the patterns emerging across the markets — the setups that speak of potential moves, pauses, and reversals — and what they might mean for traders watching closely.
The GBPUSD pair confirmed a technical double bottom before encountering a significant resistance near the 161.8% Fibonacci extension, completing a bearish shark pattern at 1.3447. Following the pattern’s formation, price action displayed a modest pullback, finding temporary support near the 38.2% Fibonacci retracement level at 1.3386. The immediate downside target remains at the 50% retracement, around 1.3360, marking a potential inflection zone for short-term traders.
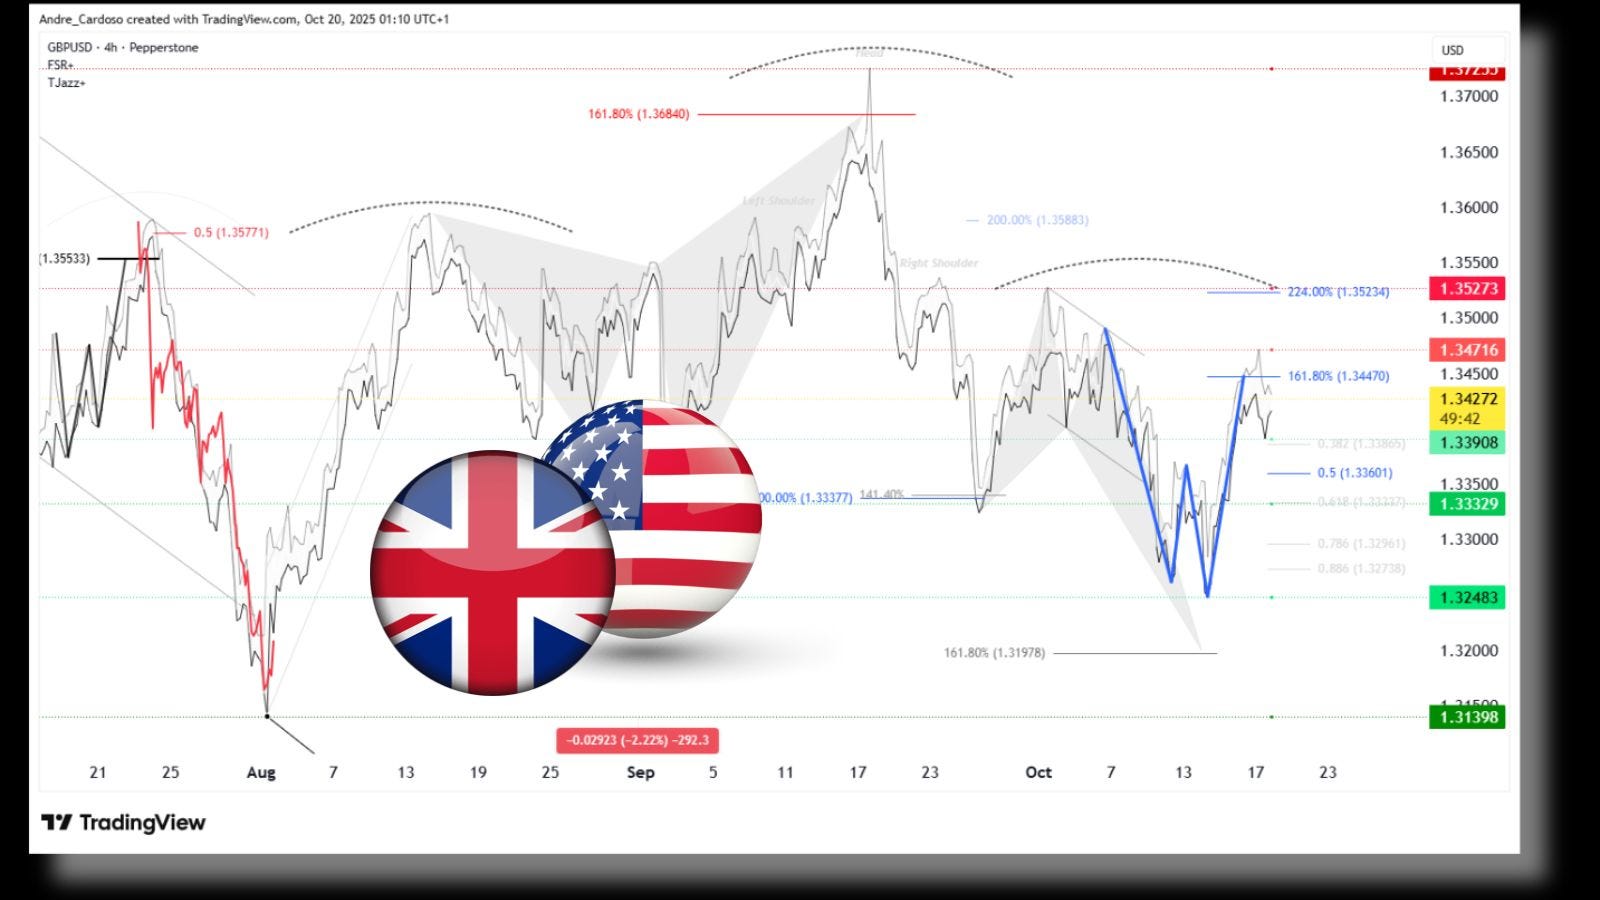
Despite this correction, the possibility of a renewed test toward the daily fractal resistance at 1.3527 cannot be ruled out. The pair’s momentum in the coming sessions will likely depend on how firmly the pound can hold above the 1.3360 level, as a break below could extend the bearish move toward deeper retracement zones.
The EURUSD pair completed a bearish crab pattern at 1.1715, triggering a corrective move that brought prices down to the 38.2% Fibonacci retracement at 1.1657. Should the pair extend further toward the 61.8% retracement at 1.1613, we may see a bullish 2618 trade setup emerging — a classical reversal opportunity in harmonic trading.
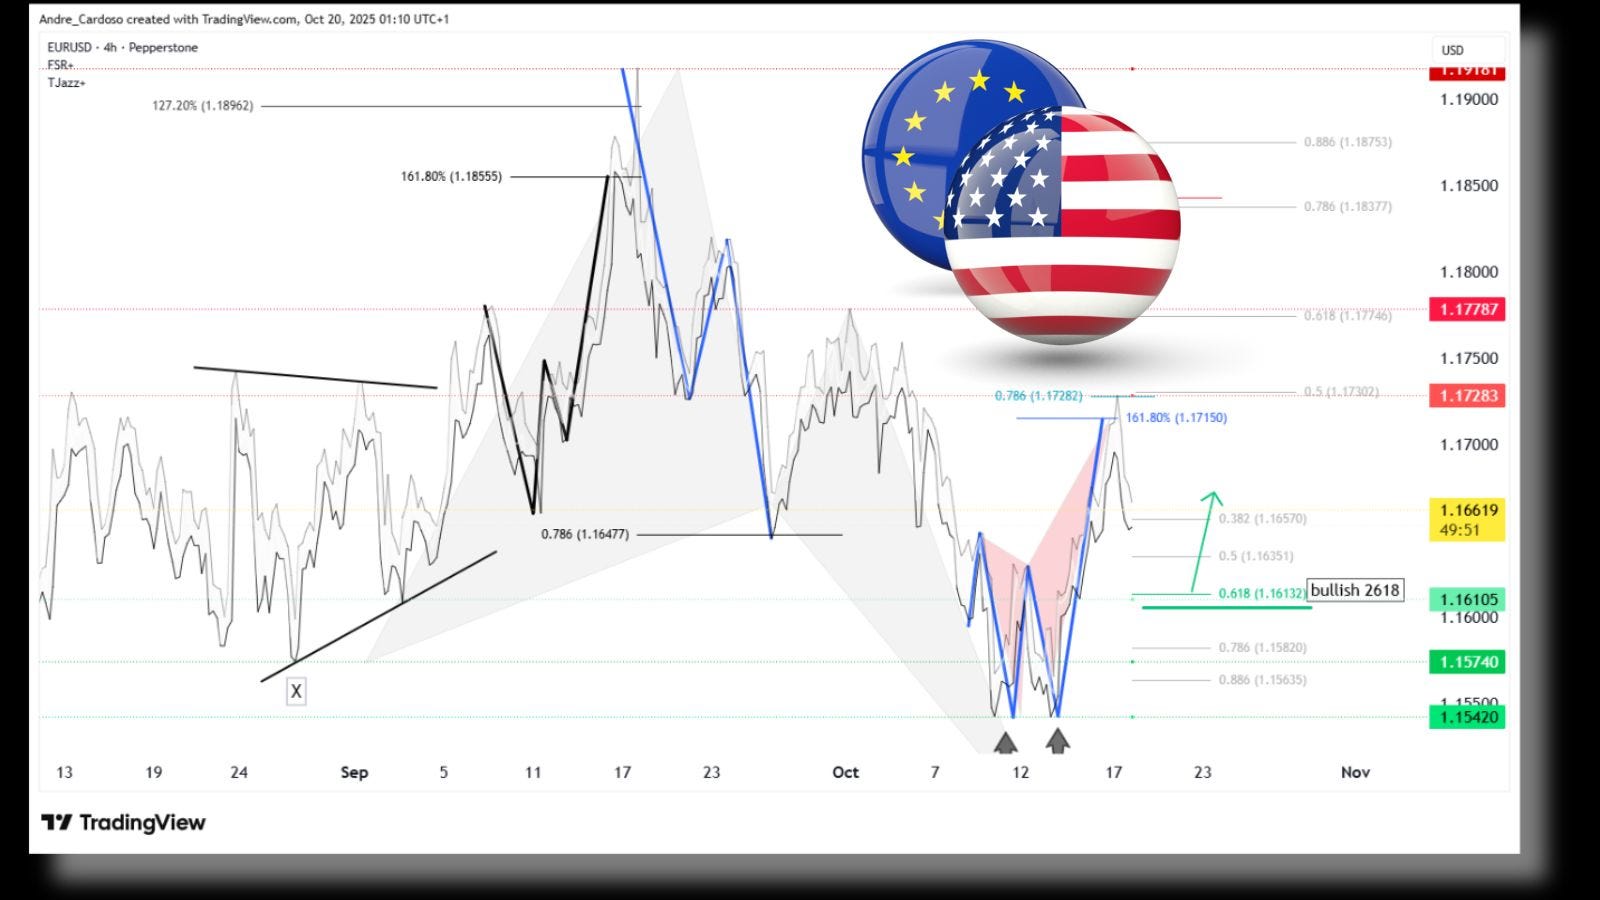
This potential bullish structure aligns closely with intraday support around 1.1610, a zone that could attract renewed buying pressure if defended successfully. However, a decisive break below the daily fractal support at 1.1542 would invalidate the bullish bias and likely signal a continuation of the broader downtrend.
The AUDUSD has been carving out a new daily fractal support near 0.6440, with a technical double bottom forming. The neckline resistance is positioned at 0.6523, and a breakout above this level could pave the way for a bullish move toward the 200% Fibonacci extension at 0.6600.
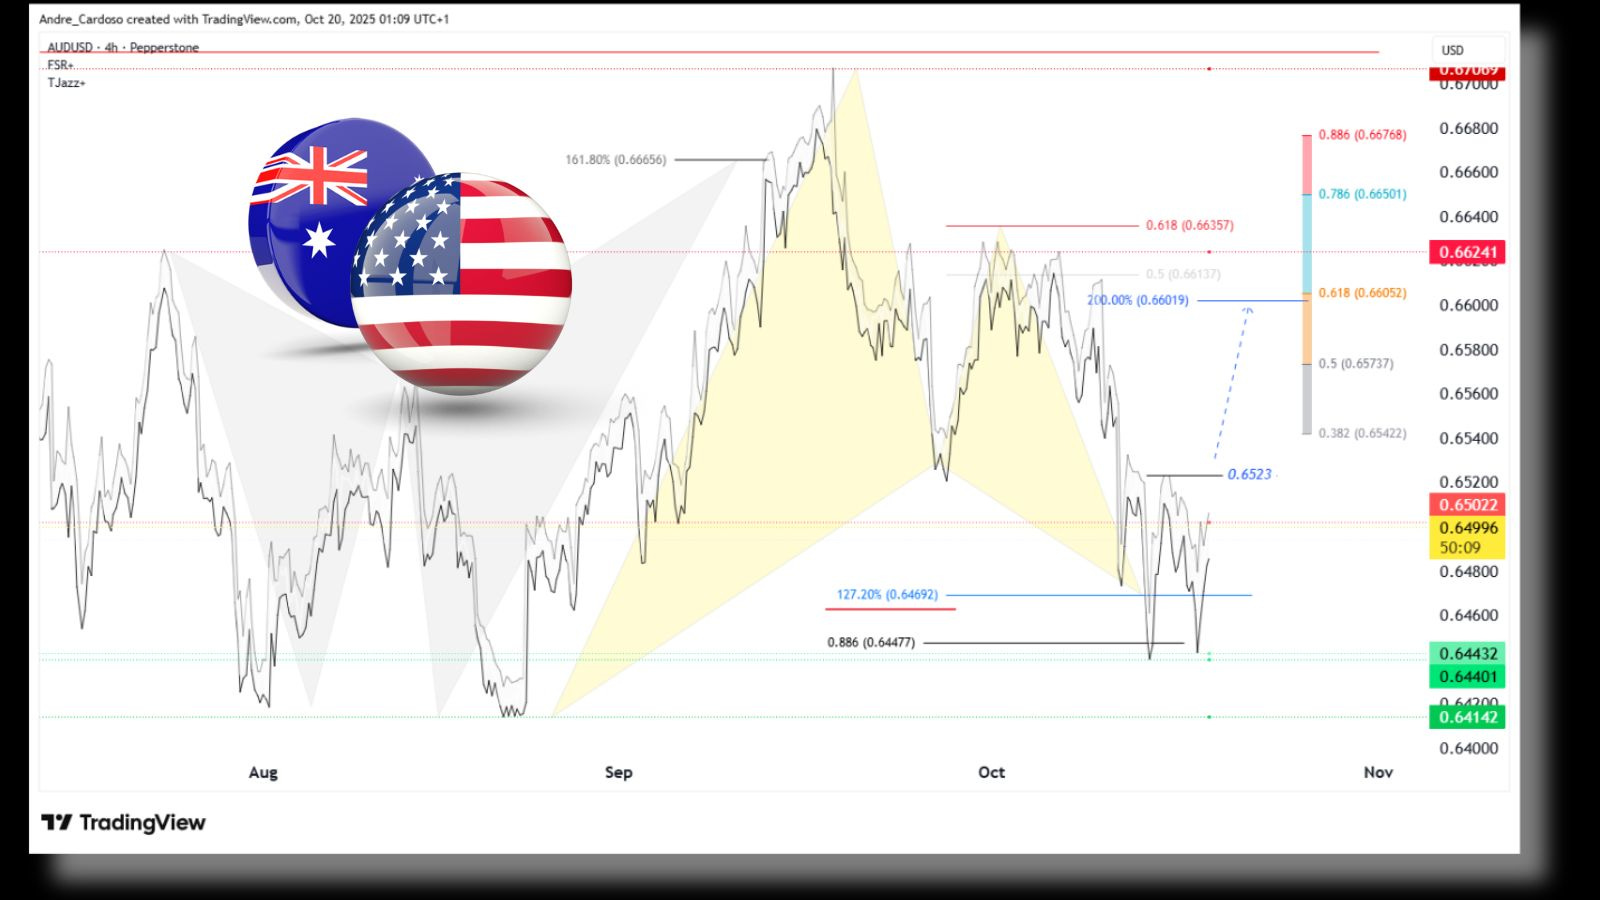
This area coincides with the 61.8% retracement zone, offering a strong technical confluence that could, eventually, attract more sellers. As long as the pair remains supported above the 0.6440 fractal, the near-term outlook leans cautiously optimistic for the Australian dollar.
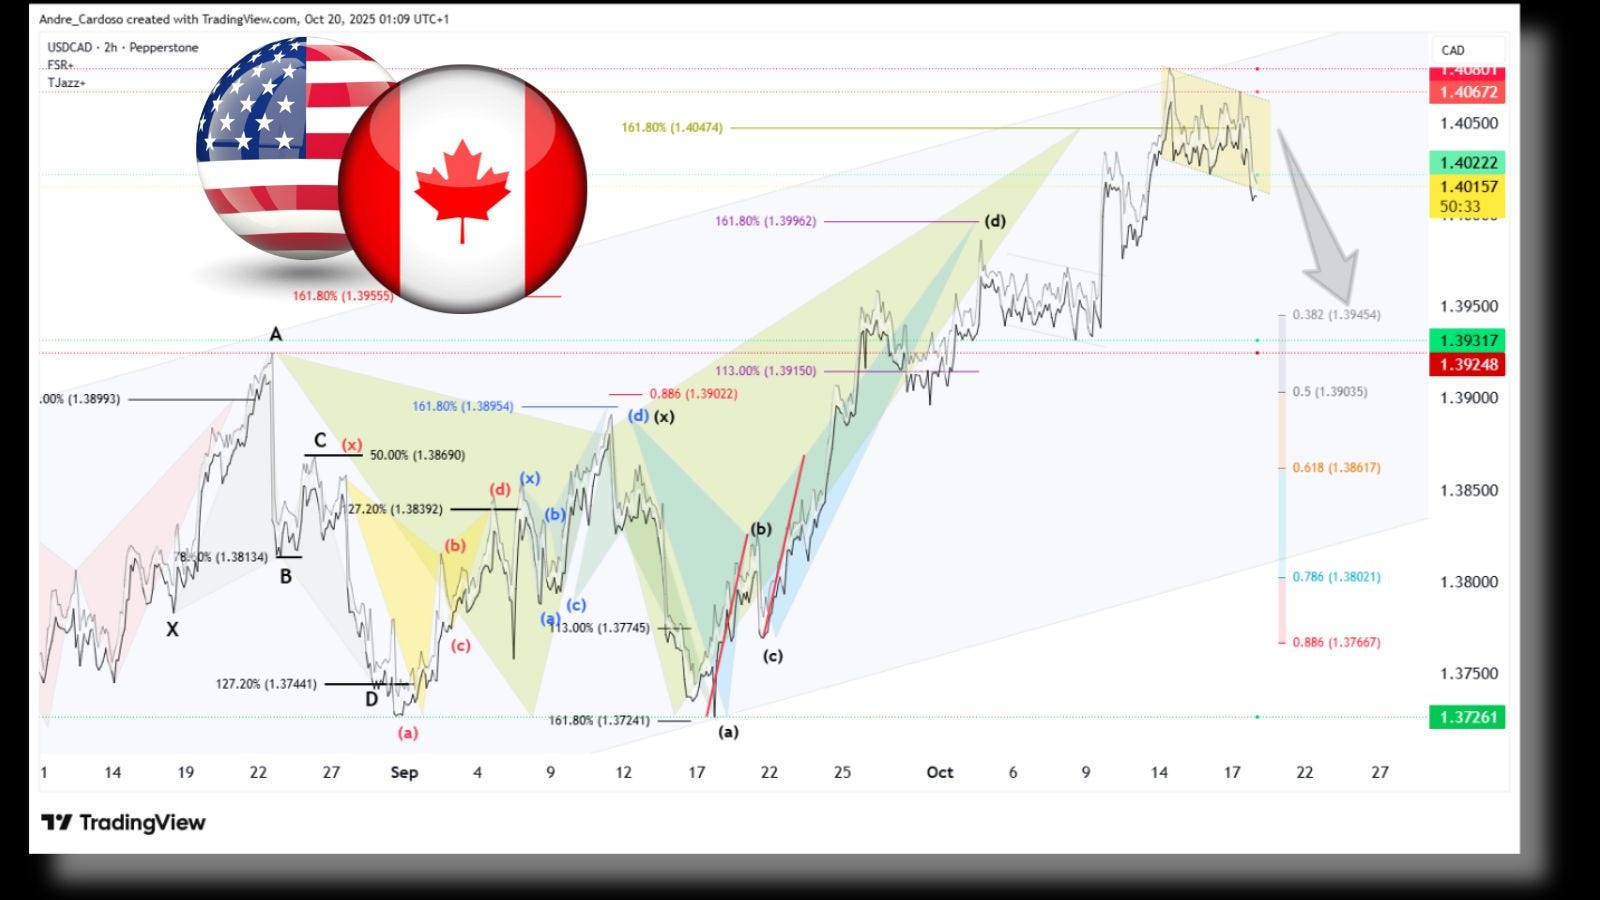
The USDCAD pair has formed a bearish crab pattern around 1.4047, aligning with the upper boundary of an ascending parallel channel that has been in place since late July. This convergence of resistance points to a possible downside reversal, with a target around 1.3945, which represents a previously confirmed resistance-turned-support level.
The USDNOK is trading close to the neckline of the head and shoulders pattern, a classic reversal structure that often signals an impending trend change. A completed neckline break could lead to a decline toward 9.940, aligning with the 200% Fibonacci extension level.
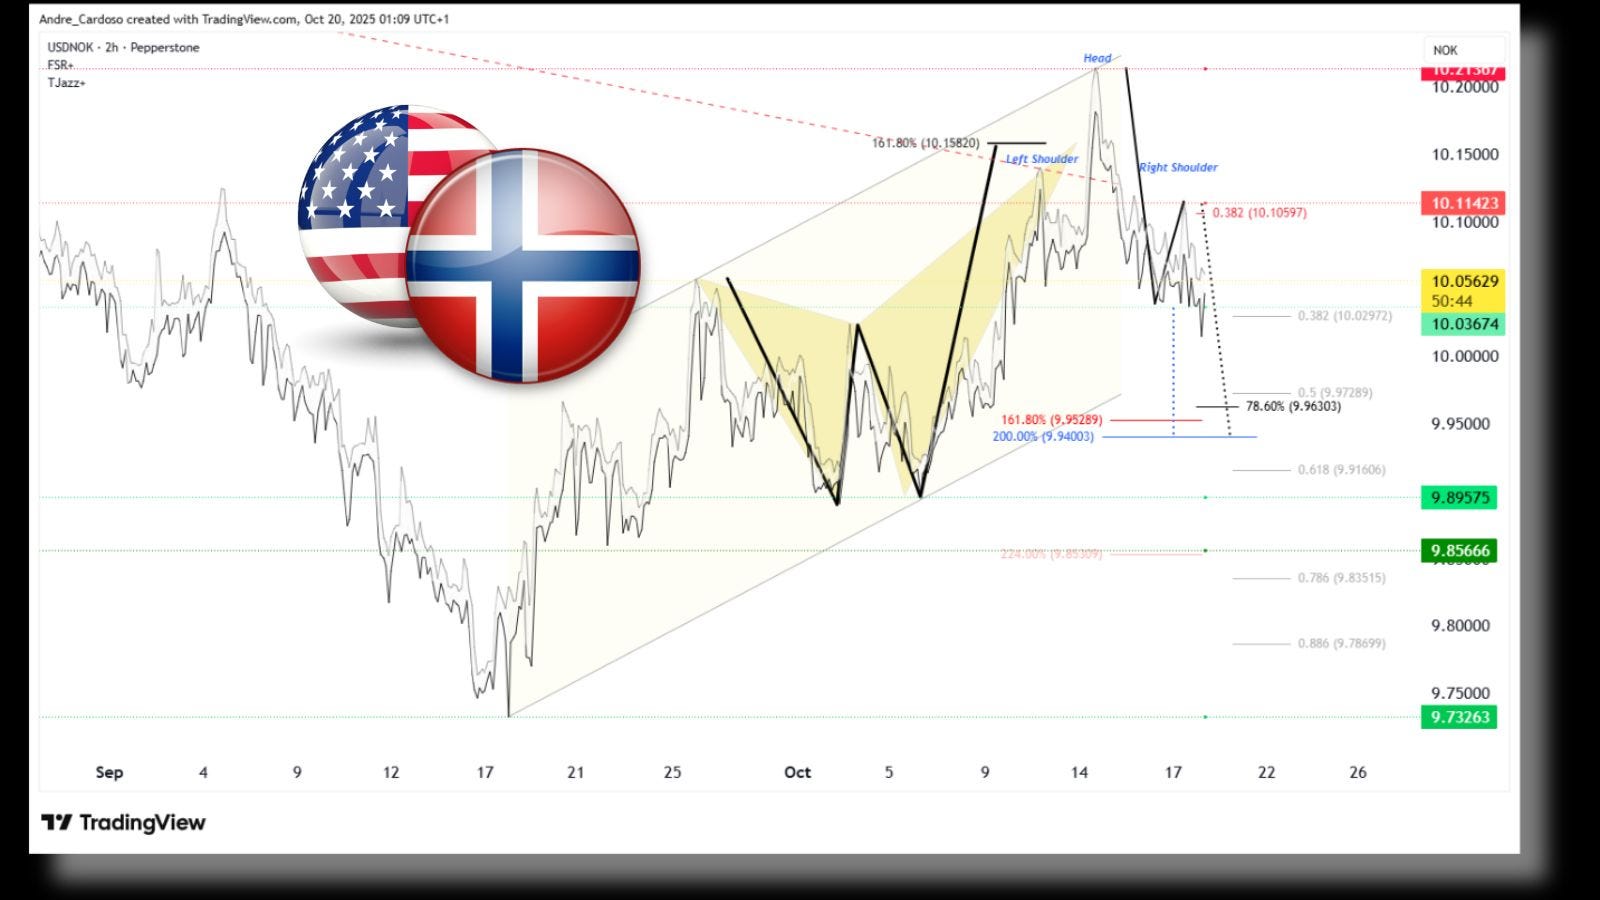
Given the historical sensitivity of the Norwegian krone to global oil trends, traders should remain alert to macroeconomic catalysts that could accelerate or delay this technical setup.
The GBPNZD pair recently encountered strong resistance at 2.3522 and is now showing signs of reversal with the emergence of a 3-Drives pattern. This formation suggests a potential pullback toward the 2.320 area, aligning with a prior resistance zone.
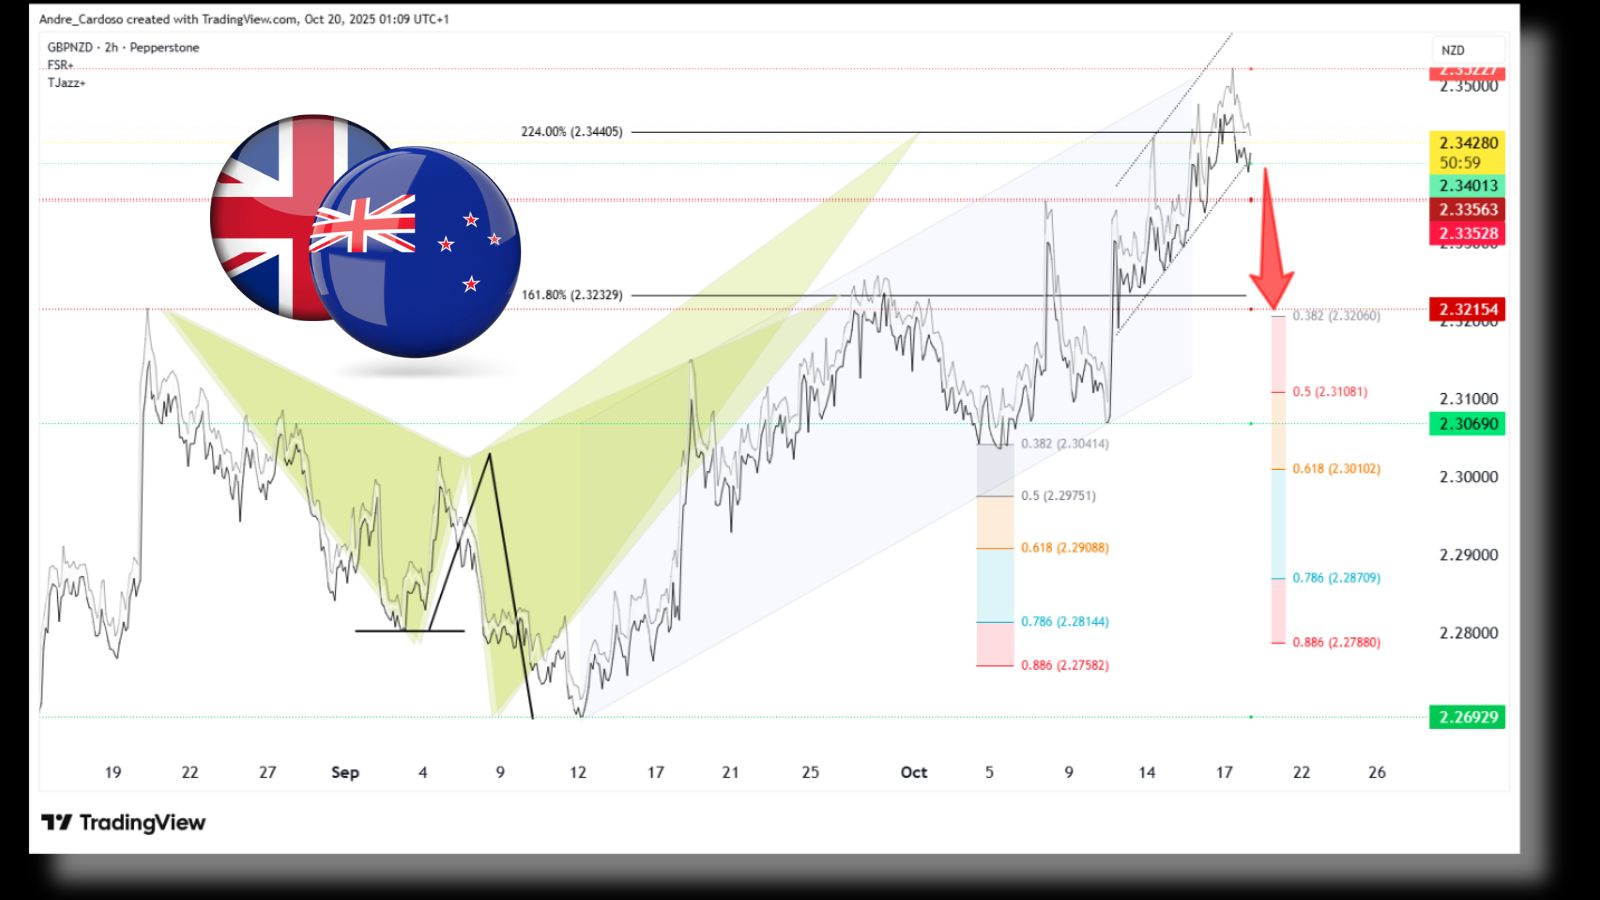
Notably, this setup coincides with the completion of a bearish shark pattern near the 224% Fibonacci extension, as well as a trendline resistance within the broader ascending channel structure. Such multi-level confluence often strengthens the probability of a corrective move before any renewed attempt to the upside.
Bitcoin remains technically sensitive as it trades near the neckline of a potential technical double top pattern. A breakdown below the intraday fractal support at $103,530 would confirm the pattern and likely trigger a decline toward $93,107.
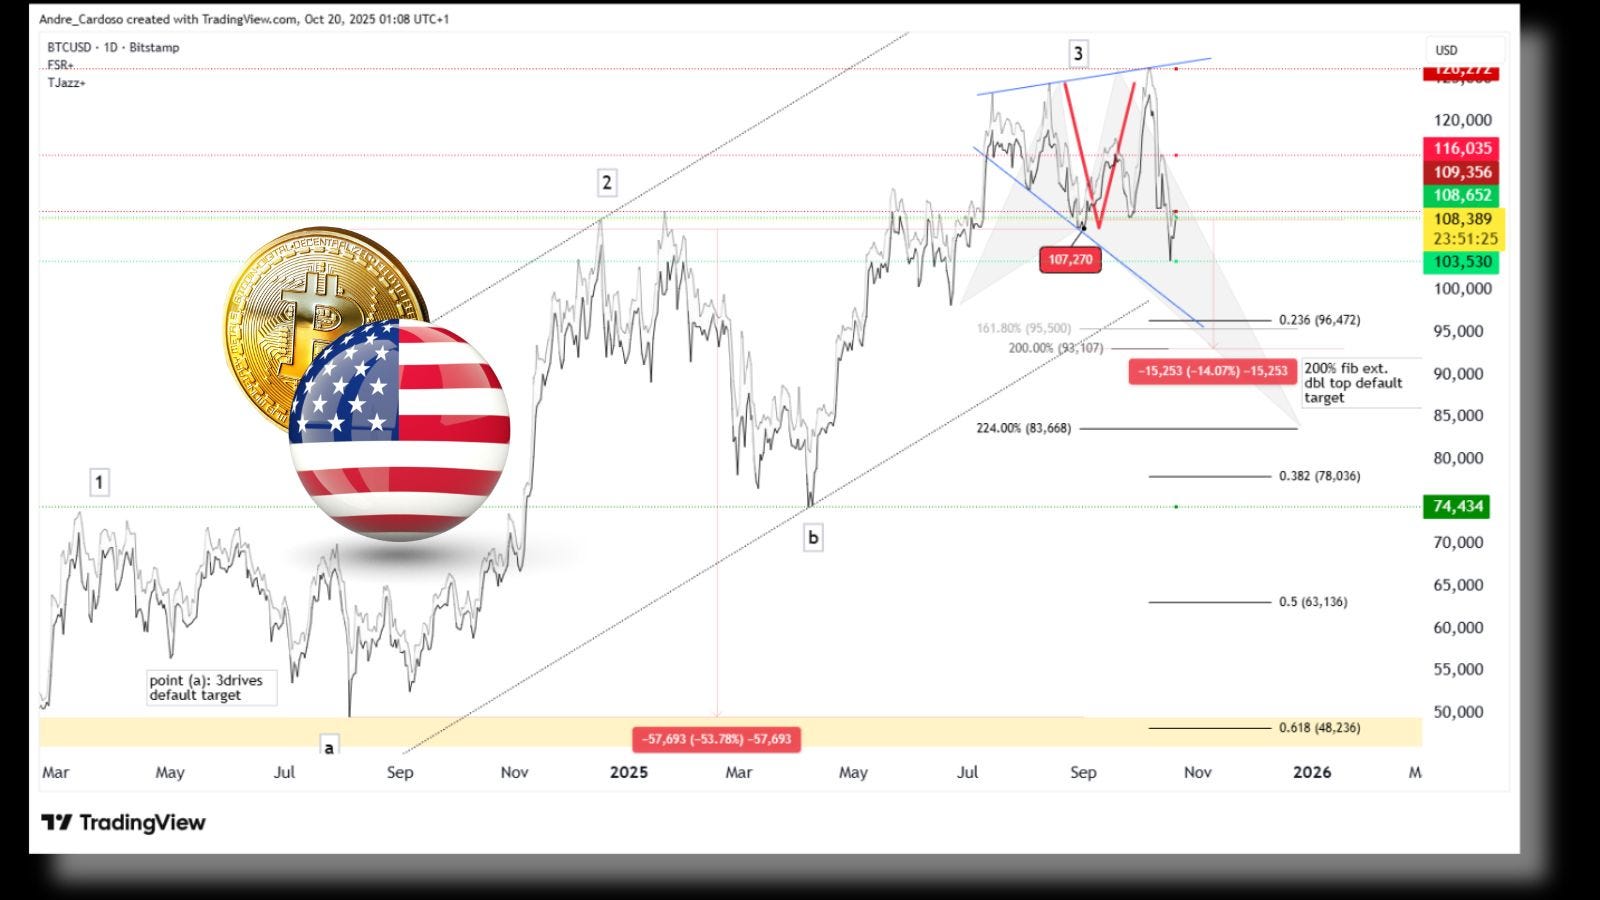
This should mark a critical shift in market sentiment, particularly as Bitcoin continues to face macro headwinds and profit-taking pressure near multi-month highs.

This week’s technical landscape reveals a market rich in harmonic structures and Fibonacci-driven confluences. Across major forex pairs and Bitcoin, several reversal patterns are either completing or nearing confirmation. While short-term volatility remains elevated, disciplined traders who align their entries with these key technical zones may find compelling opportunities in the days ahead.
As always, maintaining a balance between technical precision and risk management remains essential. The setups discussed here serve as analytical guidance, not as trade recommendations, aiming to help you better interpret ongoing price structures in today’s dynamic markets.
Happy Trading,
André Cardoso

Comments
Nothing yet. Say the first thing.
Sign in to join the conversation.