
This article takes up where Part 2. A Decision Tree for the Democrats' Impossible Choice, left off.
Step 3. Set the event values in the tree
Now we reach the most detailed step, setting the event values. These measure the impact of events in billions of dollars. The result is shown below. This is the final tree. (If you can, open the image of the tree in another browser window or print it out so you can refer to it as you read on.)
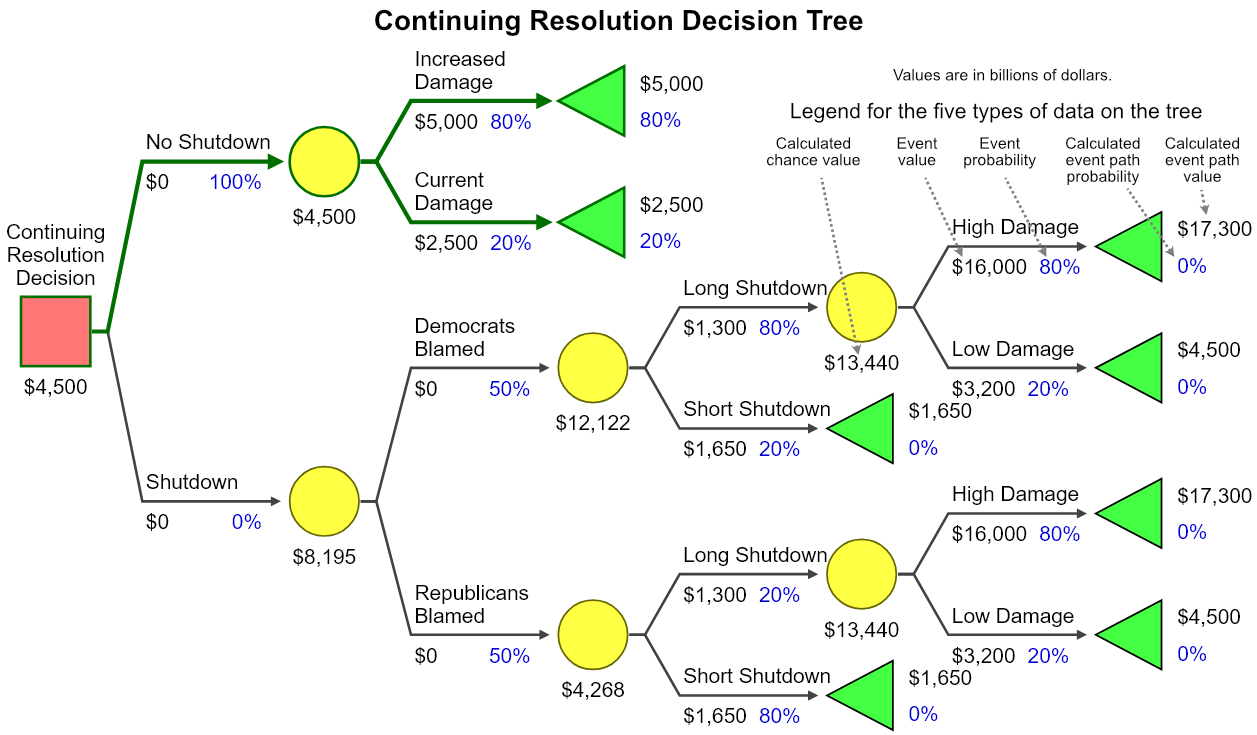
How do we read such a complicated diagram? The key to reading a decision tree is to see that all that matters is the shape of the tree and the event values and probabilities. All other numbers are calculated. The Legend identifies the five kinds of data on the tree. These are:
Calculated chance value is the expected value of a chance node, given what’s to the right of it. For this one, the expected value is (16,000 x 80%) + (3,200 x 20%) = 13,440. A decision is a type of chance node where you control the probability by making a decision.
Event value is something you enter. It’s the value of that event. Here it’s the estimated cost of the High Damage, which is $16,000.
Event probability is also something you enter. It’s the probability that event will occur. Here there’s an 80% chance High Damage will occur, if a Long Shutdown occurs.
Calculated event path probability is the probability that event will occur. Here the arrow points to 0%. That’s because for this tree, the optimal decision is to choose No Shutdown, which has an event probability of 100%. This causes Shutdown to have a 0% probability, which in turn causes the 0% the arrow points to.
Calculated event path value is the total of all the event values on that path, running from the decision to the event. For this path, the total is $0 + $0 + $13500 + $16,000 = $17,300.
That’s all terribly complicated. Aren’t you glad the software can calculate everything else, once you enter event values and probabilities?
The 3-year planning horizon
For decision trees to work we must compare apples to apples. The No Shutdown branch measures the current damage rate of the Trump administration. However, when people talk about a Shutdown, they think in terms of how much total damage will result in a fixed period of time, like six months, before the shutdown ends.
The current damage rate cannot be compared to total damage, because one is dollars per year and the other is just dollars. To fix this problem we use a planning horizon of three years. The cost of No Shutdown is the current damage rate per year times 3. The cost of a Shutdown is its total cost for three years. Three years is a tradeoff between a short horizon, like one year, and a long one, like ten years.
Estimating Current Damage for No Shutdown
Let’s begin with the No Shutdown branch. The cost of Current Damage is the damage from the Trump administration continuing its present pattern of economically destructive behavior. Trump inherited a strong economy from the Biden administration, with 2.8% GDP growth in late 2004. The March 19 prediction from the US Federal Reserve is 1.7% growth for 2025.
But on March 18 the Atlanta Federal Reserve, using a mathematical model for a running estimate of current GDP called GDPNow, produced the astonishing graph below. It estimates current growth is minus 1.8%, which signals the beginning of steep recession. The right end of the blue line is positive 1.7%, the same as the US Federal Reserve’s prediction. While minus 1.8% disagrees with the Blue Chip consensus of 1.7%, that is trending downward and there is much evidence that it will continue. We estimate it will fall to 0% rather than all the way to minus 1.8% to be conservative.
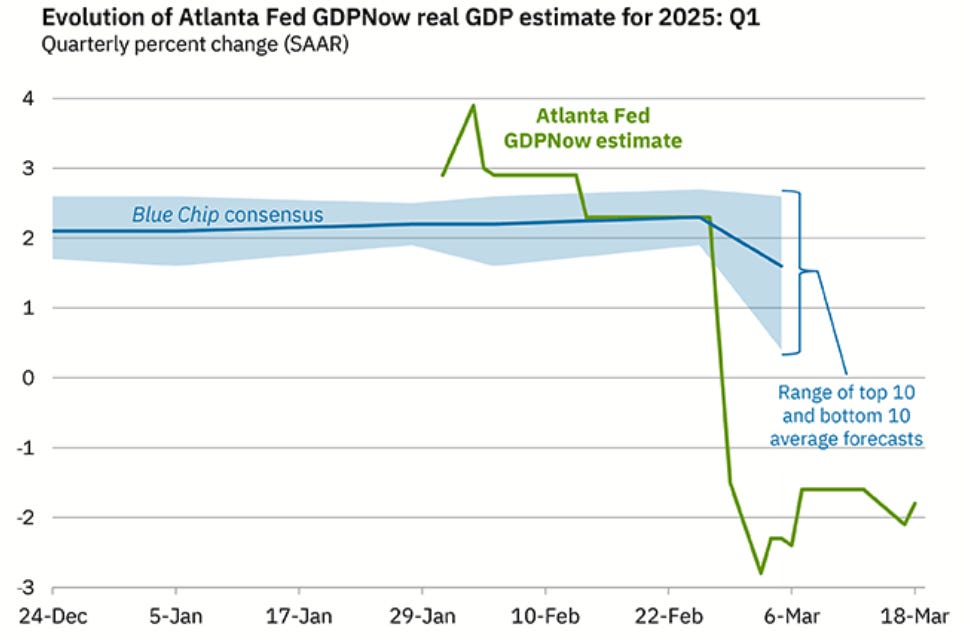
Let’s assume the 0% is for all of 2025, as a ballpark measure of where the economy is likely going. Current damage from the Trump administration is drop in GDP. The Trump administration inherited a growth rate of 2.8%, so a fall to 0% is a 2.8% drop in GDP. US national GDP was $29 trillion in 2024, so we estimate that with normal growth it will be $30 trillion in 2025. 2.8% times $30 trillion equals $840 billion per year. Converting that to the planning horizon of 3 years gives $2,520 billion which is rounded to $2,500 billion.
Estimating Increased Damage for No Shutdown
Democrats strongly opposed the CR for the four reasons listed in Part 1 of this article series. The largest was that the bill would strengthen:
President Trump, Elon Musk, and the Republican Party's ongoing efforts to unilaterally and unlawfully destroy the agencies and programs that serve the American people. … Elon Musk and President Trump [would] have the ability to steal funds appropriated by Congress in law, dismantle agencies created by Congress, and fire civil servants without cause.
There’s a reason the bill contained these new provisions. Trump wants more power so he can destroy the US economy faster, or as he and Musk deceptively put it, to make it more efficient. That new power will be used. How much additional damage will occur is hard to estimate, but it will be a lot. We thus estimate the bill will double the current damage rate. This gives 2 x $2,500 = $5,000 billion.
Estimating High Damage for a Long Shutdown
Let’s start on the right. Damage refers to reductions in national GDP and quality of life components like health, happiness, level of crime, military capability, democracy instead of autocracy, and the effects of US foreign aid and other programs on quality of life in other countries. However, to keep the analysis simple it includes only GDP. In a Long Shutdown of six months, how much would High Damage be?
The longest shutdown ran for five weeks in 2018-2019. The US Congressional Budget Office estimates that the shutdown reduced GDP by $3 billion in the fourth quarter of 2018 and $8 billion in the first quarter of 2019, for a total of $11 billion. Most of this came from not paying government employees during the shutdown. But when the shutdown ended, all received their back pay and these GDP loses were recovered, except for $3 billion due to various shutdown and reopening costs.
GDP was $21.5 trillion in 2019. $3 billion is 0.014% of that, which is minuscule. Why then was Chuck Schumer so worried about the effects of a shutdown?
Because of what he said on March 13, one day before the vote:
In a shutdown, Mr. Schumer said, “the Trump administration would have full authority to deem whole agencies, programs and personnel nonessential, furloughing staff with no promise that they would ever be rehired.”
He also warned that if the government closed, Mr. Trump and Republicans would have no incentive to reopen it, since they could selectively fund “their favorite departments and agencies, while leaving other vital services that they don’t like to languish.”
Schumer later said on March 23 in an interview with NBC’s Meet the Press that:
The CR was certainly bad, you know the continuing resolution. But a shutdown would be 15 or 20 times worse. Under a shutdown, the executive branch has sole power to determine what is ‘essential.’ And they can determine without any court supervision. The courts have ruled it’s solely up to the executive what to shut down. With Musk, and Doge, and Trump, and this guy Boght, B, O, G, H, T is how I think you spell his name, is the head of OMB. They would eviscerate the federal government. (Schumer was close. His name is Russell Vought.)
On Day 2, they could say, ‘Oh, SNAP? Feeding hungry children? Not essential.’ On Day 4, ‘Mass transit? All transit? Aid to the states? Not essential. We’re cutting it.’ On Day 6, ‘Medicaid? We’ll cut that by 20%, 30%, 50%, 80%. We’ll go after Social Security. We’ll go after the veterans.’ Their goal is to just eviscerate the federal government so they can give more taxes, and their tax cuts to their billionaire class over there.
Norman Ornstein describes why a shutdown would be so much worse:
Schumer suggested that Trump could shut down the government for six months or a year without consequence and dismantle government unilaterally while keeping his favorite programs going. During a shutdown, no one is paid; workers deemed essential must come to work, but without pay. …
Imagine if Schumer’s specter of a six month or year-long shutdown occurred. The largest share of government employees, including in Trump’s favored essential agencies and bureaus, would quit and find other jobs or get unemployment benefits to get by. That would include air traffic controllers, FBI and ICE agents, and key personnel protecting our military installations and embassies—not to mention programs affecting health and safety. As we have seen with the boneheaded DOGE move to fire all those safeguarding the nuclear arsenal, getting those mistreated workers to return or replacing them would be difficult, if not impossible.
TSA lines at airports would be interminable. Air traffic controllers forced to work at Starbucks while also manning the towers would not make people feel safe; those resigning because they could not afford to stay would have the potential to shut down air travel altogether. Taxpayers would not see their refunds; Social Security recipients would have major delays in their checks. The markets (the one thing Trump genuinely cares about) would plummet even more than they already have. The pressure on Republicans in Congress to reopen government would be intense and unrelenting. The backlash against their nihilism would be overwhelming.
Yes, that backlash would eventually force the Republicans to reopen. But Trump is already causing large amounts of damage with the many Doge cuts, tariffs, cruel deportations, his attacks on the courts and the press when they side against him, his switch from supporting Ukraine and NATO to supporting Russia, the closing of the Department of Education and USAID, etc. House and Senate Republicans are silent and acquiescing to his every demand. They would remain just as silent on long shutdown damage, until Trump told them to reopen. Given the pattern of Trump’s present behavior, to destroy American democracy and its economy as rapidly as possible, that will continue. What better way to do that than to let the shutdown last as long as possible?
The evidence points to a probable long shutdown. Let’s use Schumer’s low end estimate of six months to be conservative.
A 2024 survey found that “49% of Americans live paycheck to paycheck throughout the year. … 38% have $100 or less in their checking accounts. Half have less than $500 in savings.” This supports Norman Ornstein’s claim that most government employees “would quit and find other jobs or get unemployment benefits to get by.” Let’s estimate that after the first month, 10% quit each month. In six months, 50% will have quit. This will have a catastrophic effect on GDP, since most government programs would be severely curtailed or shut down. Airlines would shut down or see severe delays, federal courts would close, IRS processing of tax returns would be delayed or suspended and more tax fraud will go undetected, all research grants would cease, all national parks and museums would close, FDA and USDA inspections and would cease or be significantly curtailed, border crossing inspections would be delayed or who knows what, and so on.
In addition, all 3.5 million government employees would not be paid, even though essential employees would be required to work. Their average salary is $85,000 per year, which is $298 billion per year. That’s 1% of total GDP of $30 trillion per year, so the economy immediately takes a 1% hit. This is followed by the catastrophic effects described above due to closed or curtailed government services, which grows monthly as employees quit. Let’s estimate that causes GDP to fall by 4% per month. After six months, GDP has fallen by 1% + (6 x 4%) = 25%. That’s six times what happened in the Great Recession of 2007 to 2009, when US GDP fell 4.3%. The economy did not recover until 2011. By comparison, world GDP fell by 15% and US GDP fell by 30% in the Great Depression.
Let’s turn that into an estimate for High Damage for a Long Shutdown. Damage in the form of falling GDP accumulates for six months at 5%, 9%, 13%, 17%, 21%, and 25% of GDP. These six amounts average 15%. Then GDP stays at 25% less than normal for 6 months after shutdown ends, since turning around a large economy takes time. Then it takes two years for the economy to fully recover, as that 25% returns to zero. This totals 3 years.
Recovery is stimulated by back pay to government employees. However, half have quit. The cost of hiring and training replacements will approximately equal their back pay, so we do not include this stimulus in the calculation. The average of 25% and zero is 12.5% per year. The total drop in GDP is ((.5 x 15%) + (.5 x 25%) + (2 x 12.5%)) x $30 = 45% x $30 = $13.5 trillion or $13,500 billion.
To that must be added the Current Damage of No Shutdown, since that damage will continue rather or not the CR is passed. $13,500 + $2,500 = $16,000 billion, which is the estimated High Damage in a Long Shutdown.
Recall that compared to the CR bill, Schumer later said that a shutdown would have been 15 or 20 times worse. We estimated No Shutdown Increased Damage at $2,500 and Shutdown High Damage before adding Current Damage at $13,500, which is 5.4 times worse than the $2,500. It’s thus in the same ballpark as Schumer’s estimate, but is more conservative.
Estimating Low Damage for a Long Shutdown
This is much easier. We estimate it will be 20% of High Damage. 20% x $16,000 = $3,200.
Estimating Long Shutdown cost of reopening
This is estimated at 10% of the expected value of the chance of high or low damage, which is $13,440. 10% of that is rounded to $1,300.
Estimating Short Shutdown cost
Let’s estimate a short shutdown would last one month. From the calculations above for High Damage for a Long Shutdown, 5% x $30,000 = $1,500. If we estimate the cost of reopening is 10% of that, we get $150. $1,500 + $150 = $1,650.
Step 4. Evaluate the calculations and make the decision
For easy reference, here is the final tree again with key results pointed out. Remember, this is just an example of what is possible.
The tree uses probabilities of 50% and 50% for Democrats Blamed and Republicans Blamed to get an expected value of $8,195 for a shutdown. Other scenarios can be run. If the Dems are blamed, probabilities of 80% and 20% give an expected value of $10,551 for a shutdown. If Republicans are blamed, probabilities of 20% and 80% give an expected value of $5,839. Neither are much different from $8,195. The best decision is still No Shutdown.
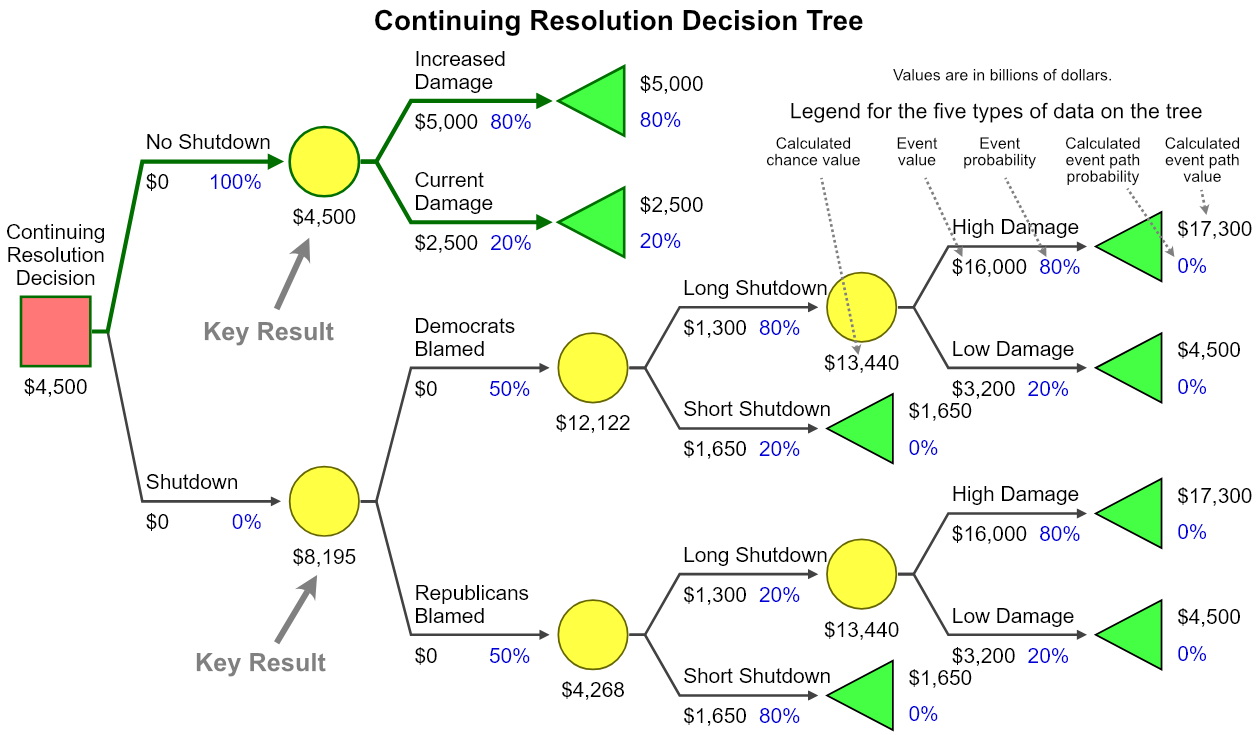
All this tedious analytical work has led to a counter-intuitive conclusion. The key result is the decision tree estimates the additional damage from the CR will be $2,500, which is the difference between Increased Damage and Current Damage. The expected value of a Shutdown is $8,195 billion. $8,185 / $2,500 = 3.3.
A shutdown costs about three times as much as no shutdown and just the effects of the CR. That is far from the hue and cry the Democrats raised, when Chuck Schumer himself said that compared to the CR bill, a shutdown would have been 15 or 20 times worse. Why the difference?
Because Schumer’s “15 or 20 times worse” was an intuitive estimate.
What Schumer and others did was to calculate in their heads in seconds what has taken me days to calculate in a decision tree.
Does the Congressional Budget Office calculate in their heads what expected GDP will be for the next year? No. Does any billion dollar company calculate in their heads what projected earnings will be for the next fiscal year? No. Why then do Democrats, as well as Republicans, not use a tool like decision trees for forecasts as critical as the effect of a shutdown versus no shutdown?
I think the Democrats themselves are going to have to answer that question.
Furthermore, the decision tree shows that the 10 Democrats who voted with Republicans to advance the CR made the right decision. The lowest cost decision was to vote for no shutdown.
If the Dems has used a decision tree, all that anger and frustration directed at Schumer for making an impossible choice would have instead been directed toward a more productive target: Have we got the shape of the tree right? How accurate are the estimates used to build it? Are we missing anything important?
In the process of asking and answering those questions, Democrats would have stayed unified and, I would like to think, would have won the news cycle. Instead of the news centering on the Democrats’ anger, disarray, and so many wanting to dump Schumer, the pundits would have talked about how the Democrats shrewdly kept calm, because they could see that no matter how they voted, what the Republicans were doing was going to make things worse, and that the Democrats’ best option was to vote for the CR.
Why is the tree so far from Schumer’s estimate?
Chuck Schumer said that “The CR was certainly bad, you know the continuing resolution. But a shutdown would be 15 or 20 times worse.” But the decision tree found otherwise. The expected value of a shutdown is $8,195 versus $2,500 for the additional damage caused by the CR’s provisions. $8,185 / $2,500 = 3.3. A shutdown is only three times worse.
The reason for the difference may be found in the section on Estimating High Damage for a Long Shutdown:
We estimated No Shutdown Increased Damage at $2,500 and Shutdown High Damage before adding Current Damage at $13,500, which is 5.4 times worse than the $2,500. It’s thus in the same ballpark as Schumer’s estimate, but is more conservative.
The section also said that:
In six months, 50% will have quit. This will have a catastrophic effect on GDP, since most government programs would be severely curtailed or shut down. …
Let’s estimate that causes GDP to fall by 4% per month. After six months, GDP has fallen by 1% + (6 x 4%) = 25%. That’s six times what happened in the Great Recession of 2007 to 2009, when US GDP fell 4.3%. The economy did not recover until 2011. By comparison, world GDP fell by 15% and US GDP fell by 30% in the Great Depression.
A 25% GDP drop is almost as much as the 30% drop in the Great Depression. It would be unrealistic to estimate a higher drop, which is what “15 or 20 times worse” would require.
15 times worse would require Shutdown High Damage before adding Current Damage to be 15 x $2,500 = $37,500. $37,500 / $13,500 = 2.8. 2.8 x 25% = 70%. In other words, 15 times worse would require about a 70% drop in GDP. Considering that the Great Depression is the largest drop in US history (the Long Depression of 1873 to 1896 saw a maximum GDP drop of 10%), a 70% drop is impossible.
This shows why it’s best to rely on analysis rather than intuition when calculating the behavior of a complex system.
The Analytical Activist is working hard to help turn the tide of erosion of democracy. To receive new posts and help in this work, consider becoming a subscriber.
Comments
Nothing yet. Say the first thing.
Sign in to join the conversation.