
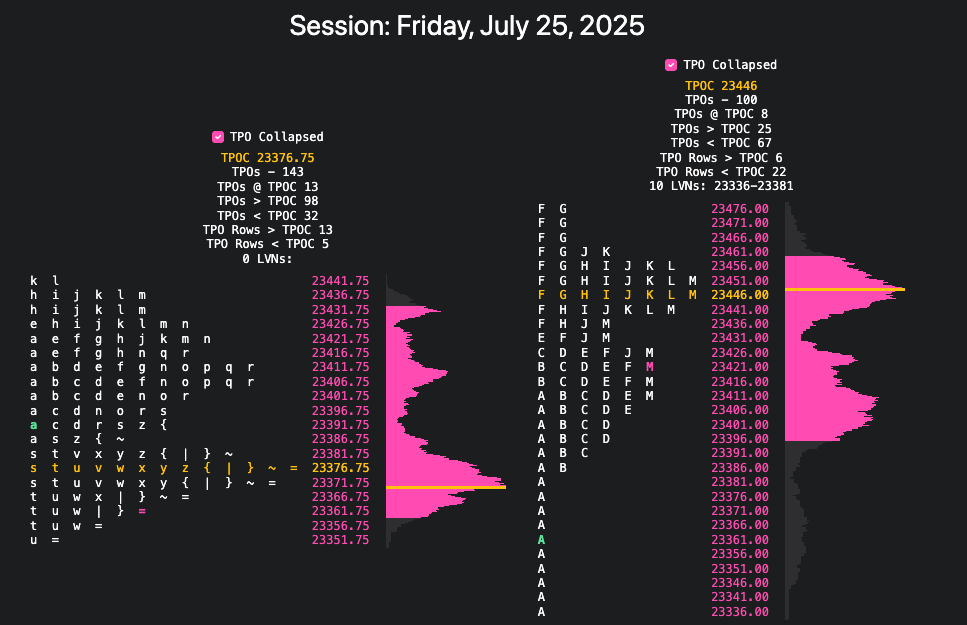
Volume profiles! Coming to an AMT JOY near you. (See the Friday’s NQ session HERE!)
Sigh. What can I say?
Once a trader, always a trader.
Casually screwing around in Tradovate’s simulator, I ran the default Tradovate 50K demo account up to nearly 260K in a matter of days:
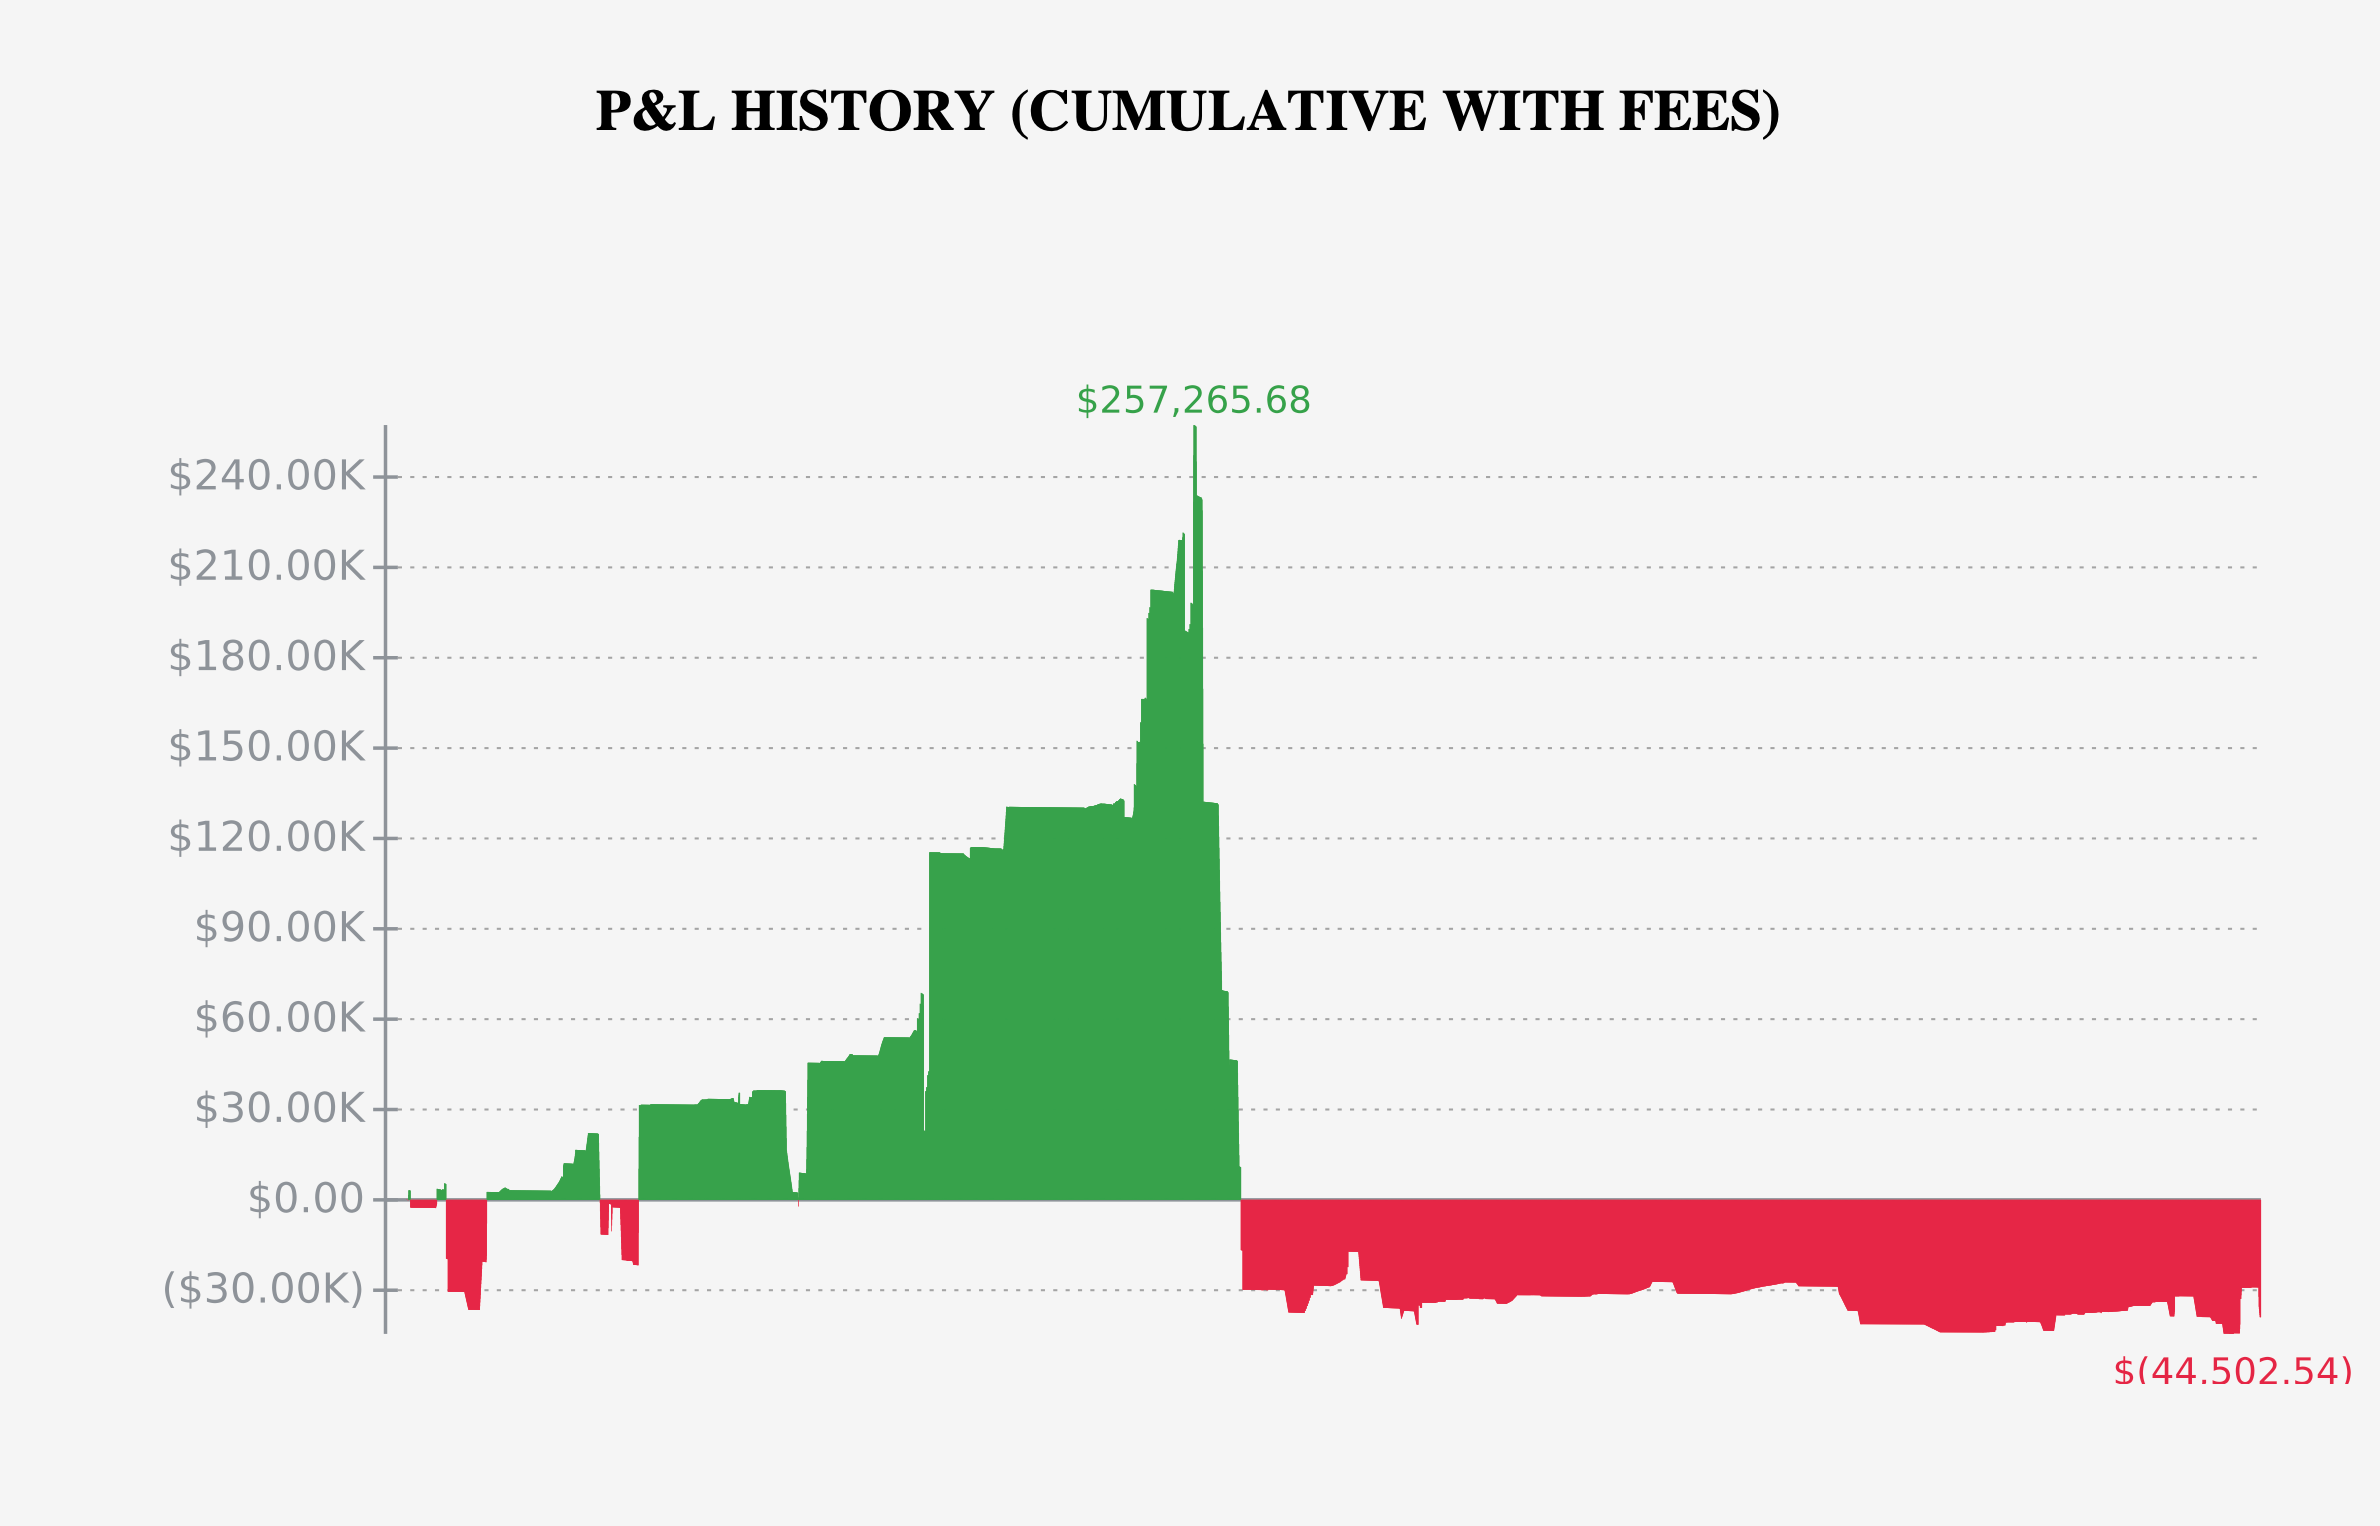
Only after, of course, to crash it down to 10K… Read: that’s a net 40K loss! :)
My weaknesses still? Oversizing in A-period chop, and oversizing in general - I was yeeting 20 to 50 lot clips of NQ on a 50K account, “just for fun”. You can run the numbers, but I’m pretty sure that’s about 200% the max risk sizing one should have on a 50K account.
Still, while I realize this is completely irresponsible trading, I at least recognize that the majority of my ideas have edge, and that I definitely have improved over the years. 50K to 250K in 3 days is something I could not have done a year or two ago. I find myself looking at the market profile more and more, gleaning insights about how price distributes itself. It’s always a contextual discussion - who is trapped? Is this price unfair? Too low? Too high? How long do we stay at these unfair prices? How often do we return to familiar prices?
The problem is, I’m extremely busy: I have a full-time job, I have other things going on at Full Stack Craft than just AMT JOY, and while I’d love to be writing tickets again (at least part-time), I currently respect the fact that to do a proper job in the futures market you need to be doing in more or less full time, and I can’t just shut off everything else going on in my life right now. That’s why I’ve just been screwing around in the simulator every so often - I can’t manage any more right now.
Not sure I’ve ever shared this before. Back in early 2023, I started really trading in earnest directly with building an extremely simplistic (didn’t think so at the time) trend-following algorithm for ES. (I’ve since learned this is about the dumbest thing you can do - you should trade by hand for AT LEAST 6 months to a year before considering an algo. You need to know what P/L feels like in real time, among a thousand other things, in order to build a proper algorithm.)
While I thought I really had found the holy grail (far beyond thinking that a holy grail exists at all at this point), I’m more than happy to share what my “amazing algo” was. Almost embarrassing for me to say it at this time:
Use 15-minute Heikin Ashi candles - if you see a “strong upward” style Heikin Ashi rotation greater than or equal to 4 points, go long. Close when you see the first non-strong up candle. The reverse for going short.
I’ve even shared the pinescript at the bottom of this article.
In reality, that algo did have some decent trades, and the worst thing that could happen, inevitably, happened - the first 2-3 days of it being deployed productively (early April, 2023) we had a monster trend up day in ES, and I made $1200 in one day, on a 10K account! I thought I was truly a master of the universe. This was very much the “first one’s free” phrase that we’ve all come to know and love from the Wallstreetbets community.
Then the first two weeks of April began to unfold as quite literally one of the most balanced months in trading history and my heavily trend-reliant algo got wrecked and I had to turn it off with something like 4K left in the account.
The time’s come. I’ve been trading descretionarily (some of it sim, most of it real accounts) for over a year now, and seen hundreds of sessions unfold. I’m inclined to believe I have at least some edge to make $200 a month on a 10K account. That’s it, nothing special. Just want to start as small as possible and refine as needed. Scaling can always come later.
So, my current plan and challenge now is to pick a few of these strategies and encode them, to keep nothing secret, they’re common ones that basically everyone knows about:
Previous day value area traversal - if at least two half-hour periods close within the previous day’s value area, traverse to the other side of that value area is 80% likely - likewise, if we open in the previous day’s value area, we are 80% likely to tap yesterday’s VPOC.
Protection of previous day’s single prints or LVNs - either trapped longs or trapped shorts above / below these levels can create good opportunities for quick scalps with tight stops.
Mean reversion-based trades based on the developed TPO - if the TPO price distribution is well established, afternoon or later day moves can sometimes be faded back to the TPOC / VPOC (barring any major news, earnings or similar of course)
30s opening range breakouts. These are hard enough to execute properly as a human; the jury is still out if it’s an overall advantage or disadvantage to execute these as an algo. I’m guessing some of both. We’ll see.
As to what the actual specifics behind the numbers of what these algos will look like? I’m not sure yet. Each will need significant backtesting. Like my discretionary trading, I’m looking for strategies that are at least 50/50 with a 2:1 reward/risk ratio.
Until now, I had only TPO information in the AMT JOY dataset. Using 1-minute candle uniform volume distribution (indeed, not 100% accurate), I’ve now be able to add VPOC, VAH, and VAL levels to the AMT JOY datasets and sessions UI. These are also critical, of course for some of my new algo’s strategies.
Broadly for NQ futures, I have only one thing on my watch: I really, really, don’t like the look of the two naked VPOCs way down at 23225 and 22990.
The wild thing? Even if we go down and tap that 22990 level, that represents less than a 2% move down - check out these scenarios on the range lab.
I’ll do my best in the coming days to get the pipeline working to publish a new version of the site every night for NQ after market close. Traders of other names, you’ll have to wait, I’m eyeing an improved data provider, but currently, I only have access to historical NQ data.
I’m also working on a new type of TPO - one that helps make older sessions from basically anything earlier than 2020 be more statistically comparable to the last 5 years of the market. Remember April 9th this year (2025)? Yeah, NQ printed over 2000 points of gain in one day - almost more than the entire COVID crash and more than volmageddon in 2018. In short what I’m working on is a new way to scale TPO by percentage instead of raw point values.
Interested to see where all this goes - I’ll update when I can.
As promised, and since Substack formats code snippets horribly, here’s the pinescript of my original Heikin-Ashi based (educational purposes only, I can assure you it does NOT work in production over long time periods!)
//@version=5
// FAIR SLIPPAGE FOR THIS STRATEGY
// 1 MIN = 3
// 5 MIN = 4
// 10 MIN = 5
// 15 MIN = 5
SLIPPAGE_TICKS = 0
TICK_SIZE = 0.25
OPEN_DISTANCE = 2
COMMISSION_VALUE = 0.87
INITIAL_CAPITAL = 1000
STOP_LOSS_TICKS = 28
CONTRACT_SIZE = 1
var totalSlippage = 0.0
var summaryDisplayed = false
strategy("MICRO Heikin Ashi Strong Trend 15m Strategy 3.0 With EMA Crossover", overlay = true, commission_type = strategy.commission.cash_per_contract, commission_value = COMMISSION_VALUE, initial_capital = INITIAL_CAPITAL, slippage = SLIPPAGE_TICKS)
quarterRound(num) =>
quarter = 0.0025
math.round(num/quarter)*quarter
haData() =>
[open[1], close[1], high, low]
[haPrevOpen, haPrevClose, haHigh, haLow] = request.security(ticker.heikinashi(syminfo.tickerid), timeframe.period, haData())
realData() =>
[open[1], close[1], high, low]
[realPrevOpen, realPrevClose, realHigh, realLow] = request.security(ticker.standard(syminfo.tickerid), timeframe.period, realData())
ema_fast = ta.ema(close, 9)
ema_slow = ta.ema(close, 18)
// for each 500 generated, add a new contract
// Calculate the number of additional contracts to trade
// numAdditionalContracts = math.floor(strategy.netprofit / 500)
// // Update the number of contracts to trade
// if numAdditionalContracts > 0
// CONTRACT_SIZE := CONTRACT_SIZE + numAdditionalContracts
// Get the current week, hour, and minute
week = math.ceil((dayofmonth(time[0]) + dayofweek(time[0]) - 1) / 7)
currentHour = hour(time)
currentMinute = minute(time)
currentDayOfWeek = dayofweek(time) // 0 to 6, 0 is Sunday
day = dayofmonth(time)
currentYear = year(time)
// t = time(timeframe.period, "0000-1545,1600-0000") // bigboi window
// t = time(timeframe.period, "0230-1545,1600-0000") // babysitting window
// if not currentDayOfWeek == 0 and not na(t) and year == 2023 and month == 4 and day == 6
if year == 2025 //not na(t) //and month == 3 and day == 31//and month == 4 //and day == 14// ((month == 3 and day >= 30) or (month == 4))
haOpenRounded = quarterRound(haPrevOpen)
haCloseRounded = quarterRound(haPrevClose)
haCloseSlippage = math.abs(realPrevClose - haPrevClose) / TICK_SIZE
// close long strategy - hold at least one bar, then close at first signs of trend reversal
if (strategy.position_size > 0 and haOpenRounded >= haCloseRounded)// strategy.position_size > 0 and quarterRound(Close) <= quarterRound(Open)
strategy.order("Long", strategy.short, qty=CONTRACT_SIZE)
// bestPrice = math.max(realOpen, haOpen)
// worsePrice = math.min(realOpen, haOpen)
// totalSlippage := totalSlippage + (bestPrice - worsePrice)
//label.new(bar_index, open+5, text="CLOSE LONG\nREAL OPEN: " + str.tostring(realOpen) + "\nHA OPEN: " + str.tostring(haOpen)+ "\nWORSE PRICE: " + str.tostring(worsePrice) + "\nDIFF: " + str.tostring(realOpen - haOpen), style=label.style_label_down, color=color.green)
// close short strategy - hold at least one bar, then close at first signs of trend reversal
if (strategy.position_size < 0 and haCloseRounded >= haOpenRounded)//strategy.position_size < 0 and quarterRound(Close) >= quarterRound(Open)
strategy.order("Short", strategy.long, qty=CONTRACT_SIZE)
// bestPrice = math.min(realOpen, haOpen)
// worsePrice = math.max(realOpen, haOpen)
// totalSlippage := totalSlippage + (worsePrice - bestPrice)
//label.new(bar_index, open+5, text="CLOSE SHORT\nREAL OPEN: " + str.tostring(realOpen) + "\nHA OPEN: " + str.tostring(haOpen)+ "\nWORSE PRICE: " + str.tostring(worsePrice) + "\nDIFF: " + str.tostring(realOpen - haOpen), style=label.style_label_down, color=color.red)
// open long strategy - if nothing open yet, and bar is green
if ema_fast > ema_slow and strategy.position_size == 0 and haPrevClose - haPrevOpen >= OPEN_DISTANCE//quarterRound(Close) - quarterRound(Open) >= OPEN_DISTANCE and strategy.position_size == 0
bestPrice = math.min(realPrevOpen, haPrevOpen)
worsePrice = math.max(realPrevOpen, haPrevOpen)
strategy.entry("Long", strategy.long, qty=CONTRACT_SIZE, limit = realPrevClose, stop=realPrevClose-TICK_SIZE)
//label.new(bar_index, open-5, text="OPEN LONG\nPREV REAL OPEN: " + str.tostring(realPrevOpen) + "\nPREV HA OPEN: " + str.tostring(haPrevOpen)+ "\nWORSE PRICE: " + str.tostring(worsePrice) + "\nDIFF: " + str.tostring(realPrevOpen - haPrevOpen), style=label.style_label_up, color=color.green)
strategy.exit("Stop Loss for Long", from_entry="Long", loss=STOP_LOSS_TICKS, qty = CONTRACT_SIZE) // stop out at 14 ticks, i.e. loss of $175
totalSlippage := totalSlippage + (worsePrice - bestPrice)
// open short strategy - if no short open yet, and bar is green
if ema_fast < ema_slow and strategy.position_size == 0 and haPrevOpen - haPrevClose >= OPEN_DISTANCE//quarterRound(Close) - quarterRound(Open) >= OPEN_DISTANCE and strategy.position_size == 0
bestPrice = math.max(realPrevOpen, haPrevOpen)
worsePrice = math.min(realPrevOpen, haPrevOpen)
strategy.entry("Short", strategy.short, qty=CONTRACT_SIZE, limit = realPrevClose, stop=realPrevClose+TICK_SIZE)
//label.new(bar_index, open+5, text="OPEN SHORT\nPREV REAL OPEN: " + str.tostring(realPrevOpen) + "\nPREV HA OPEN: " + str.tostring(haPrevOpen)+ "\nWORSE PRICE: " + str.tostring(worsePrice) + "\nDIFF: " + str.tostring(realPrevOpen - haPrevOpen), style=label.style_label_down, color=color.red)
strategy.exit("Stop Loss for Short", from_entry="Short", loss=STOP_LOSS_TICKS, qty = CONTRACT_SIZE) // stop out at 14 ticks, i.e. loss of $175
totalSlippage := totalSlippage + (bestPrice - worsePrice)
else
// close all positions -
// this is more of a backtesting thing so we are sure there are no hanging open positions at the end of a testing region
strategy.close("Long")
strategy.close("Short")
// Display the bar count in the top right-hand corner of the chart
//if year == 2023 and month == 4 and day == 7
// label.new(bar_index, high, "Total Slippage: " + str.tostring(totalSlippage) + "\nAverage Slippage Per Trade: " + str.tostring(totalSlippage/strategy.closedtrades), xloc.bar_index, yloc.price, color.white, label.style_label_right)
No posts
Comments
Nothing yet. Say the first thing.
Sign in to join the conversation.