

Markets should have jumped on Micron’s Q3 report, but they did not and instead surprisingly sold off. The volatility in these markets can get extremely choppy, making it difficult for investors to find durable opportunities in the AI trade. At The Pragmatic Optimist, we have been methodically raising cash in our portfolio while selectively investing in the next best opportunities in the AI ecosystem.
Join us! We help hundreds of investors navigate the rapidly evolving AI innovation landscape, identify rock-solid businesses with strong growth trajectories & operational grit, and deliver proven alpha-generating returns.
Since March 1, the TPO Portfolio delivered returns of 28% 💪, compared to 15% for QQQ and 25% for AIQ.
Micron MU 0.00%↑ is the new Nvidia NVDA 0.00%↑ , according to markets, right?
Therefore, almost no one would have expected shares of the world’s third-largest memory maker to fall 5% last week after Micron published a show-stopping Q3 FY26 earnings report that shattered all expectations.
Micron’s actual Q3 revenues beat expectations by an astounding 17% ✅. Q4 revenue projection was well above the highest Wall Street analyst expectation ✅. The gross margin engine is humming a resounding expansionary tune ✅. And Micron still struggles to meet demand, so they are packing in even more capex in their next fiscal year ✅. So the champagne shouldn’t have stopped flowing for Micron after posting such impressive Q3 numbers.
Unfortunately, the party ended (temporarily, at least), and markets turned surprisingly bearish on everything AI, including Micron.
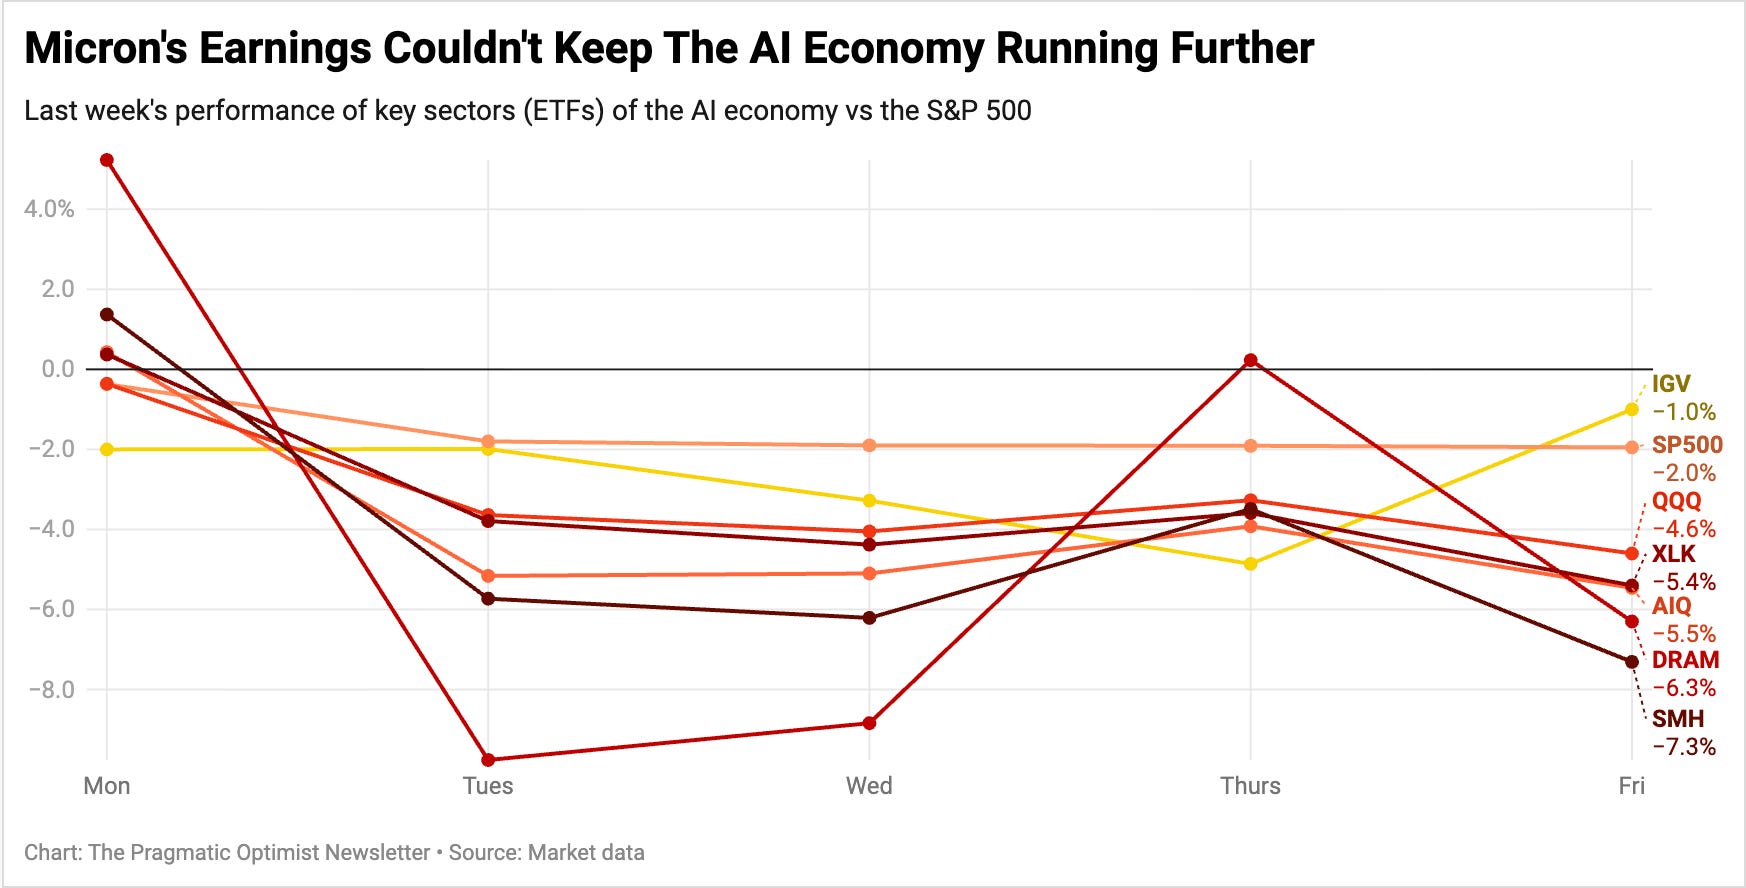
Two words began to take a fearful grip across the markets: AI Inflation, a.k.a. the rapidly rising costs of building AI data centers amidst the backdrop of supply chain pressures, geopolitical tensions, and surging data center component costs. And Micron’s Q3 FY26 report was at the center of these fears.
Given these fears about AI inflation, how does that position Micron’s shares after the Q3 report? What is the outlook for the AI economy? How are we positioning our TPO portfolio?
We answer these questions in the post below by first highlighting 5 takeaways from Micron’s Q3 report, followed by the winners/losers from the report in the AI ecosystem and our forward outlook on these companies.
📌Since March 1, The TPO Portfolio has delivered returns of 28% 💪, compared to 15% for QQQ QQQ 0.00%↑ and 25% for AIQ AIQ 0.00%↑ .For the month of June so far, our portfolio is also faring much better than QQQ and AIQ as well.
You can track our entire portfolio and all our live trades in the AI Stock Tracker 2.0 tool using the link below. 👇
Unlock Access to The TPO Portfolio
(Paid Members can access the AI Stock Tracker 2.0 directly from here)
In the Live Alerts we sent to our subscribers Thursday morning last week, we touched upon some of these takeaways. We’ll expand on these takeaways in detail in this section and end with key levels we are watching in Micron, where we will consider adding back shares again for The Pragmatic Optimist Portfolio.
💰Note that we had trimmed our position size in Micron by 33% at the start of June, booking in gains of 177%.
1.Strong Q3 With A Q4 Surprise: Micron’s Q3 FY26 revenues grew 346% to $41.5B, resoundingly beating midpoint expectations of $35.3B, a 17% beat. Peeking under the hood, we observe that DRAM, the underlying memory components in HBM, grew 343% to $31.3B, accounting for ~3/4ths of Micron’s revenues. Micron’s NAND grew faster at 361%, eclipsing the company’s DRAM business growth in Q3. The implication here is that Micron’s enterprise storage business (SSDs) continued its rapid growth in Q3.
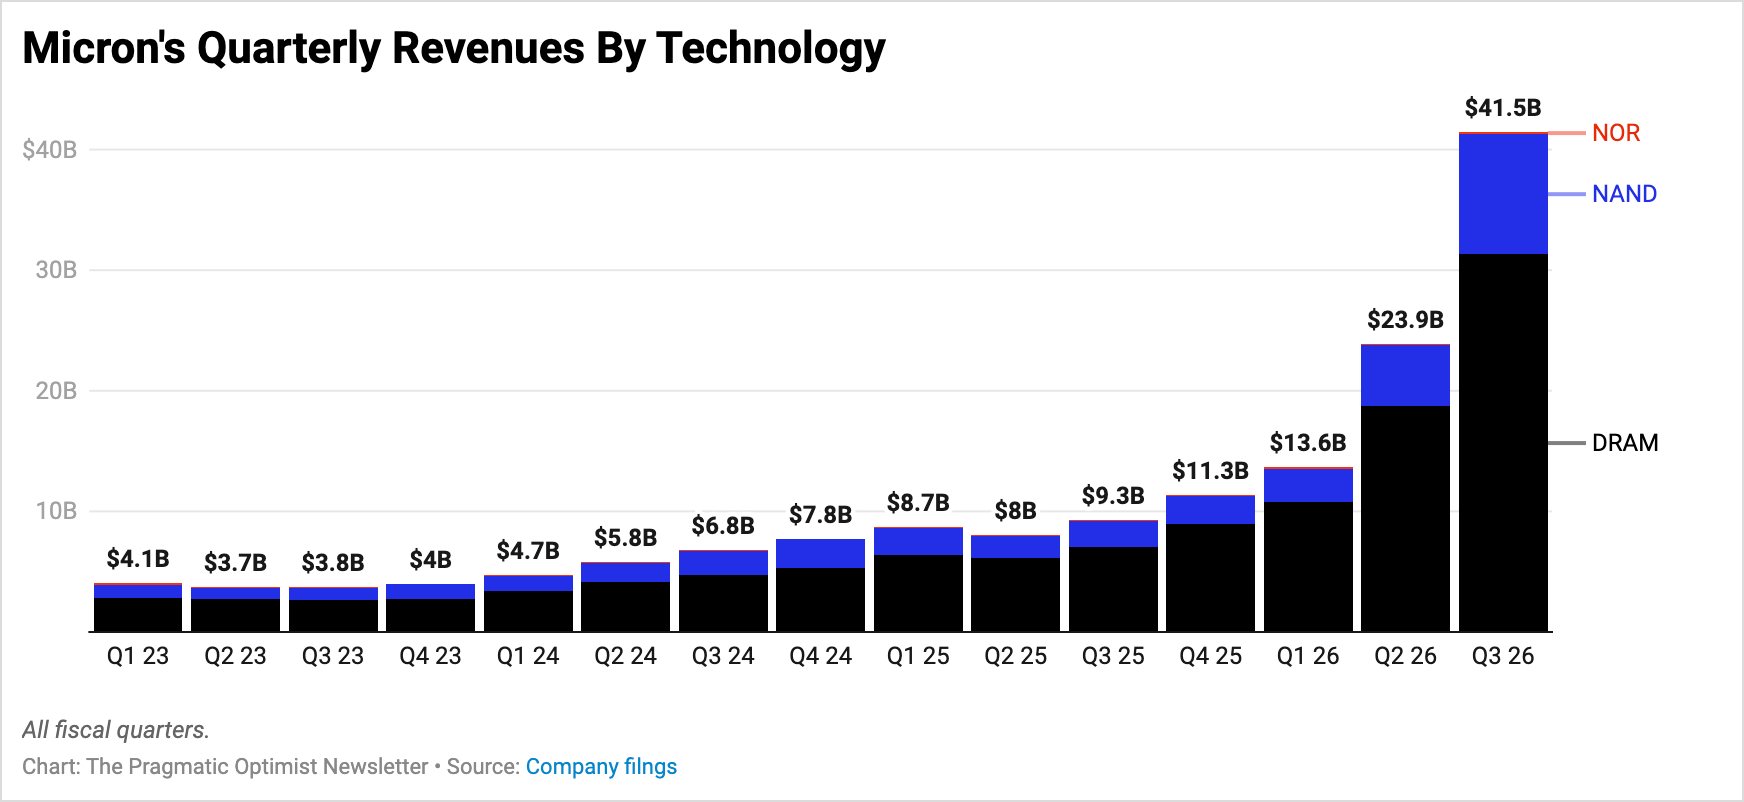
Management guided Q4 revenues to grow by 342% to $50B, shattering expectations of $43.2B by 16%, the second largest forward revenue guide beat since FY ‘22. Such a large magnitude of surprise in the Q4 revenue guide is very strong and only reiterates the growth outlook for Micron over the next 12-15 months.
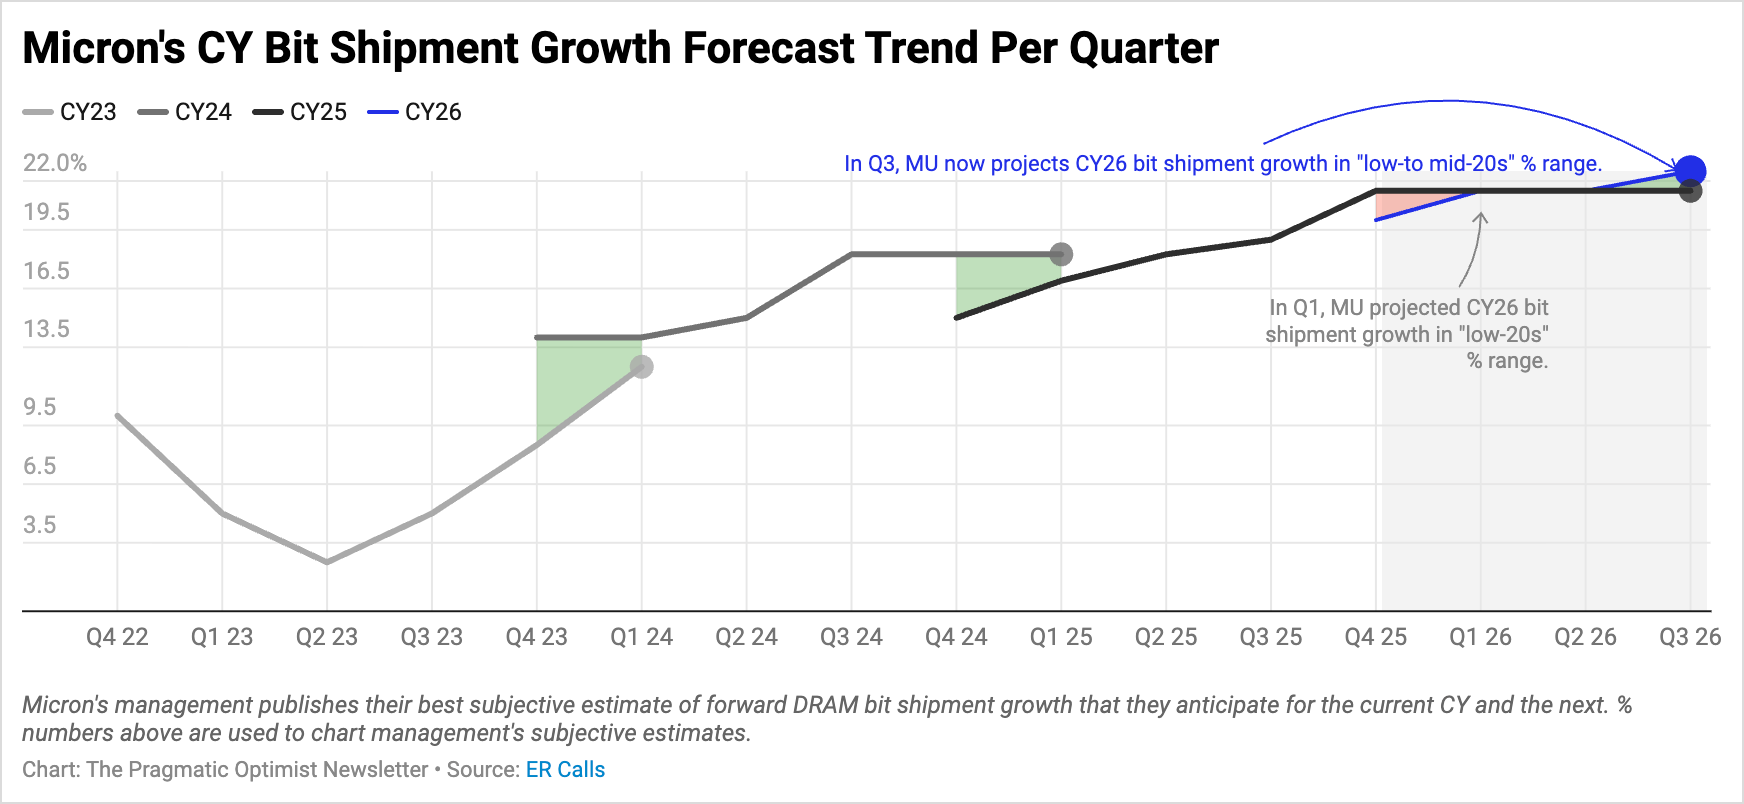
Management raised their DRAM bit shipment outlook again for CY26 for the third time this fiscal year, now expecting bit shipments to grow in the “low to mid-20s percentage range.” Micron’s NAND bit shipment forecast slightly differs from its DRAM outlook, and we’ll discuss the implications in the next section.
Upgrade to Premium For Just $13.33/Month
2.Expect Robust Capex Outlays: Generally, there are two unofficial rules of thumb markets have about Micron’s capex. 1) If Micron raises its capex outlook, it does so for a good reason, and strong forward demand is the most common of all reasons. 2) Bonus points for Micron, if management spends a larger share of its capex on WFE equipment (used for manufacturing HBM).
Last week, management raised their capex outlays again by 8%, now expecting to spend $27B in FY26. The $27B FY26 capex guide now implies 70% growth in FY26 capex and represents a 50% increase versus the first FY26 capex guidance of $18B issued last year. The reasons to scale up and deploy capex at such a meaningful rate through the last few quarters were HBM demand being robust while supply remained extremely tight, putting upward pressure on spot prices for DRAM components that Micron and its two larger peers (SK Hynix and Samsung) manufacture.
Management continues to see similar HBM demand/supply imbalances, which is why they signaled that markets can expect FY27 to be another year of expansionary capex. On the Q3 conference call, management hinted FY27 capex could likely be in the “mid-40s” billion dollar range, implying ~70% growth in capex next FY too, which should have been a very positive read for markets.
3. The $100B HBM TAM Anchor: In both points #1 and #2 above, the driving force behind the strong revenue and capex guides can be traced to the accelerated outlook in Micron’s HBM market, which is anchoring management’s robust guidance, in our view.
The post-earnings Micron management revealed that general HBM demand is so strong that they now estimate the HBM target market to be valued at $100B by CY27.
We believe the pull-forward in Micron’s $100B TAM estimate represents a significant step-up in the HBM market’s growth pace. In our analysis, management’s new TAM estimates signal a 69% CAGR for the HBM market as compared to the 42% CAGR implied in H2 last year. This significant step function in the HBM TAM growth pace now anchors a completely new trajectory for Micron’s outlook, and Micron’s long-term customer commitments, or SCAs (Strategic Customer Agreements), are increasingly becoming the face of this new growth trajectory for Micron.
4. SCAs—Micron’s New Growth Engine: Sell-side analysts will likely move away from focusing on the product side of Micron’s outlook (normally viewed via HBM variants like HBM3, HBM4, HBM4e, etc.) and look closer at the volume of SCAs that Micron is signing.
We encourage investors to read this industry report on Micron’s SCAs. But in short, the memory company is using SCAs to get customers to commit to long-term volume commitments that typically span over 3-5 years, allowing Micron to reliably plan its capex outlays and steer the business towards a more secular outlook rather than being driven by cyclical volatility.
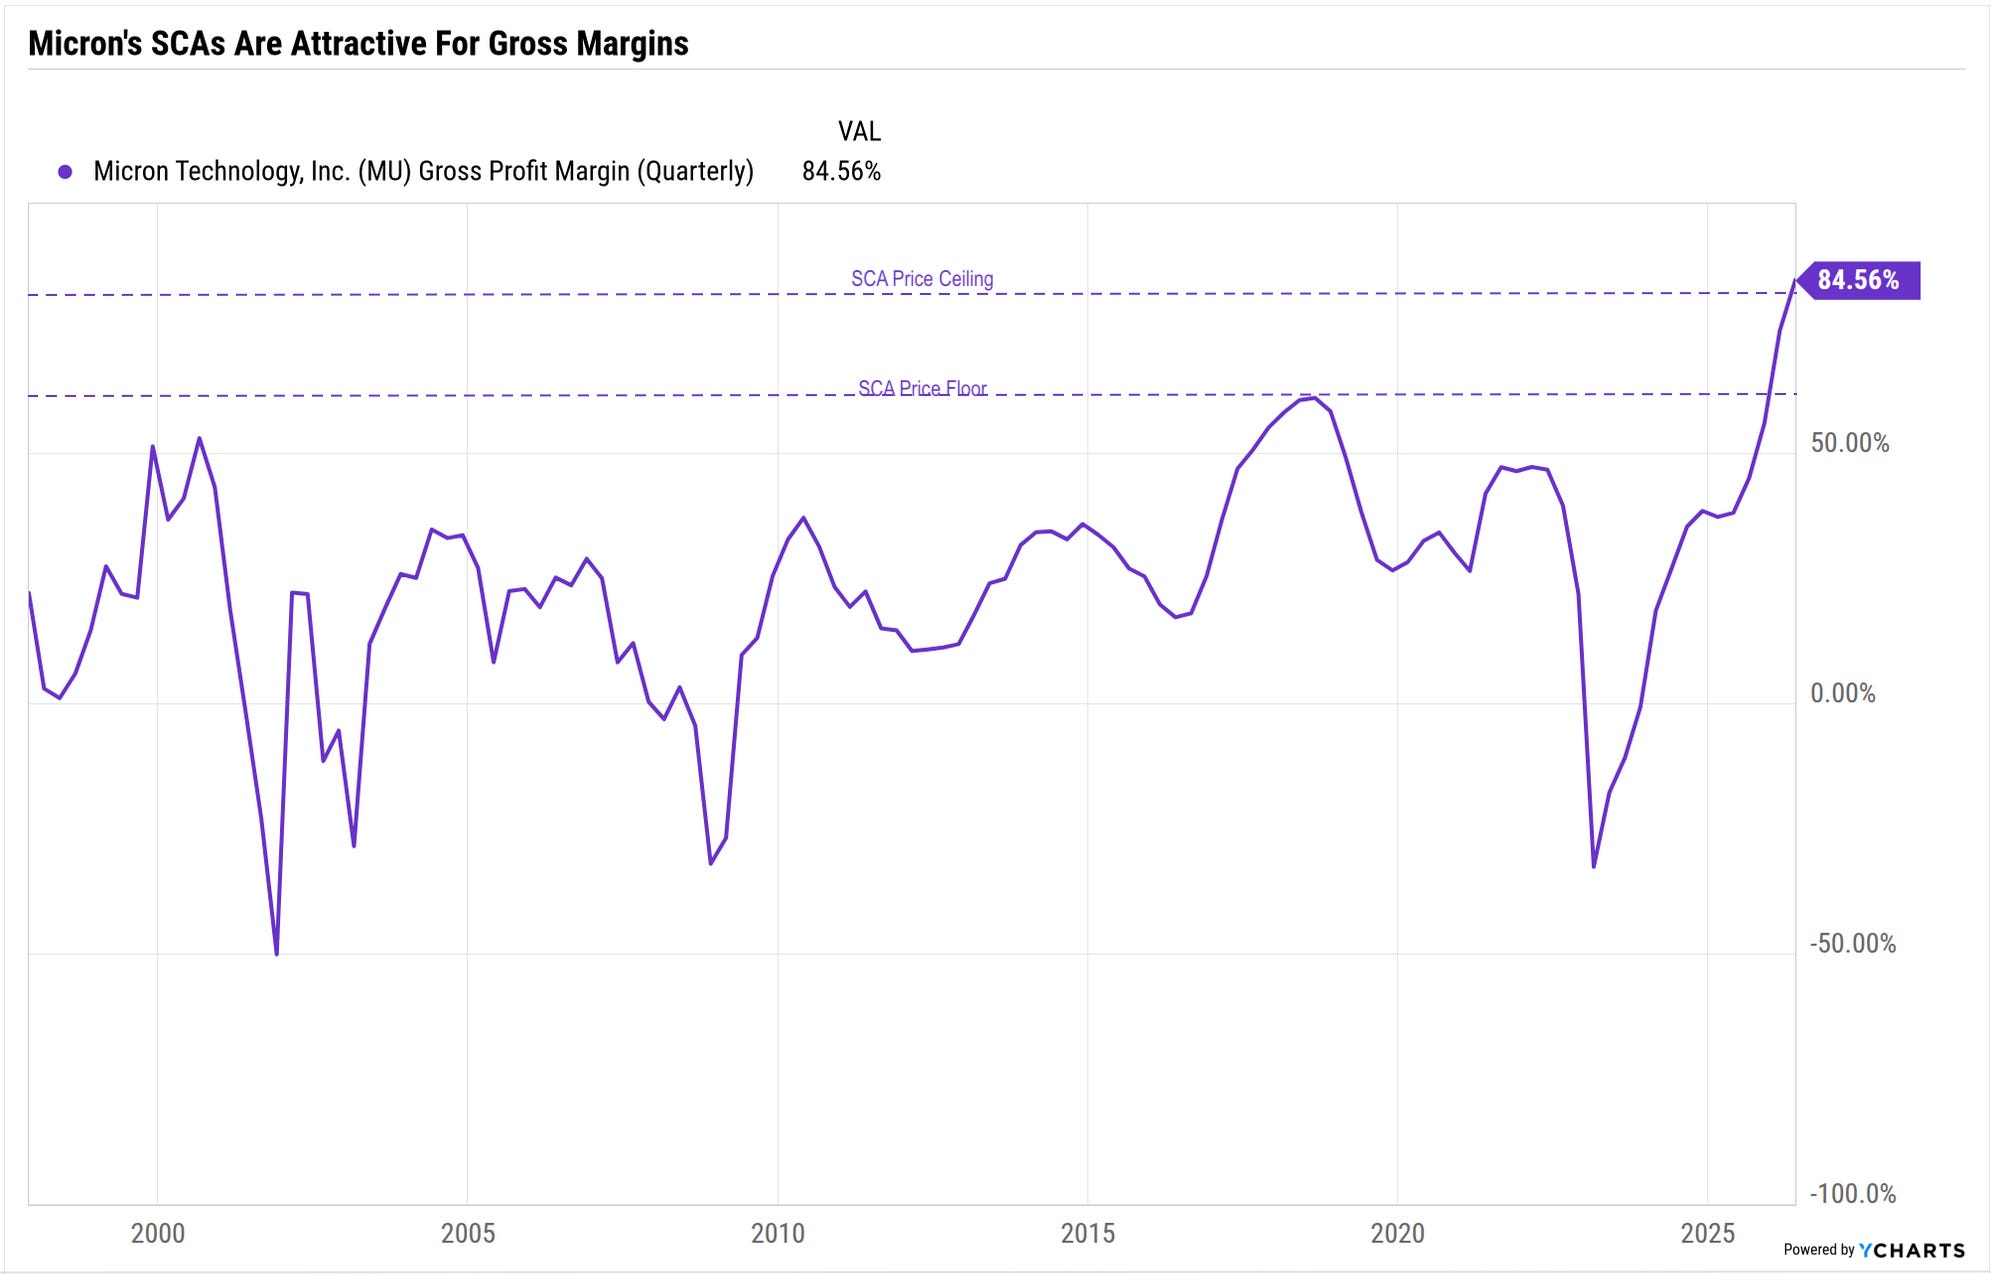
SCAs contain take-or-pay provisions whereby customers must commit to buying a certain volume of HBM within a pre-specified price band (a price band between a price floor and a price ceiling).
Last quarter, Micron had only signed their first SCA, but all of that changed in Q3. Management revealed that the company signed 16 SCAs, and the minimum backlog from these 3-5 year SCAs is worth $100B. On a rudimentary level, simple calculations suggest forward revenue from the current $100B backlog could fetch Micron ~$20B in annual revenue on average per year, which is meaningful. (Markets expect Micron to deliver $129B in FY26 revenue, and the annual run rate from Micron’s backlog implies a 15-20% forward revenue contribution.)
In our view, the bigger impact from Micron is how SCAs structurally change the story for Micron’s gross margins.
5. Gross Margins In Expansionary Mode: In this section above we previously noted Micron’s industry views, where “HBM demand was robust while supply continued to remain extremely tight.” These are highly optimal conditions conducive to gross margin expansion, and that’s exactly what we got in Q3.
As seen below, Q3 gross margins were at 84.6%, up 10 percentage points sequentially and 47 percentage points (‼️) versus Q3 FY25. It doesn’t end there. Micron expects gross margins to expand to an eye-watering 86% in the upcoming Q4 FY26.
A growing tailwind supporting these gross margins will come from SCAs, in our view. Using guidance from Micron’s management over the past few conferences, we drew out the price band of the SCAs layered on top of Micron’s margin profile, showing how accretive SCAs can be for Micron’s gross margins.
We’re very positive on Micron’s SCAs and will maintain our bullishness on Micron over the next 12-15 months.
We are currently holding our remaining Micron shares in the portfolio and will start to add back at key levels that we describe below in the chart. But before that, we want to elaborate further on how SCAs can help boost Micron’s gross margins in the coming quarters.
Comments
Nothing yet. Say the first thing.
Sign in to join the conversation.