
Ameliorate is a tool for discussing and mutually understanding tough problems.
Check out the documentation to learn more about the app.
TLDR
New features: filtering! And various small improvements.
Documentation for using Ameliorate has been created, check it out!
Tune into the live stream this Wednesday 3/20/2024 @ 7pm CT for a demo of these features!
Upcoming features will once again be prioritized based on feedback (join a discourse session!), though there are currently a few things at the top of the backlog.
Greetings 🙂 and welcome to Ameliorate Update #3! We’ve done a few discourse sessions, got some great feedback, and now Ameliorate has a few more features 🔥.
If you prefer catching these updates via video, tune into the live stream this Wednesday 3/20/2024 @ 7pm CT!
Table of Contents
Bigger Updates
- Filters
- Documentation
Smaller Updates
- Editing Improvements
- New Node Types
- Misc
What’s Next?
Bigger Updates
There were a few smaller improvements, but the big feature added this time around is filtering, to help view your diagram in different ways.

Filters
One problem that became apparent in the first discourse session is that it’s easy to get lost when your diagram gets big:
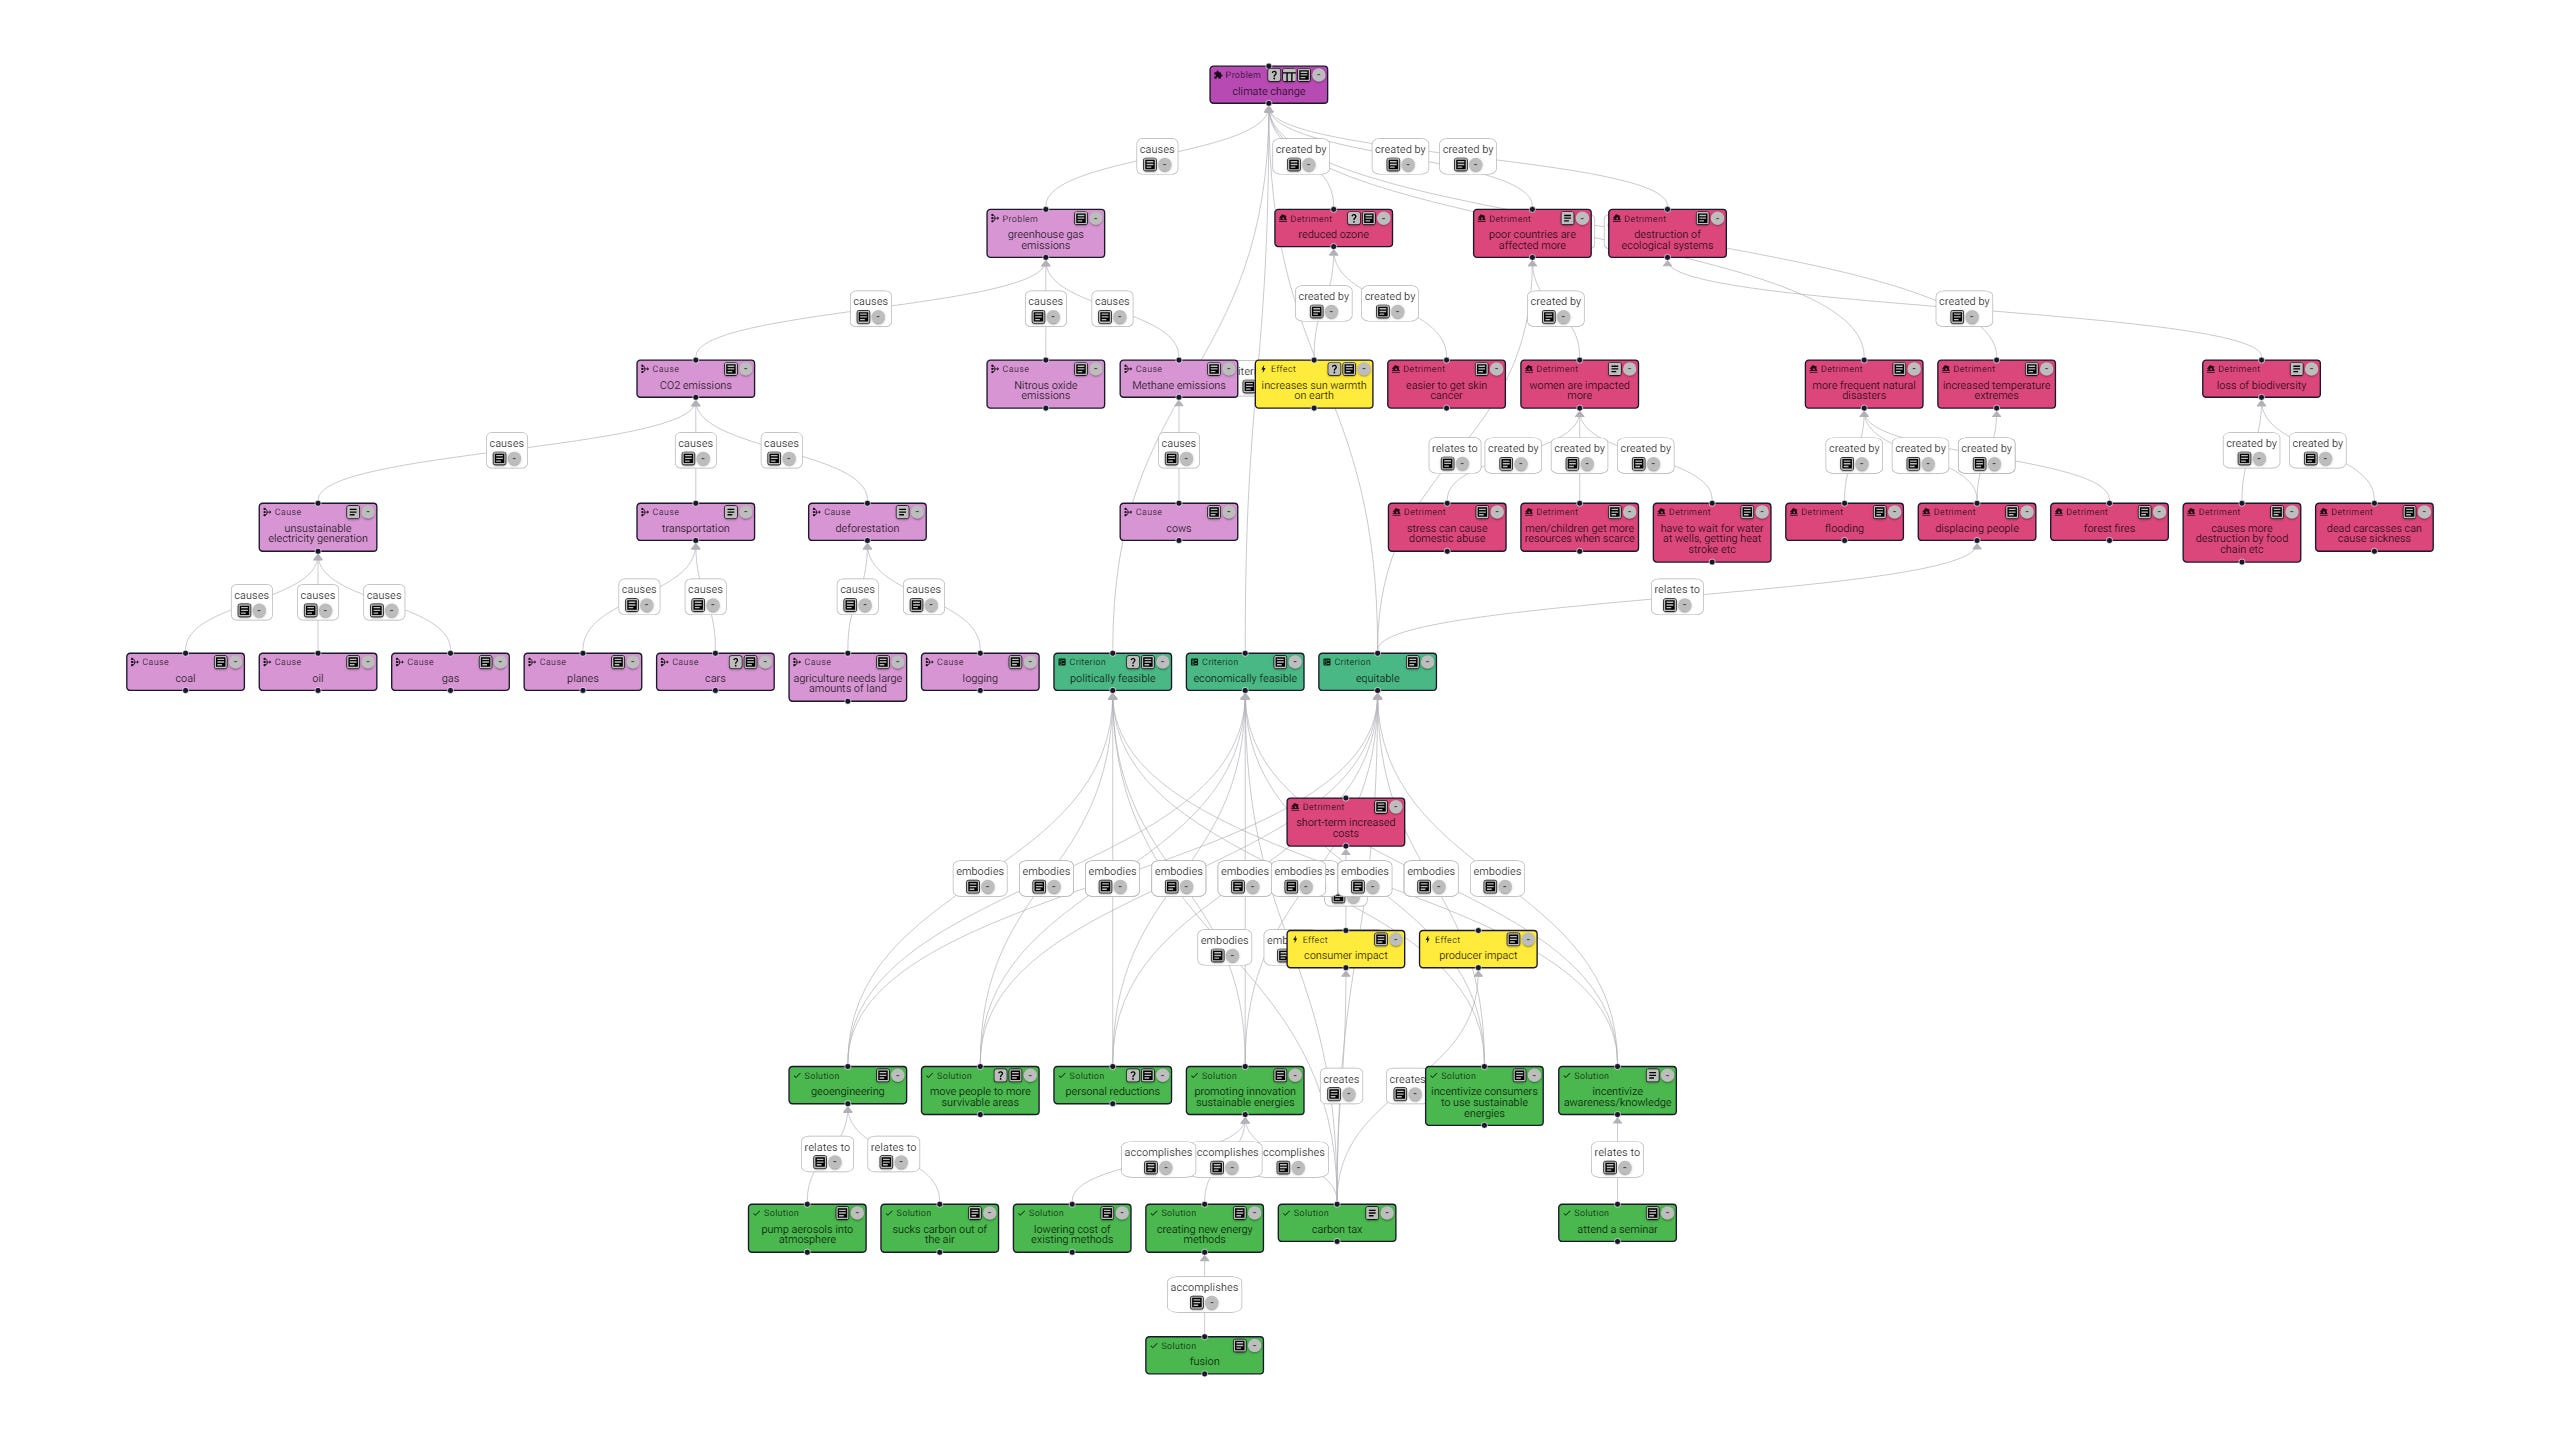
To address that, some filtering options have been added:
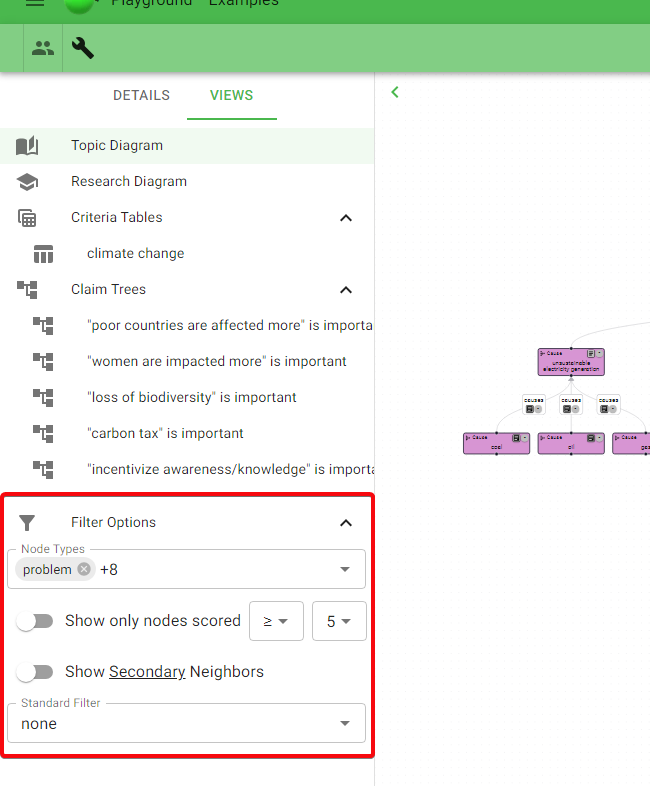
There are some general filter options:
Choose which node types to display (e.g. only Problem and Solution nodes)
Show only nodes that have scores within a specified range (this also works to filter the Criteria Table)
Show “Secondary Neighbors”, e.g. show relevant Questions in the Topic Diagram, show relevant Problems in the Research Diagram (renamed from “Explore Diagram”)
And predefined standard filters:
high level: show only immediate causes, effects, and solutions of the problem(s)
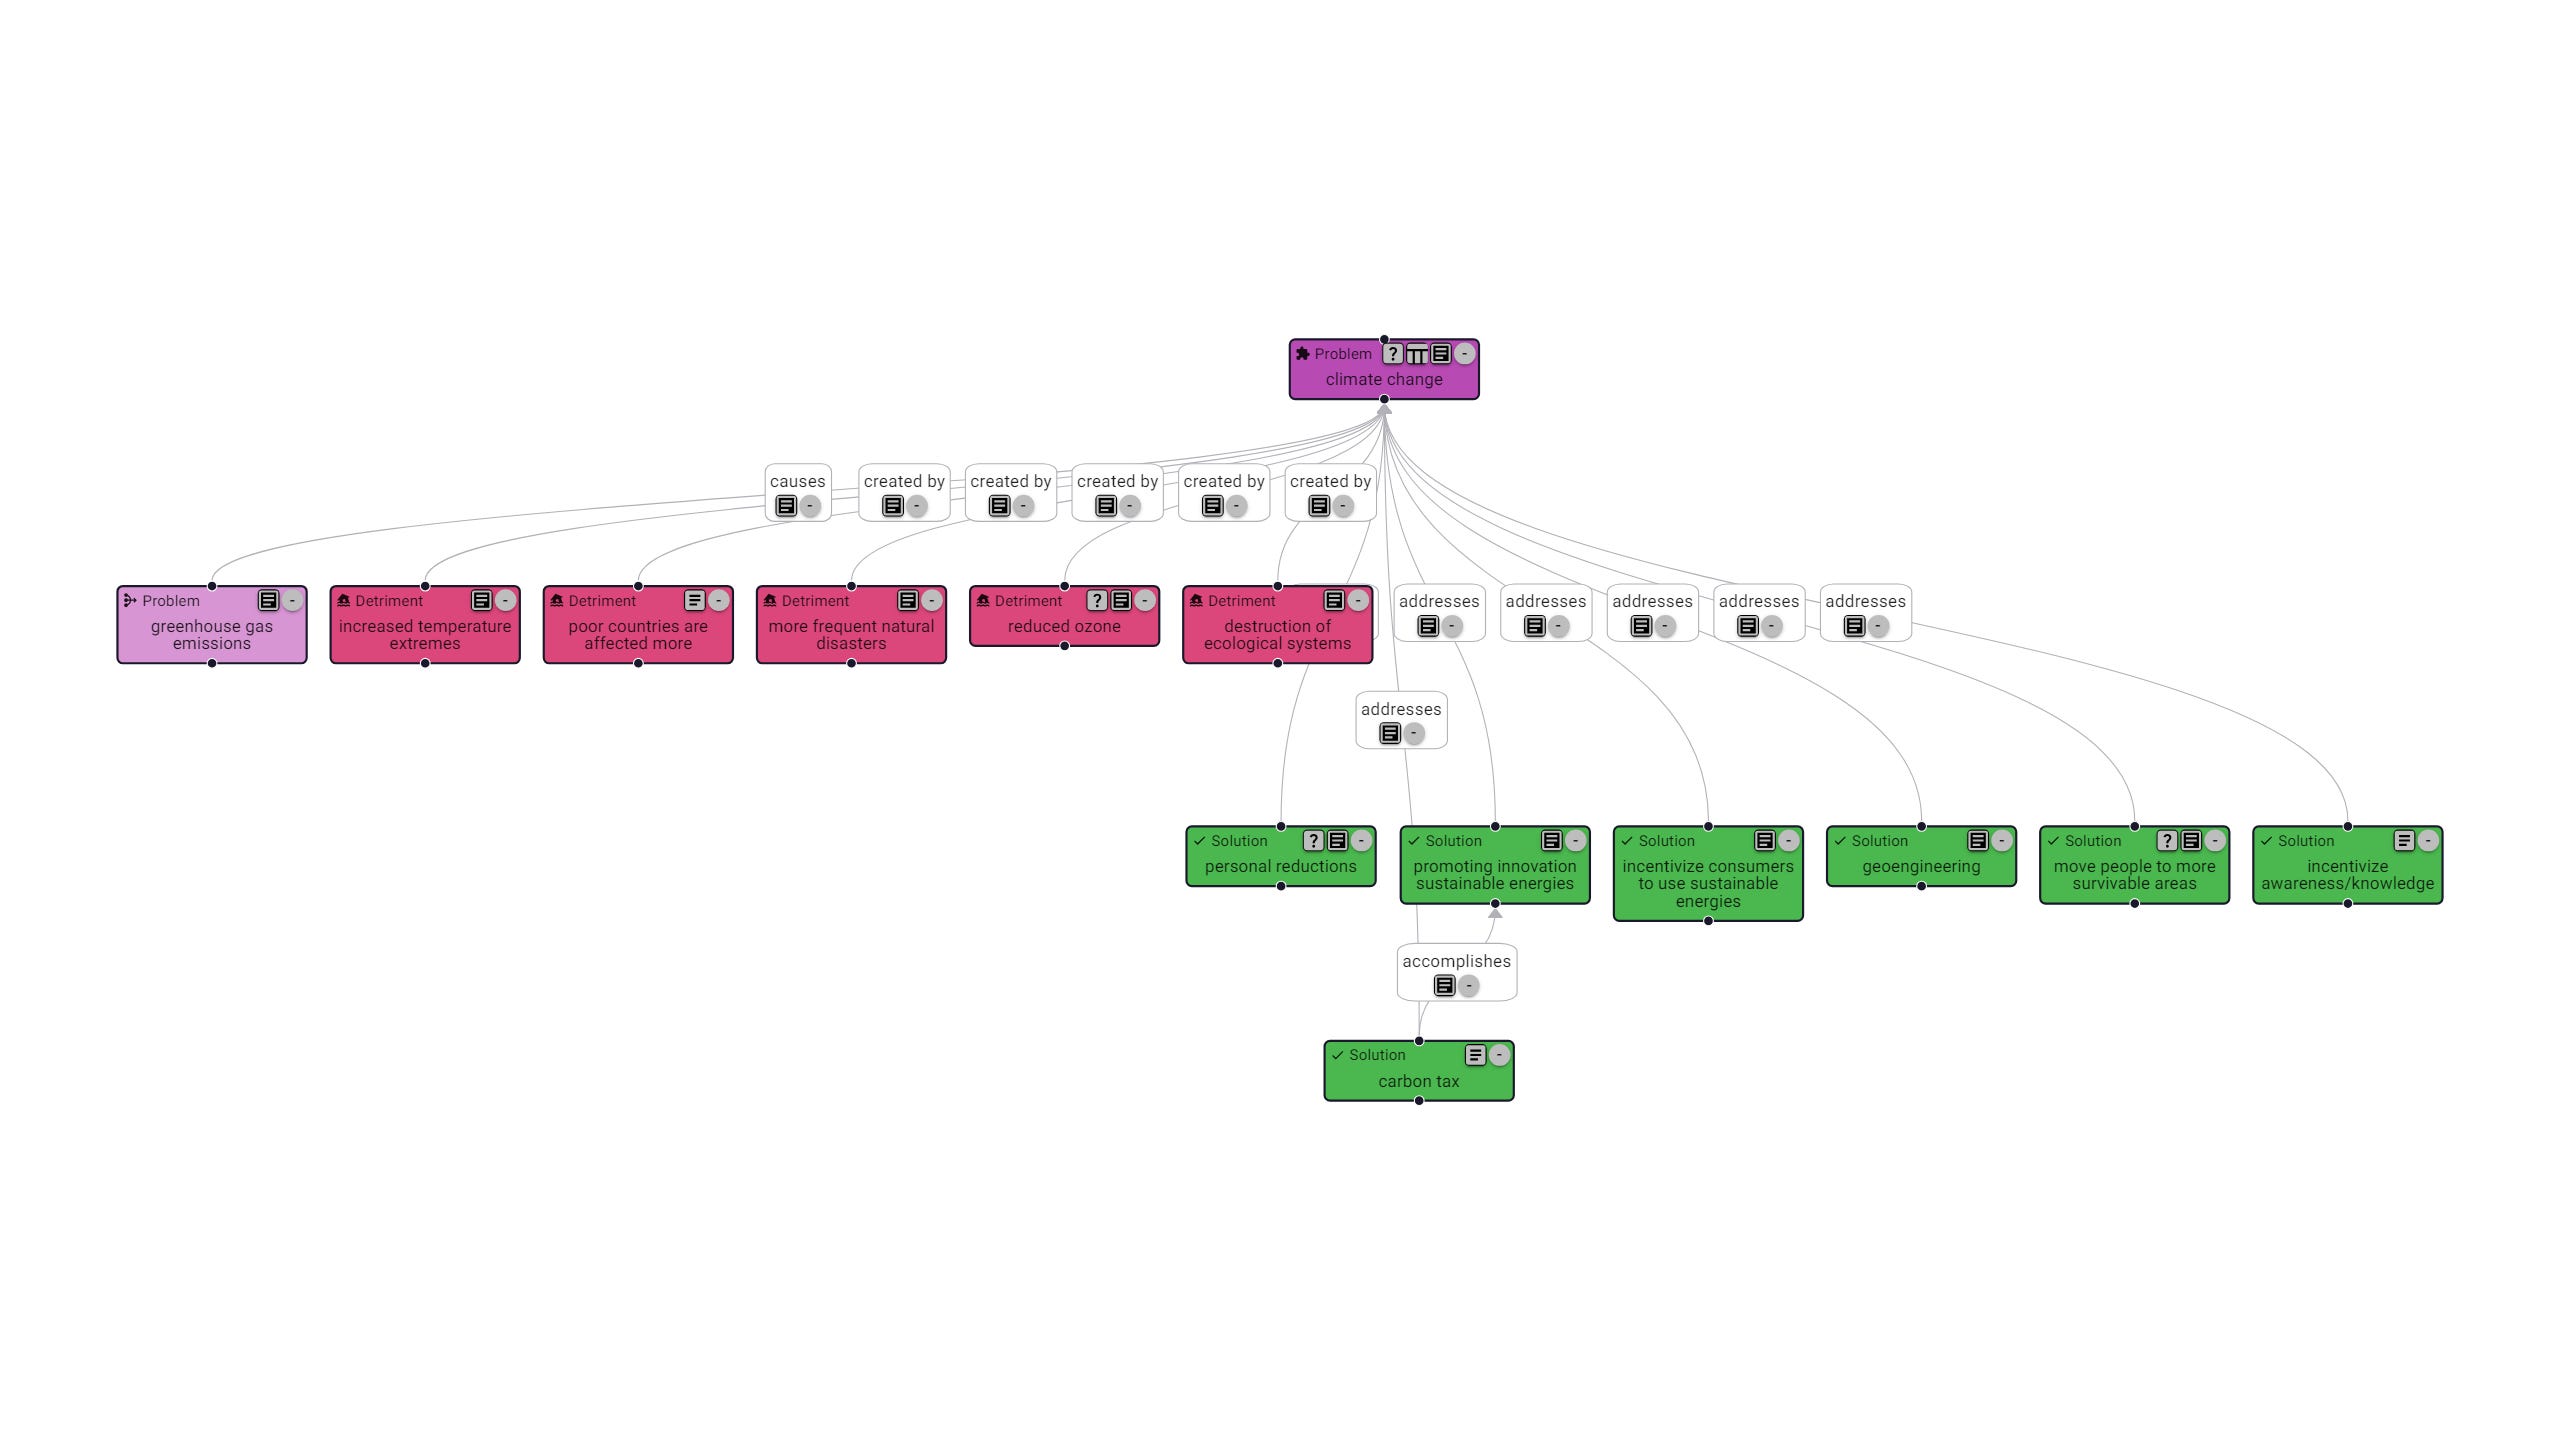
problem: for a problem, show all causes and/or effects and/or criteria and/or solutions
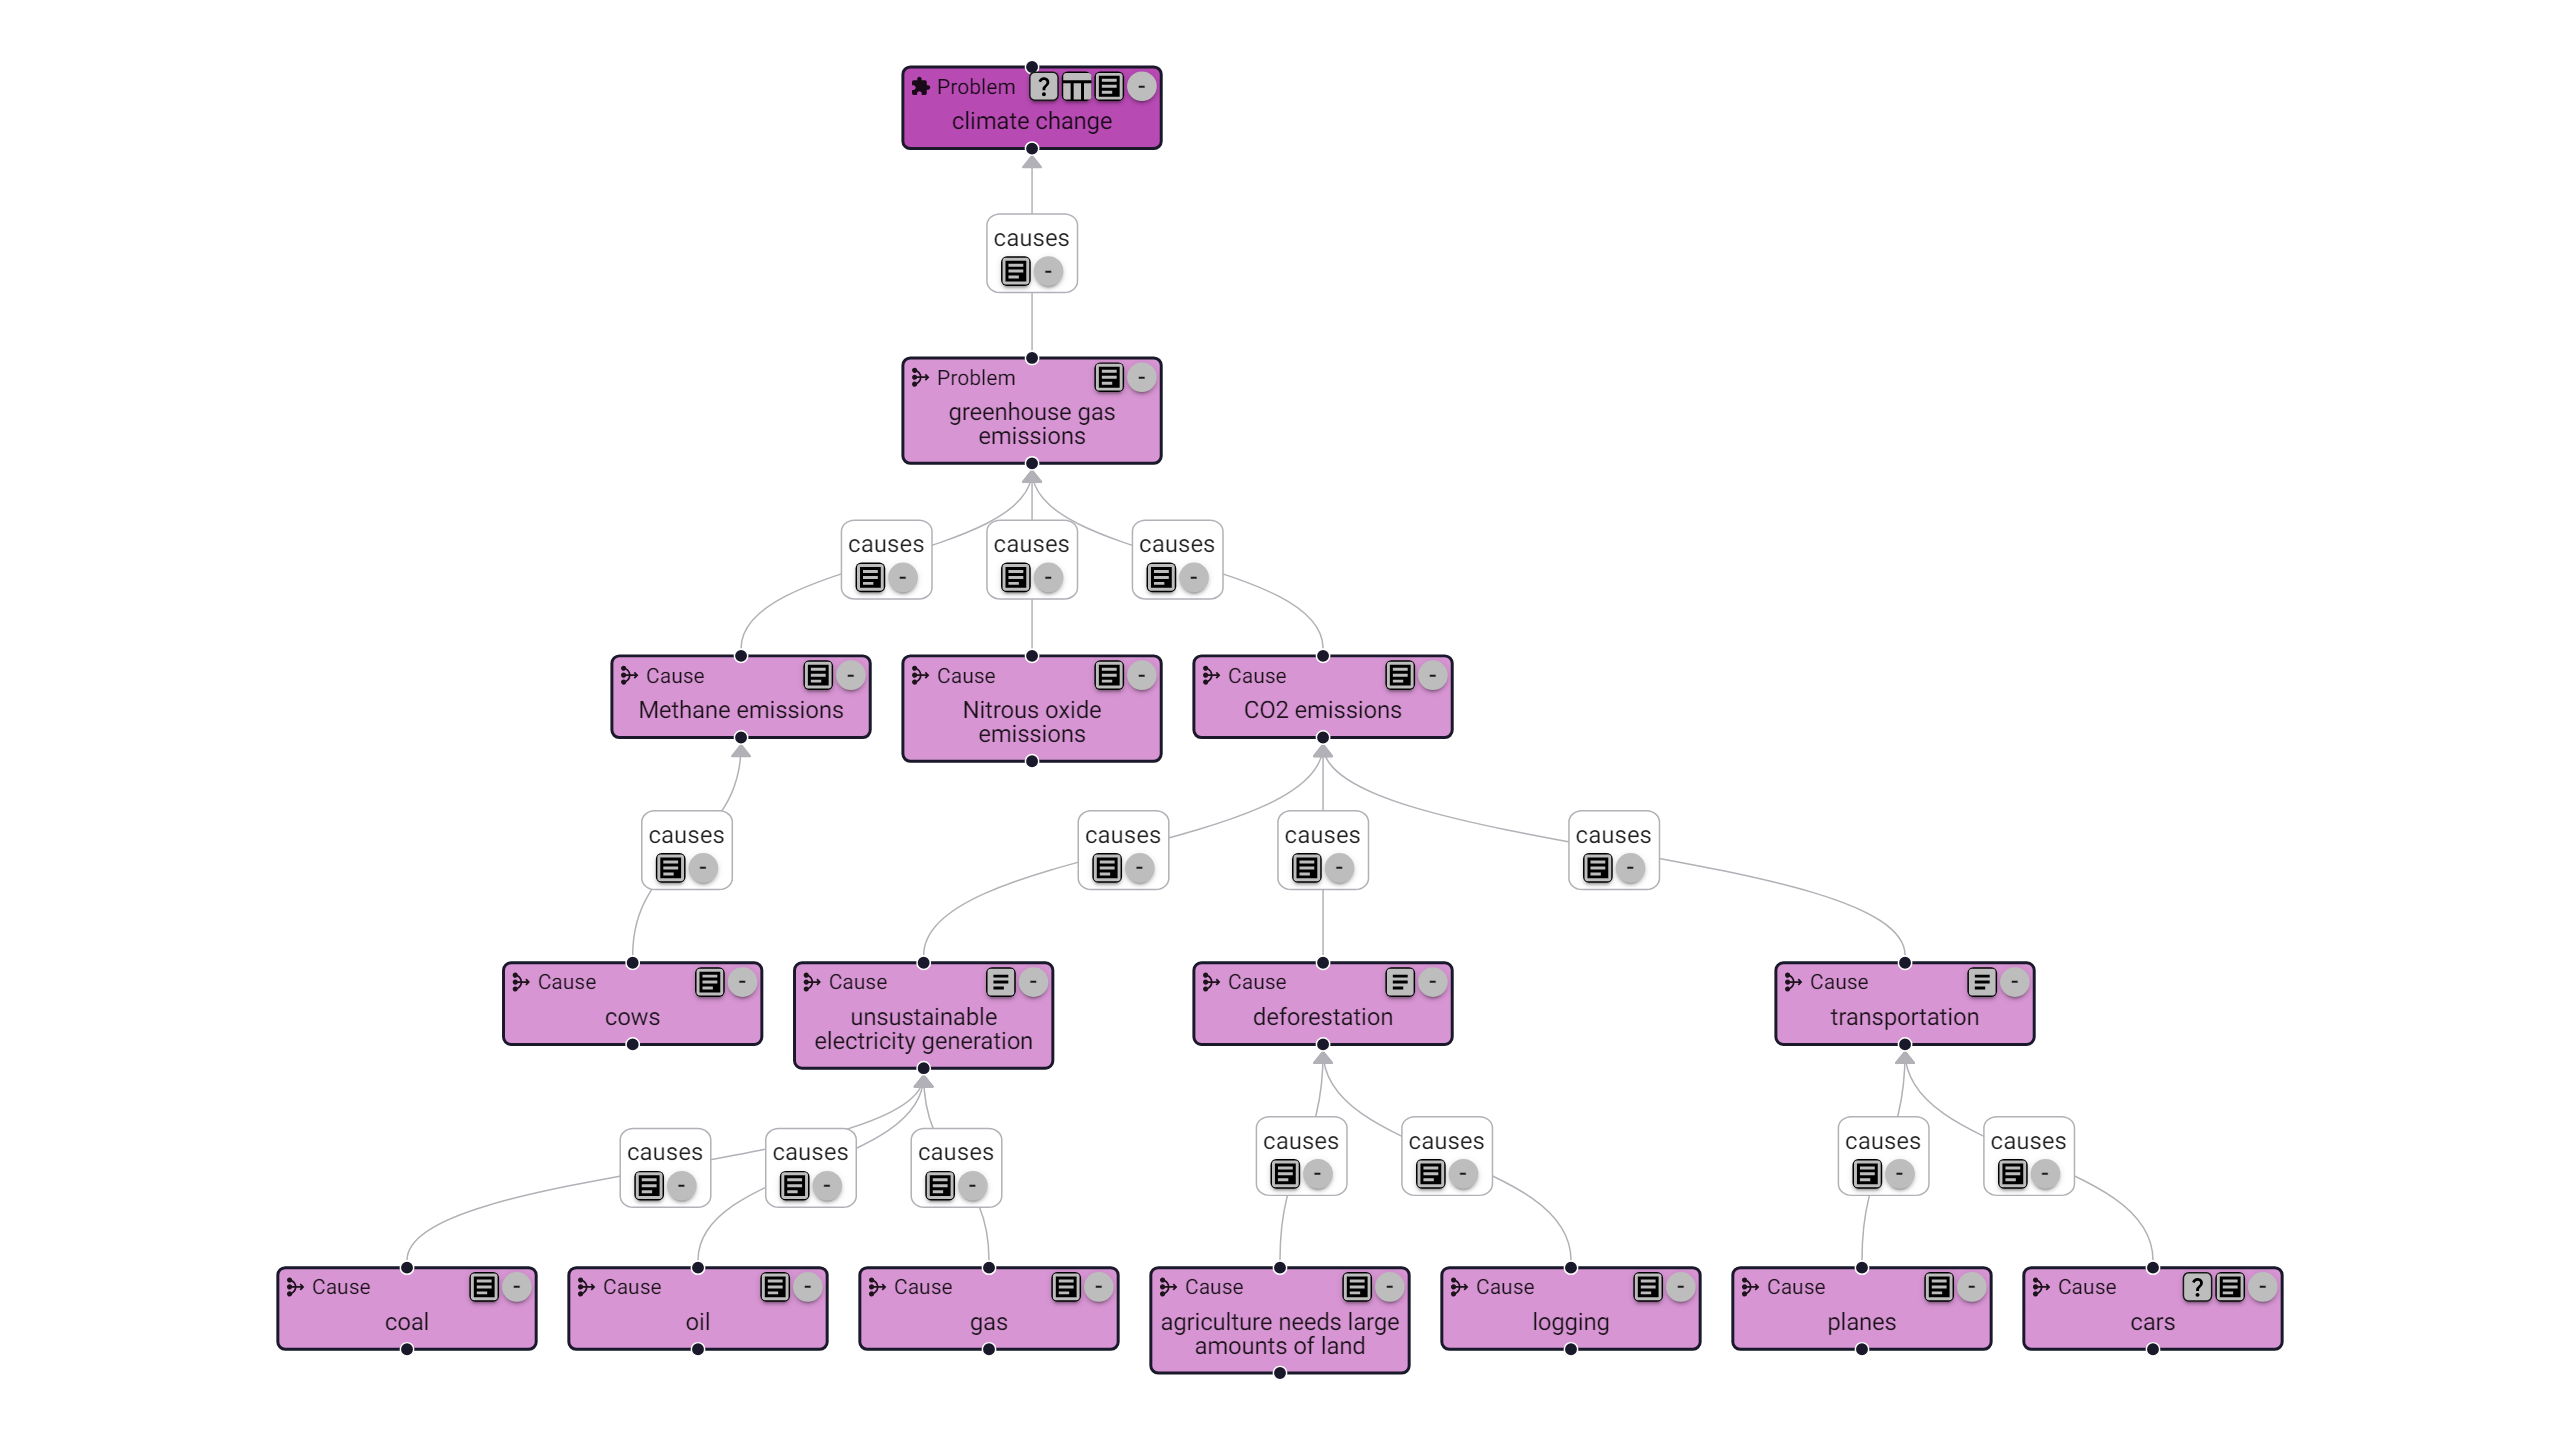
tradeoffs: show selected criteria and/or solutions, with or without their details (effects/components) (this also works to filter the Criteria Table)
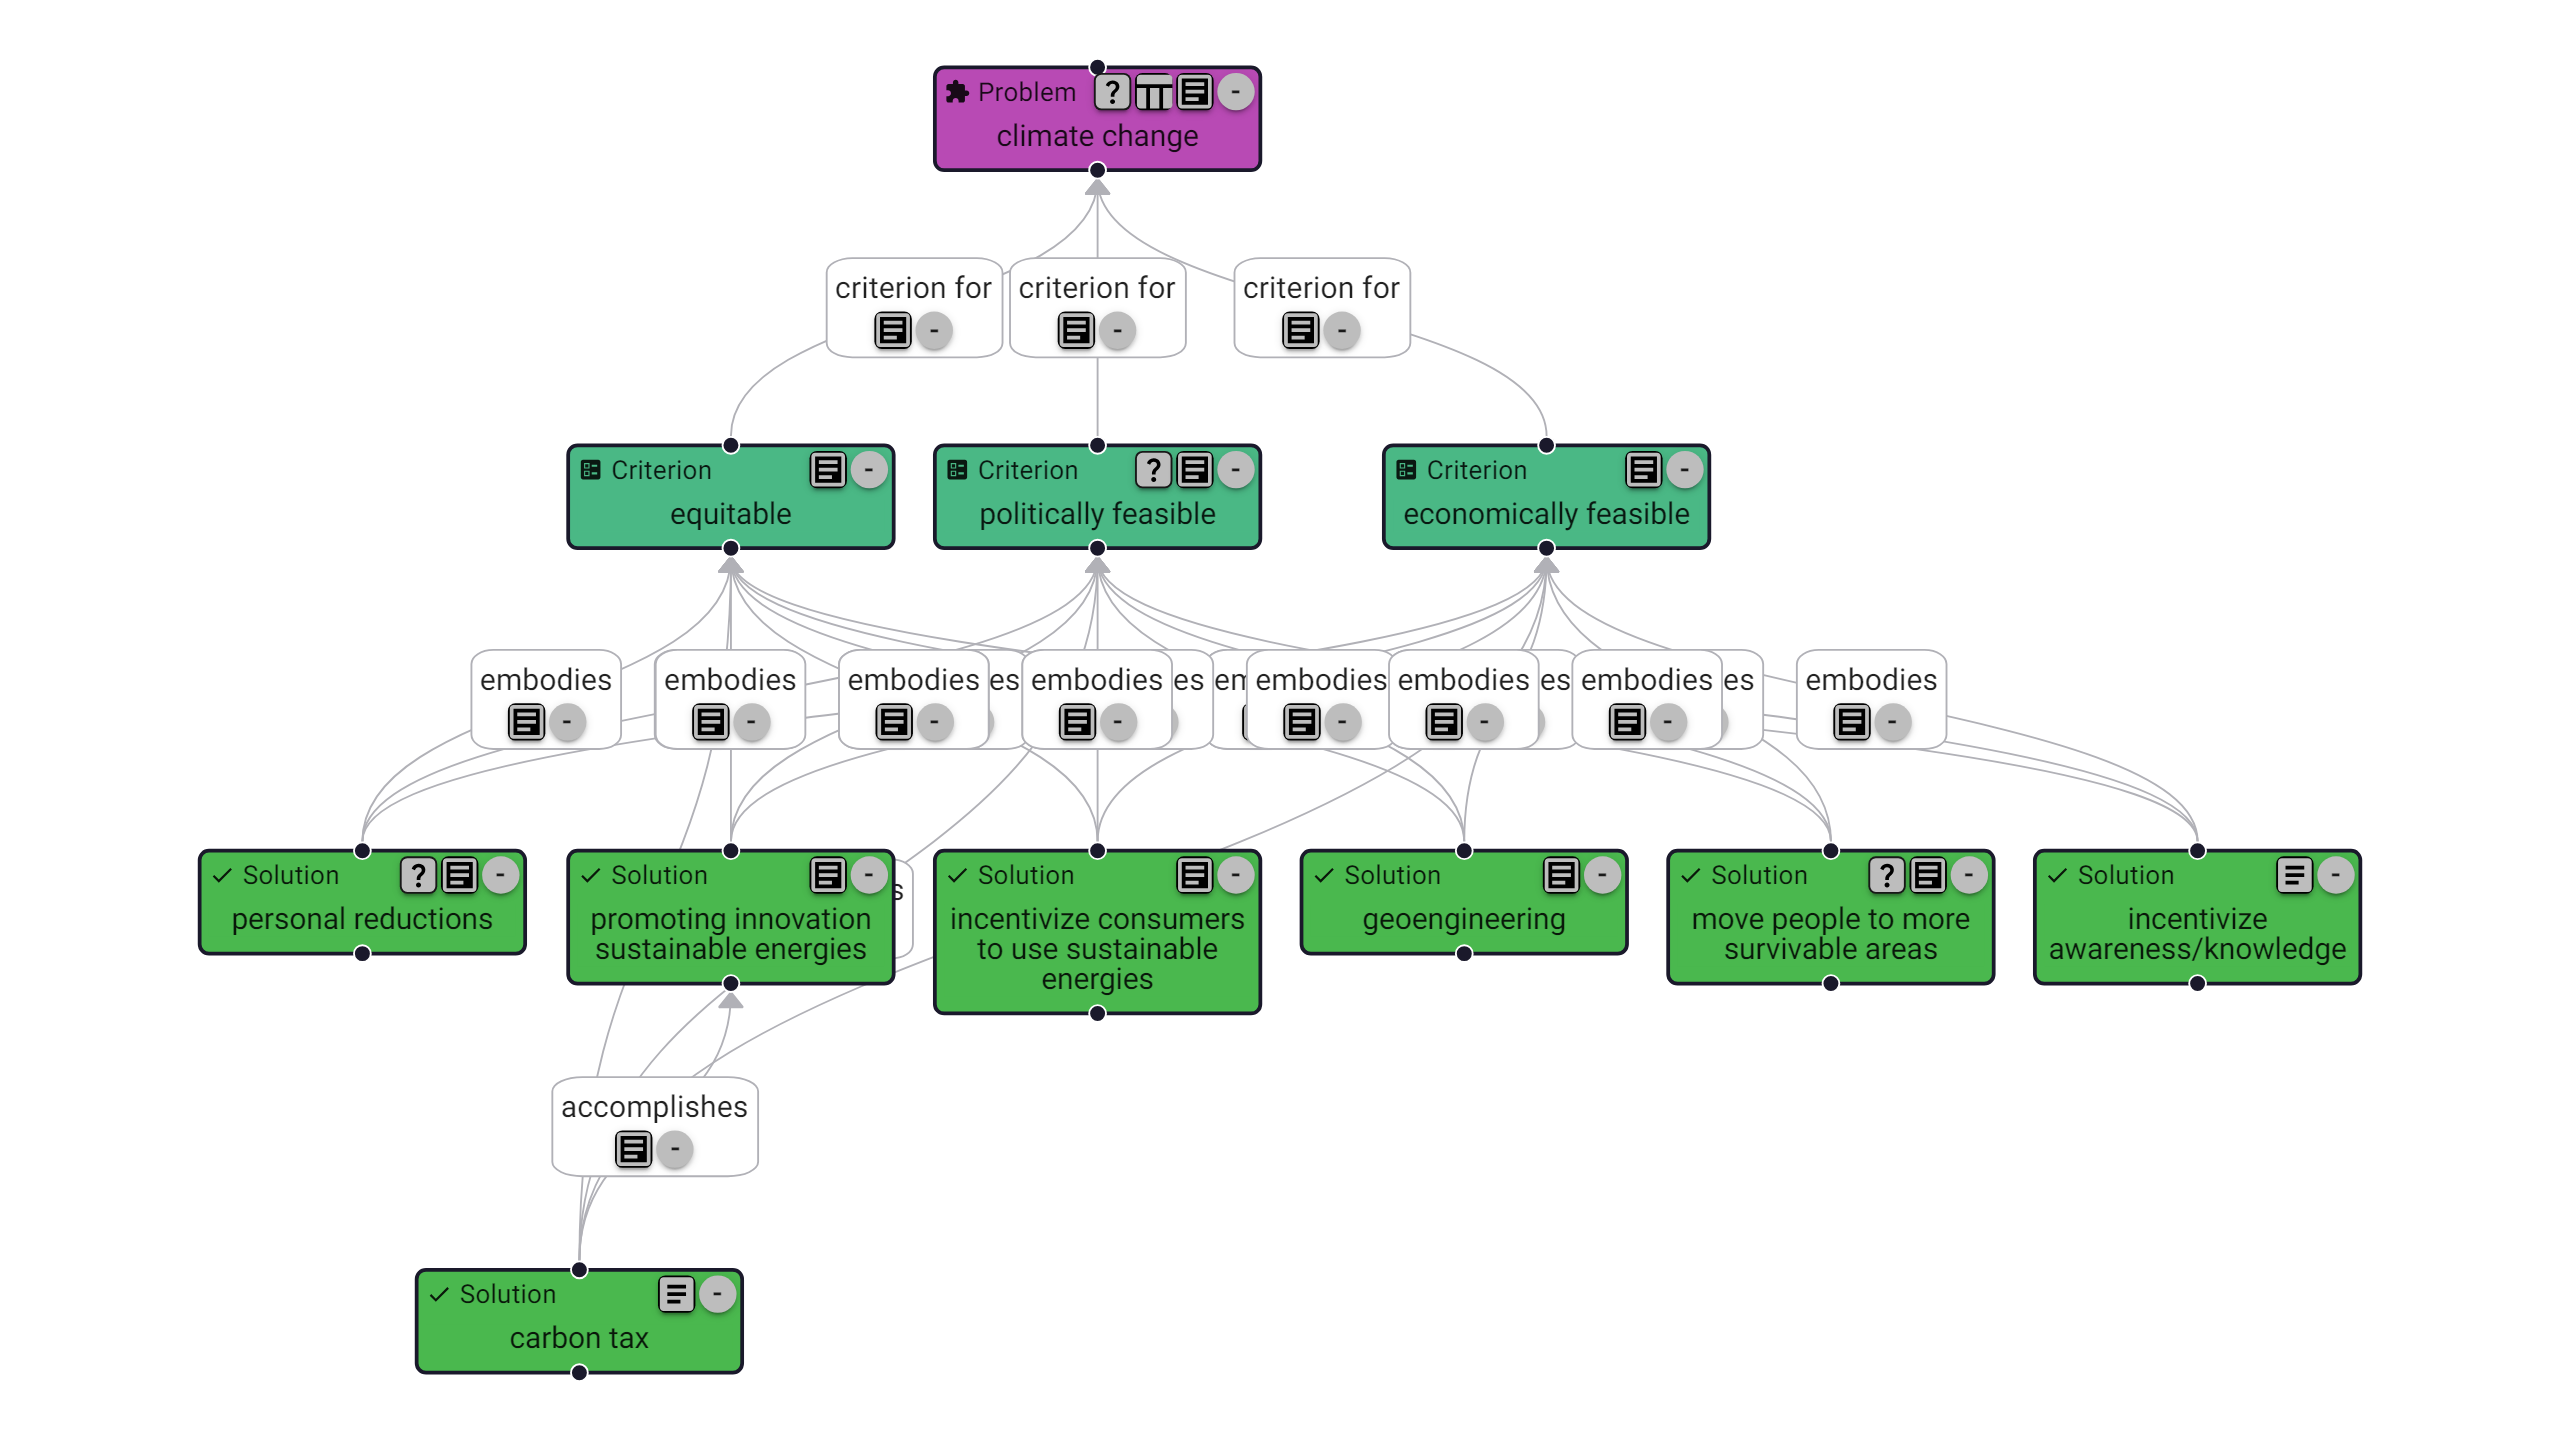
There are a few other standard filters, but that at least gives the idea. I think there are probably more useful ways to filter that haven’t been added yet - if you can think of any, let me know!
Documentation
To explain what Ameliorate is and how to get started, all in one spot, I’ve set up a documentation site. Right now, it’s relatively basic - the main thing that’s fleshed out is the Getting Started section - but I’ll add more details over time, as features are added and the app becomes more solid.
If there’s any feature or aspect of Ameliorate that isn’t documented and you’re wondering about or think is worth documenting, let me know!
Smaller Updates
Editing Improvements
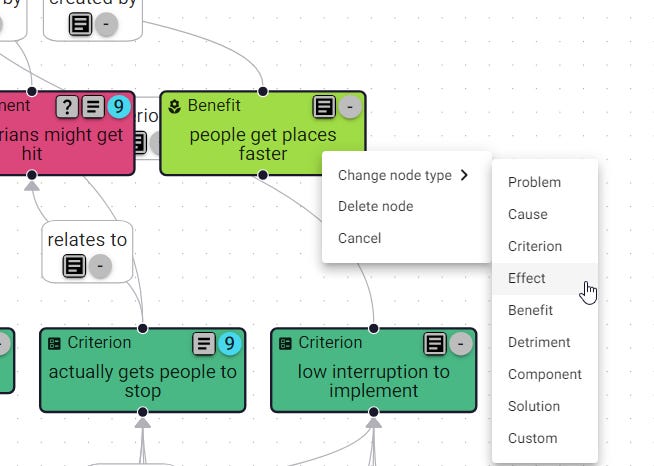
You can right-click on a node or edge to change to another type; sometimes a node makes more sense as another one
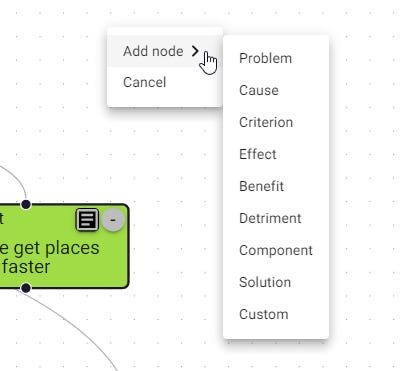
You can right-click on the diagram background to add any node without connecting it to another; sometimes you think of a node that doesn’t yet directly relate to what’s currently in the diagram

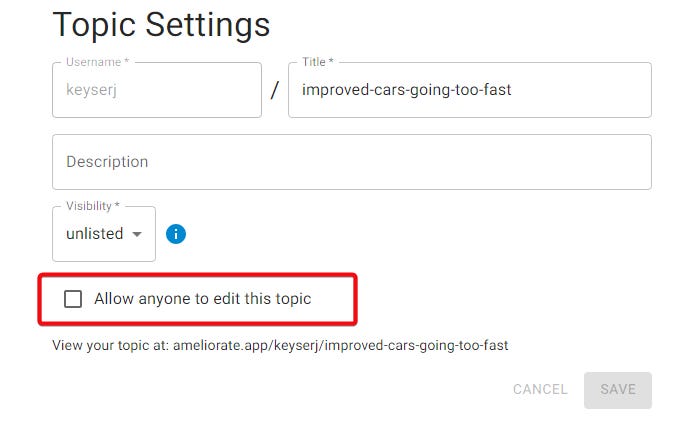
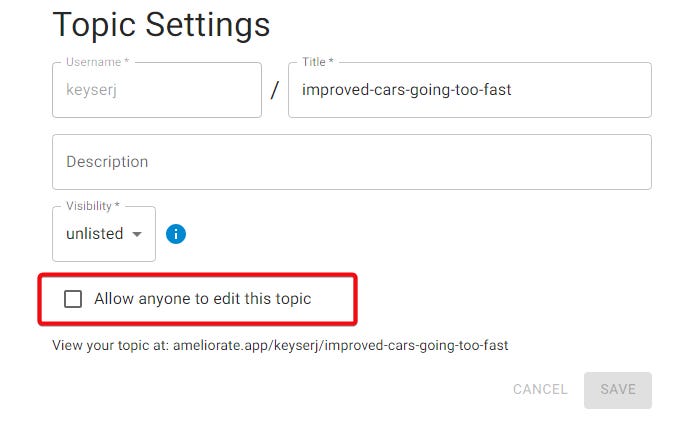
You can allow others to edit your topic; this is nice if you’re working with others and want to expand the topic from a few different angles at once. Right now this isn’t limited to specific users, meaning anyone can modify your diagram if you use this, so be careful with it
New Node Types
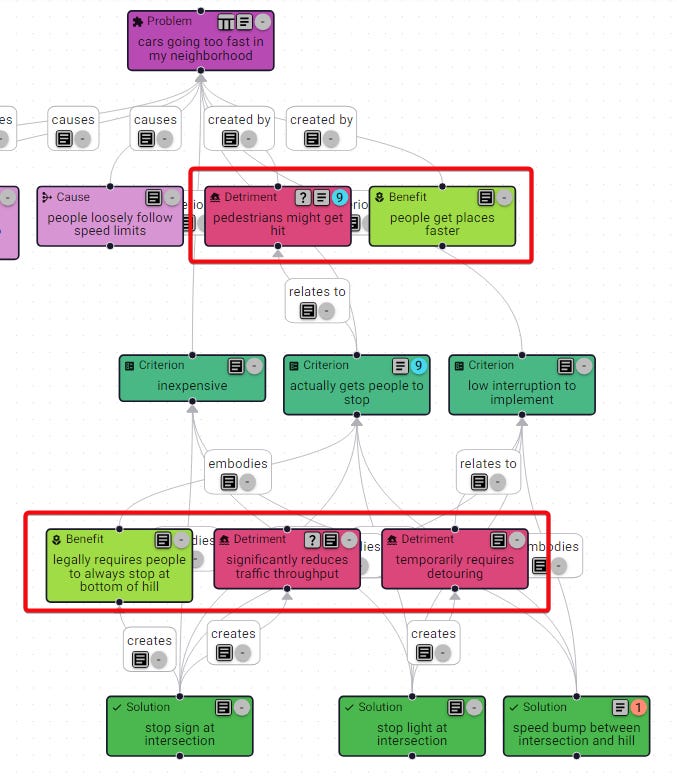
Benefits and Detriments have been added to allow for more-specifically conveying what’s good or bad about a problem or solution
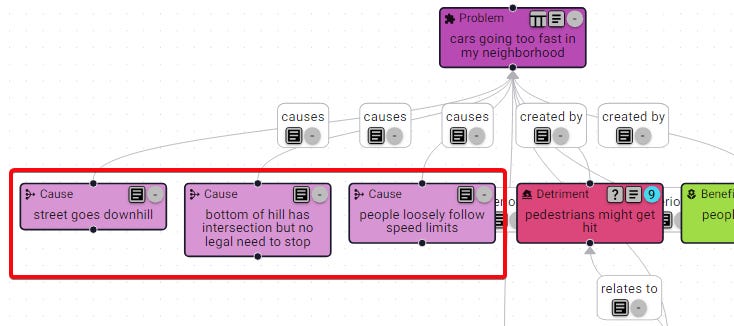
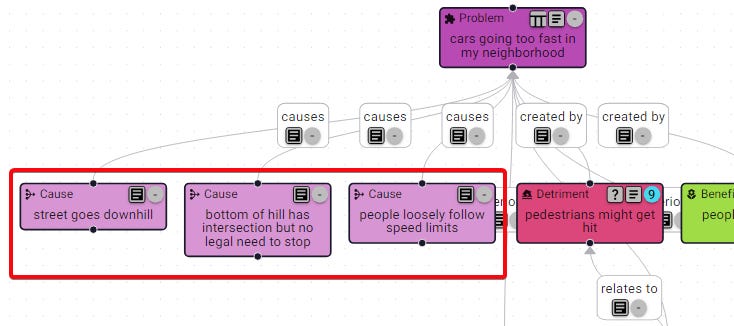
Causes have been added to distinguish a special kind of problem: one that is concerning primarily because it causes another problem
Misc
Not a feature, but I’ve defined “classes of information” to help distinguish structural nodes (problem, effect, solution, component, etc) from research nodes (questions, facts, sources) from justification nodes (supports, critiques)
You can add URL parameters “selected” and “view” to share your topic from a specific view and/or with a specific node selected, such as https://ameliorate.app/examples/detailed-cars-going-too-fast?selected=52d5ad5b&view=researchDiagram
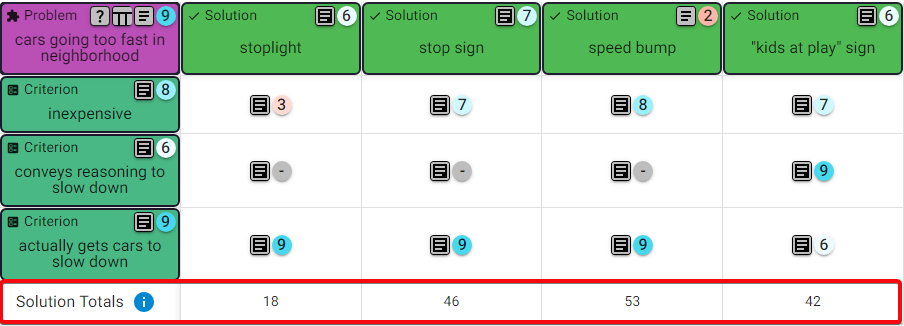
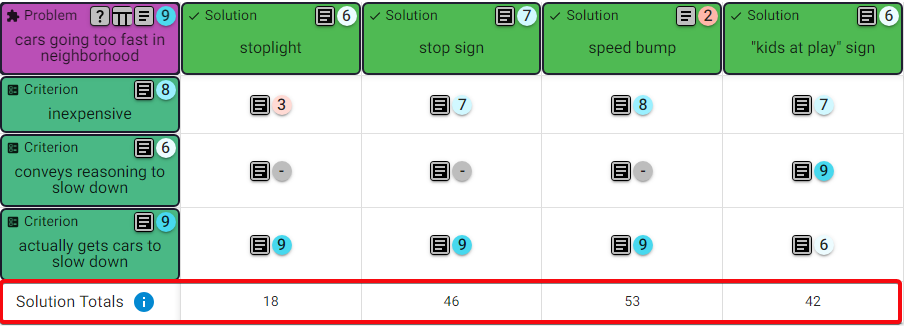
There are solution totals calculated for the Criteria Table; totals will be positive if the solution does well embodying Criteria, and negative if not, and more so if the Criteria are scored as important
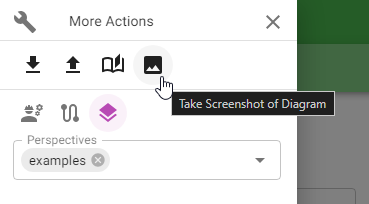
You can download a high-quality screenshot of your diagram for showing it off! This is hidden in the More Actions drawer (get to by clicking on the wrench). Eventually there’ll be an option to specify the resolution.

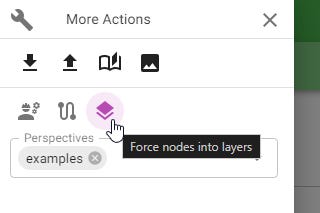
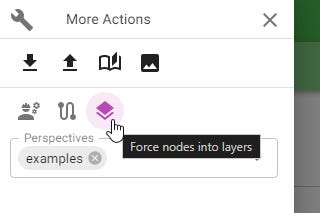
You can slightly adjust the diagram layout by turning off the default of forcing nodes into hierarchical layers by their type; this can sometimes help the diagram look better
What’s Next?
There are a small number of issues planned for the near-future in the backlog, but I plan to continue prioritizing feedback from discourse sessions, as that’s been working out pretty well! If you’d like to join a session, check out the new documentation on it.
That's all for today! Thanks for reading, and don't forget about the demo this Wednesday 3/20/24 at 7pm 🔥.
Cheers 🙂
Understand ourselves. Understand each other. Grow together.
Ameliorate.
Comments
Nothing yet. Say the first thing.
Sign in to join the conversation.