
Ever feel like you’re always late to trends?
Or worse… you finally enter and get stopped out right before the real move?
What if one indicator, one signal, no filters, was enough…
This post breaks down a strategy built around the SuperTrend indicator, a trend-following system that strips everything back to a single crossover signal with an ATR-based trailing stop doing the heavy lifting on the exit side.
Just price, volatility and a clean rule for when to get in and when to get out.
Markets trend more often than most people think, just not in a straight line.
They move in bursts.
Expansion → pullback → continuation.
The challenge isn’t identifying trends. It’s staying in them.
Most traders exit too early during noise. Or enter too late after the move is obvious.
This strategy leans on volatility-adjusted levels to define trend direction and only flips when the market truly shifts.
The entry makes sense because it only triggers when price proves strength by reclaiming a volatility-adjusted level.
The exit is just as important, it cuts the position when that same structure breaks.
In other words:
You’re not predicting the trend. You’re reacting to it.
Most traders hear “trend-following” and immediately start to add stuff to the strategy.
Better entry. Tighter filter. One more confirmation.
The equity curve looks cleaner. The win rate ticks up. And somewhere in that process, the actual edge quietly disappears.
I've learned this the hard way, trend-following doesn't reward complexity. It rewards patience. It works because markets move in sustained bursts and you’re on the right side of them long enough to matter. The moment you start optimizing for every wiggle, you stop catching the moves that make the whole thing worthwhile.
Stay consistent. Let it run. That’s the job.
Market: US Equities Index
Instrument: Nasdaq100 (Futures)
Broker: IG Market
Platform: ProRealTime
Timeframe: Daily
Backtest period: Jan 2005 - April 2026
Spread/Costs: 1 Points included
A note on expectations: 4.59% CAGR looks weak next to the Nasdaq 100's ~15% annualised return over the same period and it is, on a raw return basis. But this isn't a buy-and-hold comparison. This is a futures strategy that's in the market only 60% of the time, with a max drawdown under 15%. The buy-and-hold Nasdaq drawdown over this period exceeded 80% (2008) and 35% (2022). What you're trading off is raw return for significantly smoother equity curve and defined risk. Whether that trade-off is worth it depends entirely on your risk tolerance and whether you're running this alongside other strategies in a portfolio.
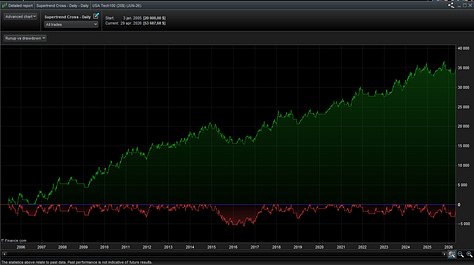
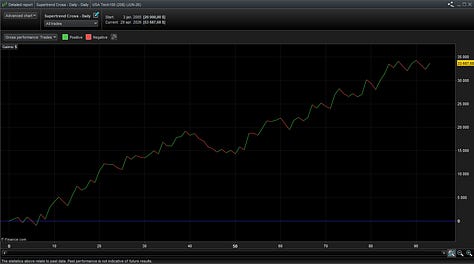
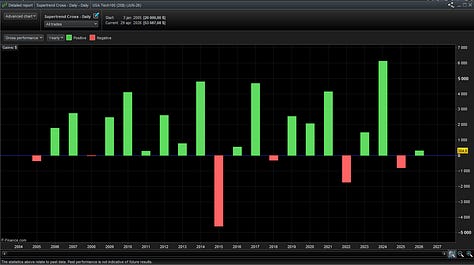
Key Stats:
Total Gain: +33 687$
Average Gain per Trade: 362$
Total Trades: 93
Winrate: 52.69%
Max Drawdown: -14.22%
Risk/Reward Ratio: 1.8
Time in Market: 60.83%
Average Trade Duration: 34 days 5 hours
CAGR: 4.59%
MAR Ratio: 0.32
Market: Commodities
Instrument: Gold (Futures)
Broker: IG Market
Platform: ProRealTime
Timeframe: Daily
Backtest period: Jan 2005 - April 2026
Spread/Costs: 0.5 Points included
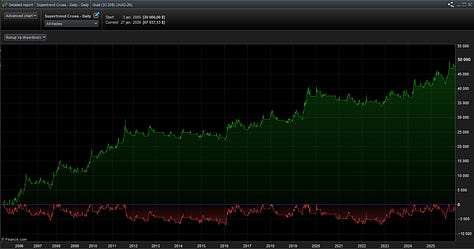
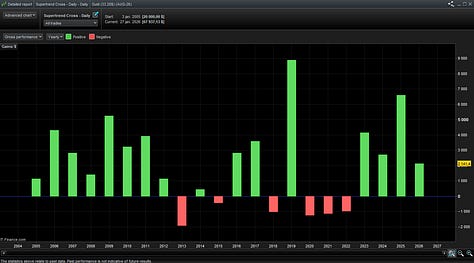
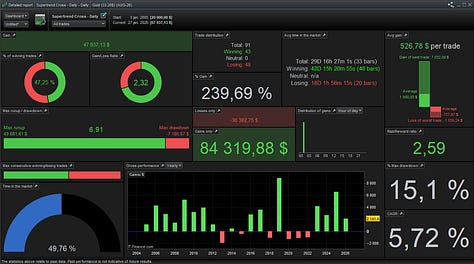
Key Stats:
Total Gain: +47 937$
Average Gain per Trade: 526$
Total Trades: 91
Winrate: 47.25%
Max Drawdown: -15.10%
Risk/Reward Ratio: 2.59
Time in Market: 49.76%
Average Trade Duration: 29 days 16 hours
CAGR: 5.72%
MAR Ratio: 0.38
Track This Strategy’s Real Performance
Want to see how this strategy (and all my others) are actually performing?
I’ve built a public tracker that shows the real returns of every strategy I’ve published.
👉 View the strategy tracker here
Gold outperforms Nasdaq on almost every risk-adjusted metric here, better win rate, better R/R, lower time in market and higher CAGR despite similar drawdown. That’s not a coincidence.
SuperTrend works best in markets that trend cleanly and mean-revert less. Gold and other commodities tend to enter long multi-year secular trends driven by macro factors like inflation, dollar weakness, crisis demand and then consolidates sideways rather than sharply reversing. That’s an ideal environment for a volatility-adjusted trailing system.
The Nasdaq, by contrast, is a mean-reverting growth asset at heart. It trends strongly during bull phases but has violent drawdowns and whipsaw behaviour during corrections. The SuperTrend catches the bull runs well, but the ATR-based stop gets punished during sharp reversals where volatility spikes exactly when you need the stop to be tight.
This is where things get interesting.
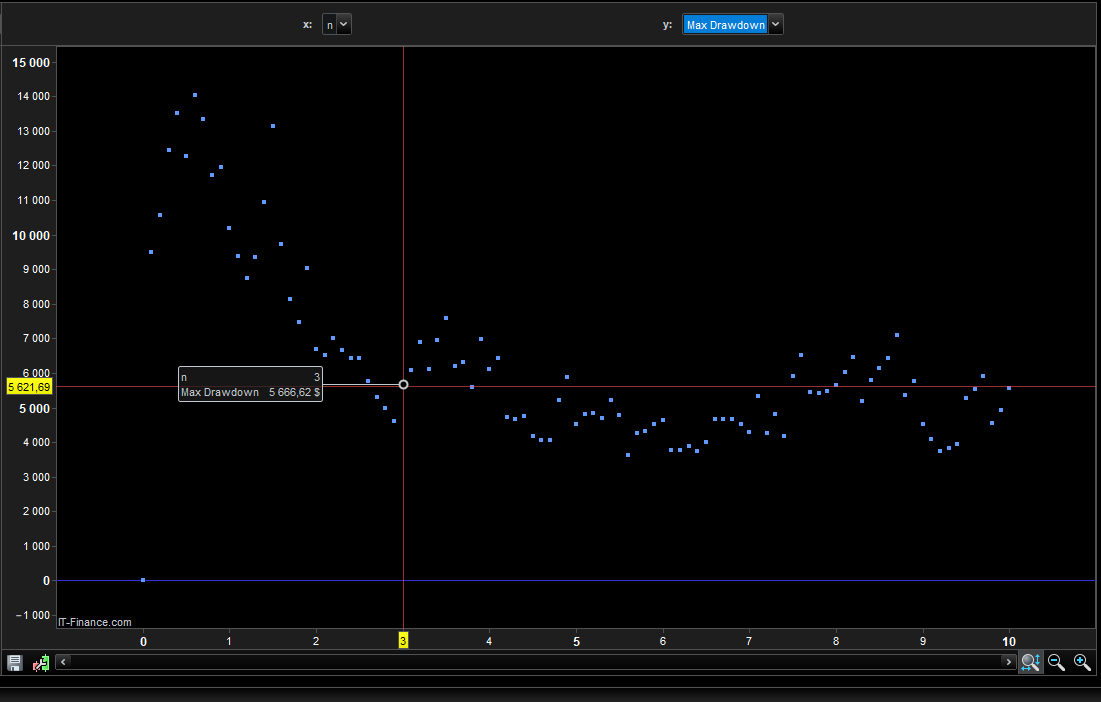
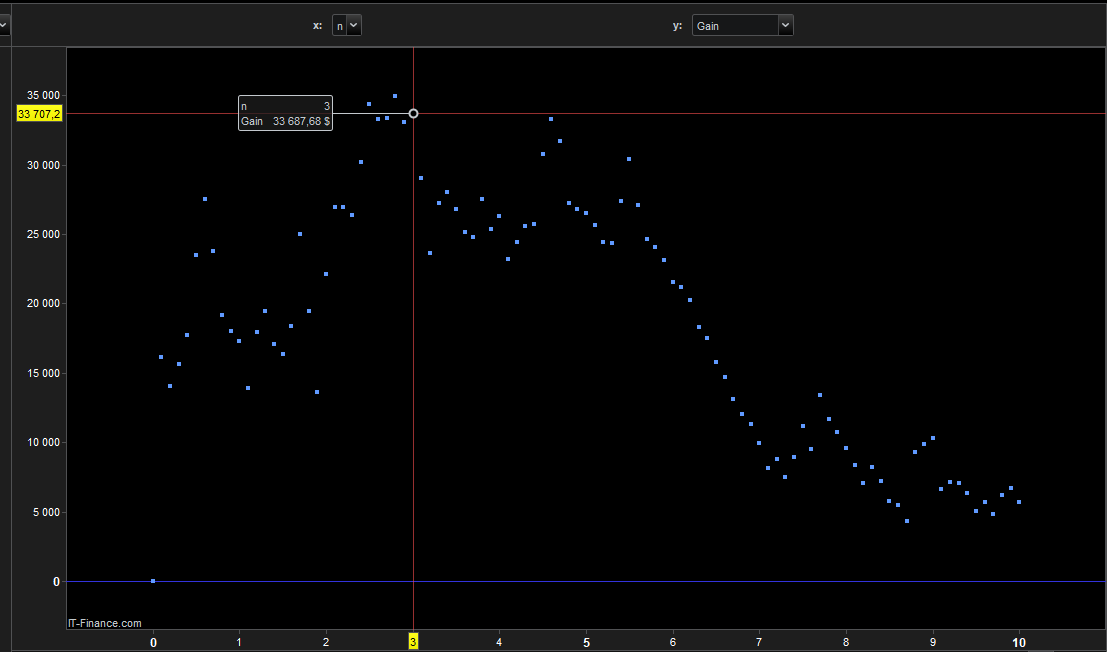
The multiplier parameter (used in the SuperTrend) has a huge impact on performance.
In this test, the baseline uses:
Multiplier = 3
But here’s what the parameter sensitivity looks like:
Here’s what actually happens outside that range:
When the multiplier drops below 2, the SuperTrend line hugs price too closely. The strategy starts whipsawing, frequent flips in and out with small losses that grind the account down. Total trade count roughly doubles, win rate drops below 40% and drawdown expands toward 25–30%. It doesn’t blow up catastrophically, but it erodes edge quietly and consistently.
When the multiplier rises above 4, the opposite problem emerges. The trailing level is so wide that winning trades give back enormous amounts before triggering an exit. A few large winners still occur, but average gain per trade collapses and time in market balloons toward 80%+, which means more exposure during drawdowns for diminishing reward.
The sweet spot is roughly 2.5 to 3.5, that’s narrow. This is the core live-trading risk. If you were to forward-test this and the optimal multiplier had shifted (which is likely across different volatility regimes), you’d be running a degraded version of the strategy without knowing it.
[Full strategy code, available to paid subscribers]
Comments
Nothing yet. Say the first thing.
Sign in to join the conversation.