
This is the fourth article in a series based on AI Dev Tools Zoomcamp, the free course we run at DataTalks.Club.
All articles in the series:
Part 1: AI-Native Development: Specifications, Loop and Graph Engineering
Part 2: Build and Ship a Full-Stack App with AI Coding Assistants
Part 4: DevOps and Observability for an AI-Built App (this article)
Part 5: TBA
In part 2, we developed an application for conducting system design interviews. In part 3, we deployed it to a cloud environment and configured CI/CD.
In this article, we’ll make this deployment production-ready:
Separate development and production environments
Create a manual CI/CD trigger for promoting the app from development to production
Use OpenTelemetry to collect metrics, traces, and logs and create
Define application-specific metrics and create a dashboard that displays them
Create an alert when the metrics change
Use an AI agent as the on-call responder for the alerts
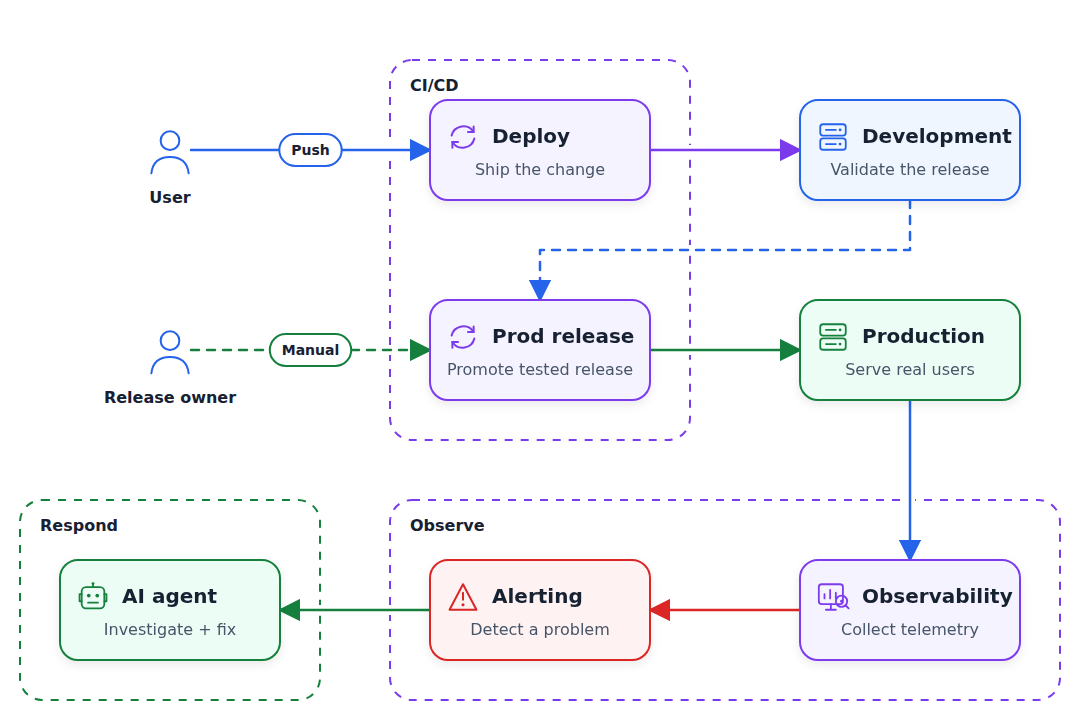
We will continue using AWS and CloudFormation, but the principles we show in this article are tool-agnostic and will work for any environment.
We started building the Interview Canvas project in Part 2: Build and Ship a Full-Stack App with AI Coding Assistants:
We brainstormed with an AI assistant to come up with the specification
Based on that we created a React-based frontend with no backend
Next, we defined the frontend-backend OpenAPI schema
Using the API contract we created the backend
We added database support with SQLite and SQLAlchemy
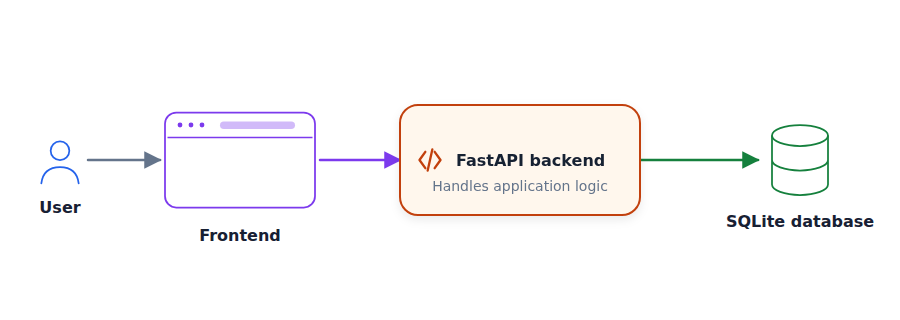
The app was running locally, and then we deployed it in Part 3: Deploy a Full-Stack App with AI Coding Assistants:
We containerized the application
Then added Postgres support
To make sure the system works reliably, we created integration and end-to-end tests
We deployed it to AWS
In the end, we set up CI/CD via GitHub Actions, so every push runs the tests and deploys the app to development
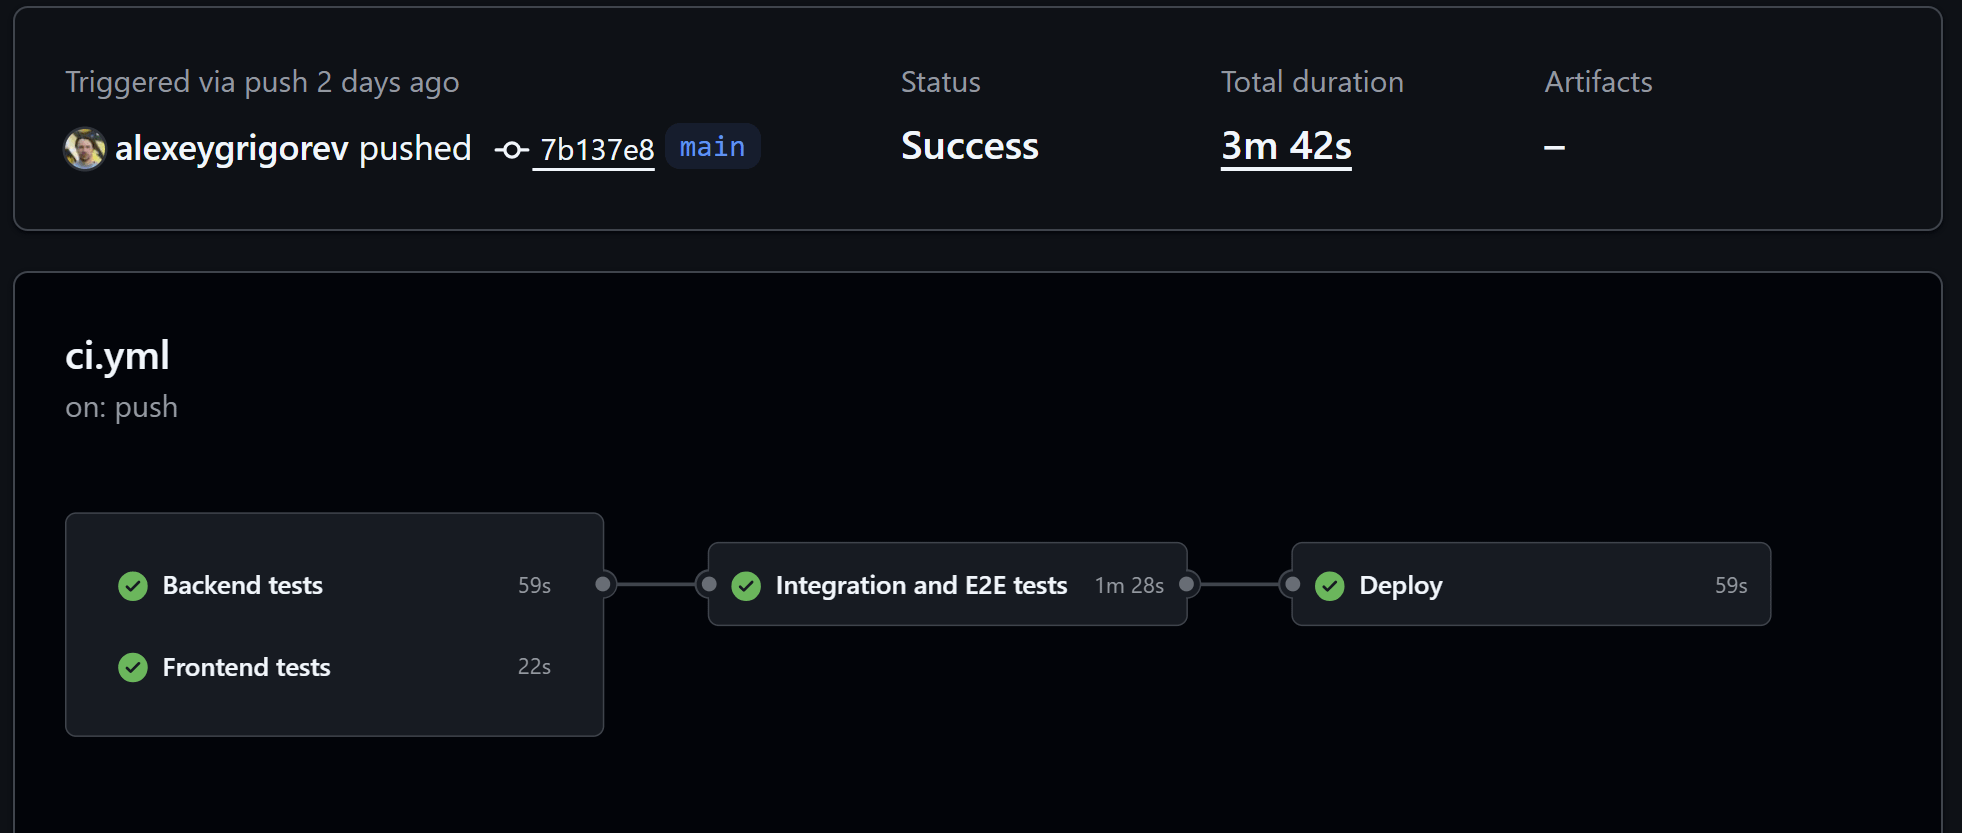
Now we take the application that’s already deployed and make it follow production best practices.
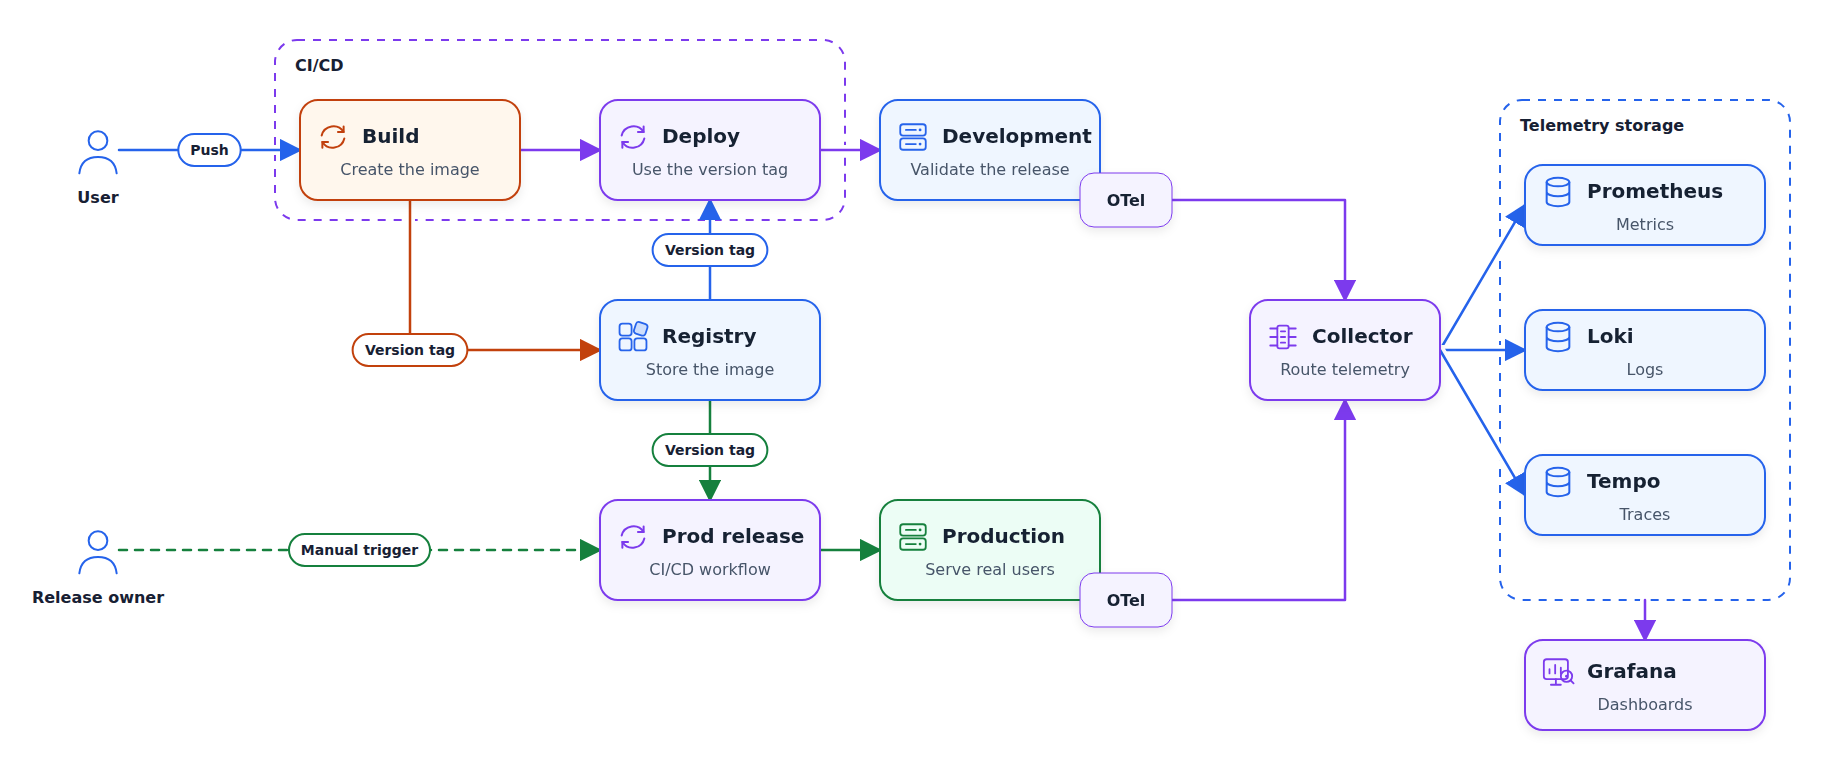
When we push the code, we automatically deploy the changes, and they go live immediately. It’s okay when we are just starting to work on our project. But when we have real users, we want to be more careful and check that our changes didn’t introduce any regressions.
To avoid having this problem, we usually have two copies of the same environment:
Dev (development): the environment we use internally for checking that everything works. Typically we run the latest version of our project there, and every time we push, the changes are automatically deployed there.
Prod (production): this is what our users use. We don’t want to deploy every single change there automatically and we want to have more control over the process.
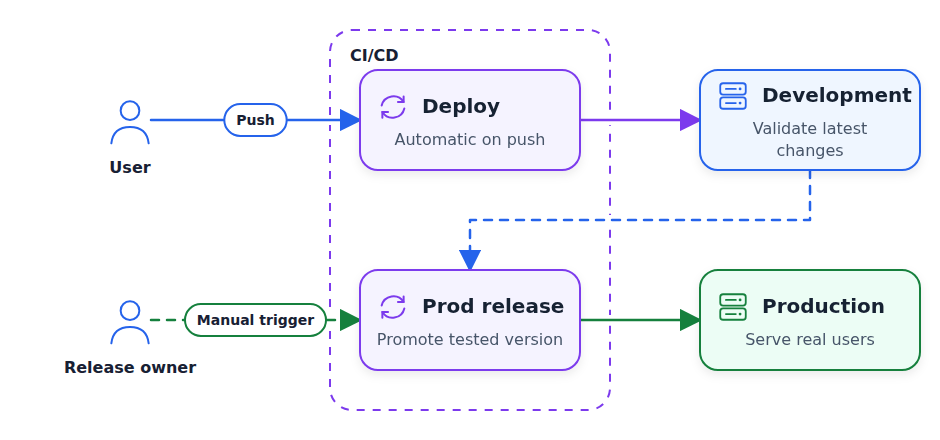
Because we previously defined our infrastructure as code, we can reuse most of it. We will most likely need to change a few things, like the size of the machine where the application is running, but the majority of the resources will stay the same.
Let’s ask our coding assistant to create a copy of the existing environment and call it “production”:
Create a second, independent copy of our infrastructure. We will use the copy as production, and the existing infrastructure as a dev environment.Once we have the prod environment, let’s update our CI/CD. We will only deploy to dev on every push. For production, we will have a manual action that will take whatever development has and promote (apply) it to production.
Create a manual GitHub Actions workflow that promotes the dev version to production.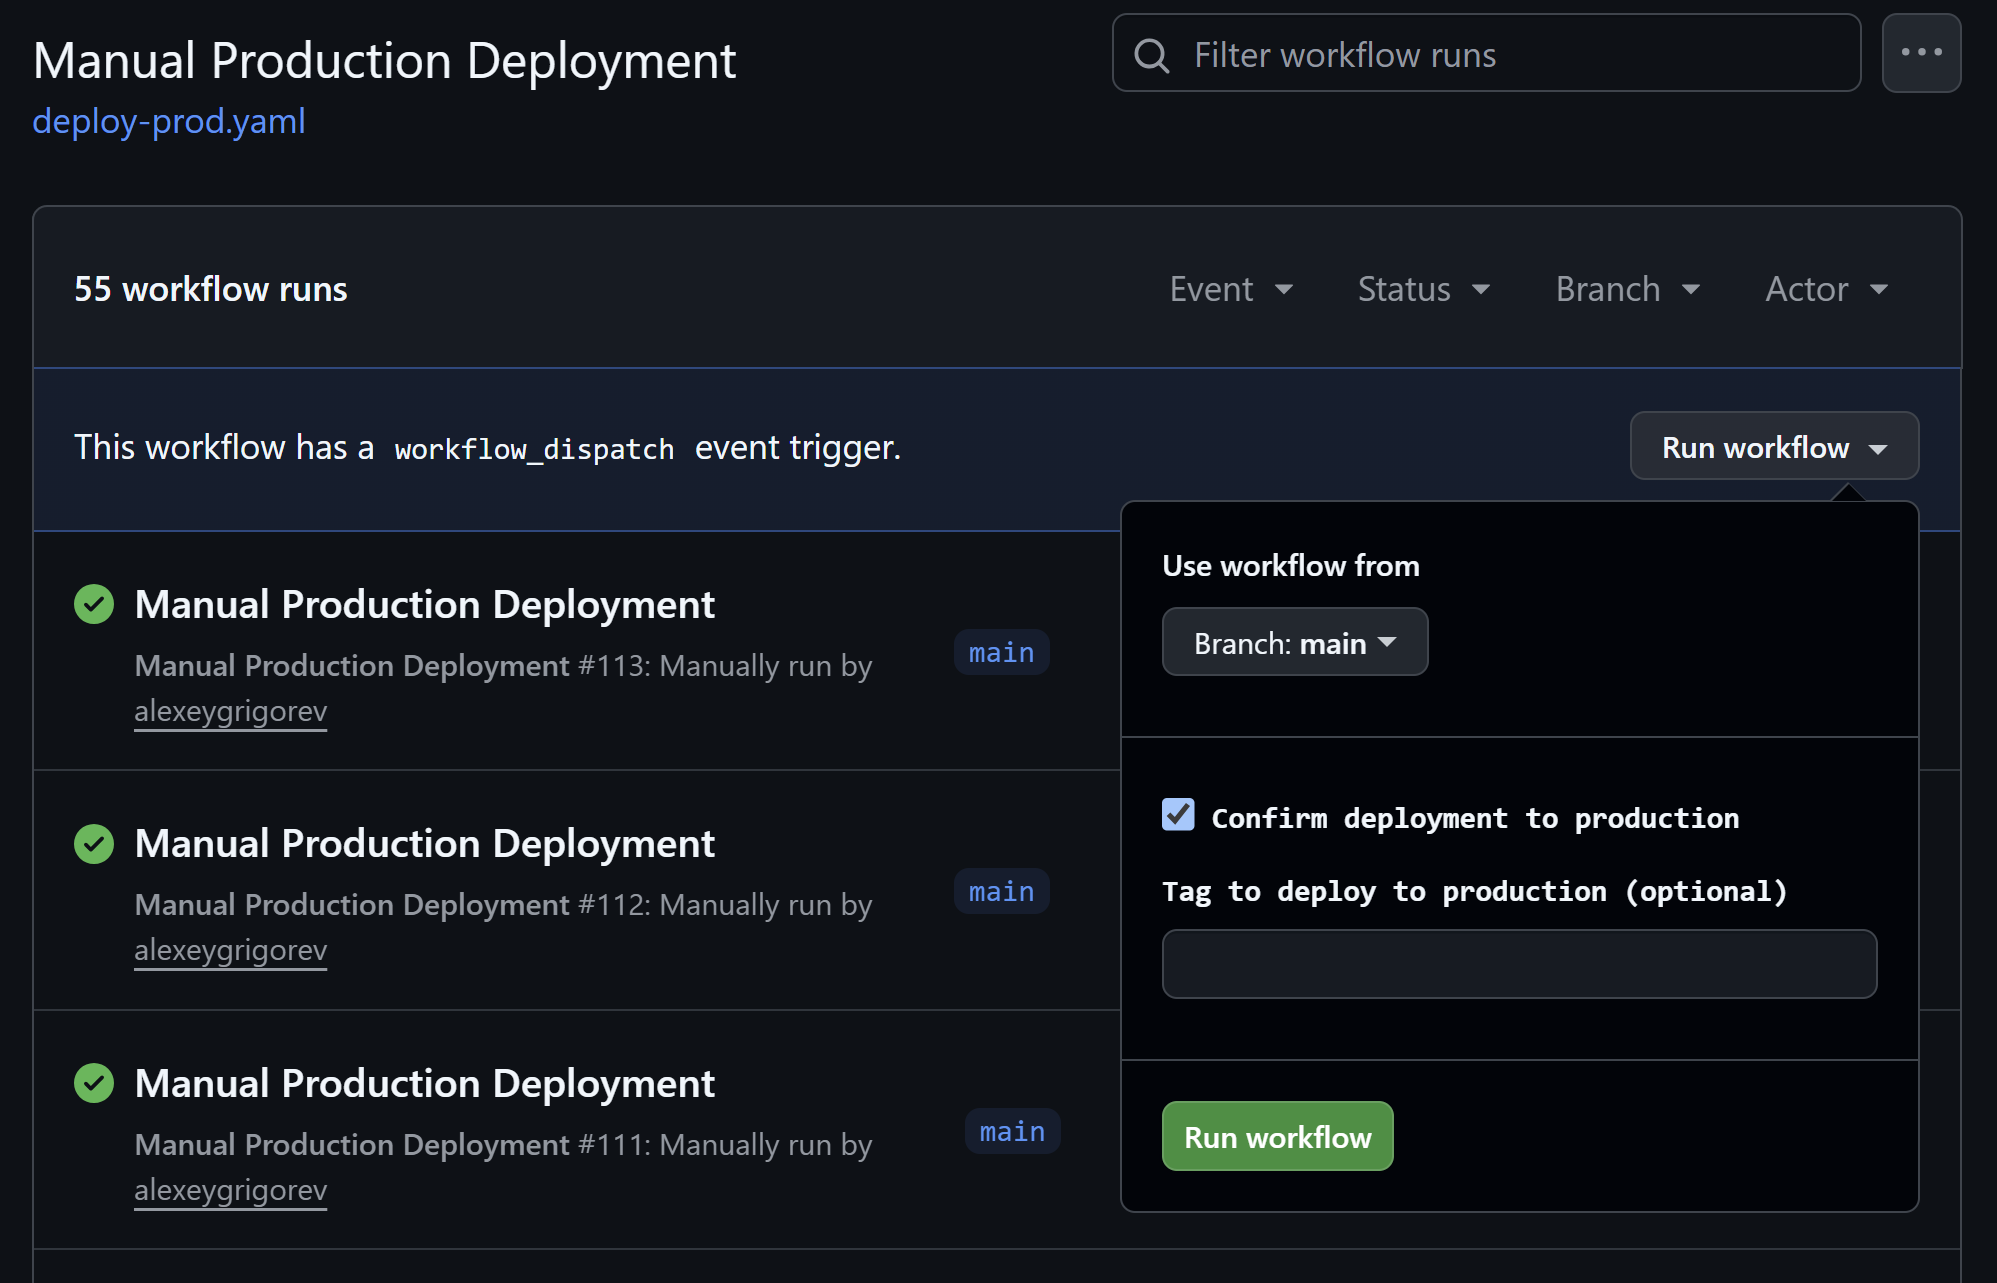
Now we have two environments.
In the pipeline we have so far, the Docker image is built during the deploy stage. I deploy to EC2 by executing the build script on the machine and then running the image in Docker.
It’s an anti-pattern.
There are multiple problems with this approach:
The deploy stage is actually two things: build and deploy. If build fails, there should be no deploy, so it’s better to have these steps separately.
When we promote the dev version to production, we have to build again. During this time, many things could have changed, so the build will not be identical to dev, and it can cause problems.
So we split the deploy step into two separate steps:
Build the image and upload it to a container registry
Pull this image from the registry during the deploy
When promoting to prod, we simply pull the same image to prod.
For AWS, we can use Amazon ECR as the registry. You can also push your images to Docker Hub or another container registry if you’re running outside of AWS and your cloud doesn’t have a special service for that.
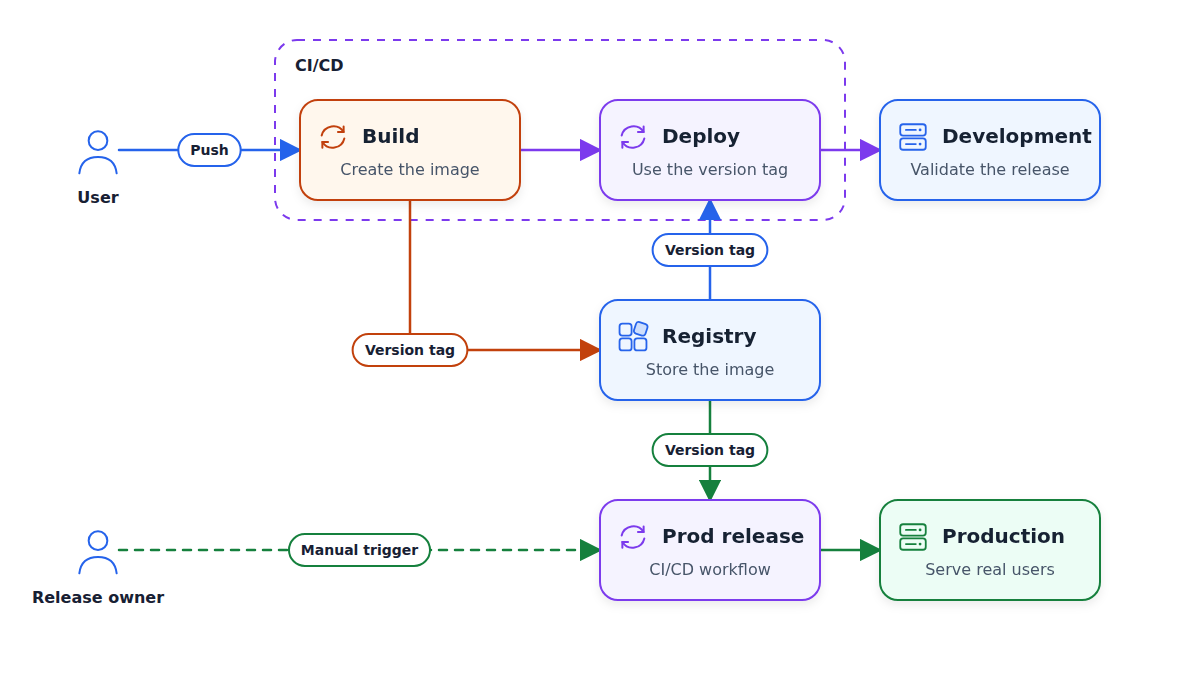
Let’s implement that:
Currently we build the image during the deploy stage.
Split it into two stages:
- Build: build the image and push it to a container registry (ECR)
- Deploy: pull the image from the registry and serve it
The manual prod promotion CI/CD workflow pulls the currently deployed dev image to prod.
Tag each image using the YYYYMMDD-HHMMSS-shortsha pattern (e.g. "20260818-163457-83242da")
Now the build step produces a tagged image, and the deploy step deploys it to dev. We can test the dev application, and when we later promote it to production, we will be certain that it’s exactly the same image.
Having two environments helps us avoid accidentally pushing buggy code to production. But accidents will still happen, and we need to make sure we detect them and react as fast as possible.
For that, we need to have observability. “Observability” means collecting information about the application so we can understand its behavior. With it, when something breaks, we can quickly find the problem.
We achieve observability by adding monitoring to our applications. At the minimum, we need to collect basic performance metrics like CPU and memory utilization and requests per second (RPS).
If we see that CPU and memory utilization are growing and RPS is dropping, something may be off.
This information alone is not enough. It doesn’t explain what happened inside a request and why it’s causing errors or degraded performance. For that, we need to collect more.
OpenTelemetry (often abbreviated as “OTel”) is the industry standard for telemetry.
Telemetry is all the information that the application produces:
Metrics - requests per second, response latency, and number of errors
Logs - timestamped records of individual events, like an error message or a failed database query
Traces - all the steps (called “spans”) that a single request makes through the entire application
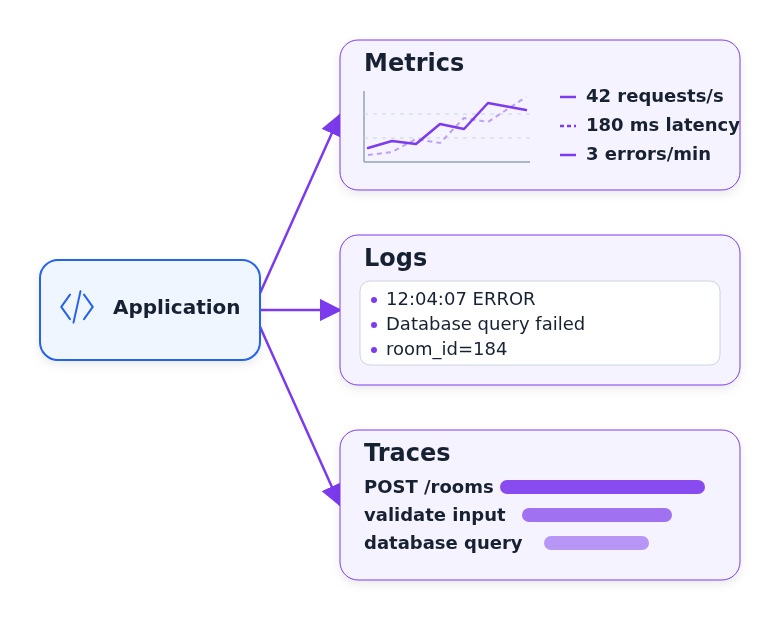
OTLP is the protocol that applications use to send this telemetry.
For many popular libraries, we can start capturing telemetry with just a few lines of code. This process is called “instrumenting” - adding telemetry collection to an application. Auto-instrumentation can instrument libraries like FastAPI without changing their code.
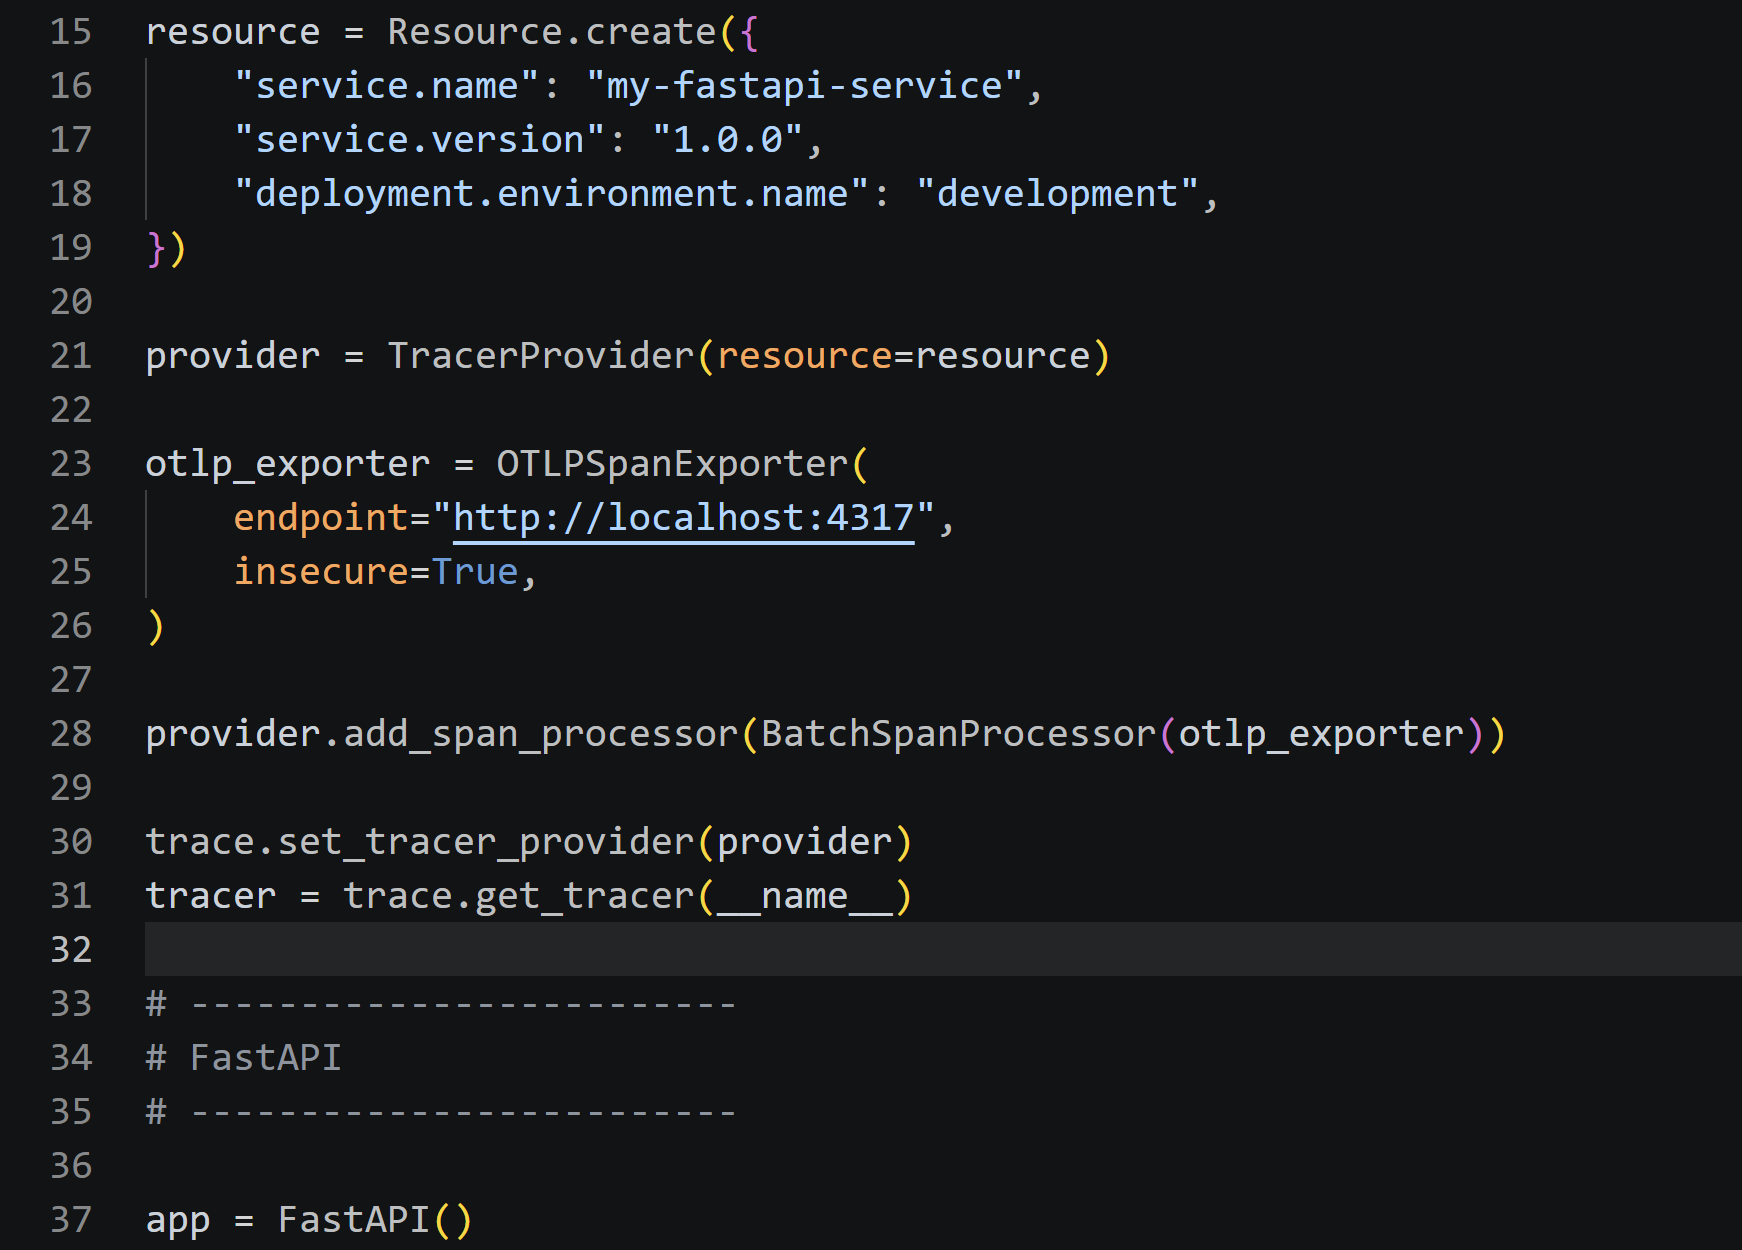
Let’s do it. Ask the coding agent:
Instrument the backend with OpenTelemetry.
Include in the telemetry:
- service name
- environment
- deployed version
The application now produces telemetry and exports it over OTLP. We still need to decide where to send and store it, and how to view it. Let’s do that now.
We export telemetry over OTLP, but it’s not saved anywhere. For that, we define an OpenTelemetry Collector between the application and the storage systems.
There are many services you can use for that. Ask your AI assistant and select the option that works best for your application.
In our case, I’ll use:
Prometheus for metrics
Loki for logs
Tempo for traces
Grafana for dashboards
I had never used Loki or Tempo before, but when I told my coding agent that I wanted to use Prometheus and Grafana, it suggested including Loki and Tempo too.
So let’s implement it:
Add an OpenTelemetry Collector.
Create "observability/" directory with Docker Compose for:
- OpenTelemetry Collector
- Prometheus
- Loki
- Tempo
- Grafana
Keep this as a separate Compose project from the application stack
Now we have the infrastructure for observability, so we’re ready to build a dashboard.
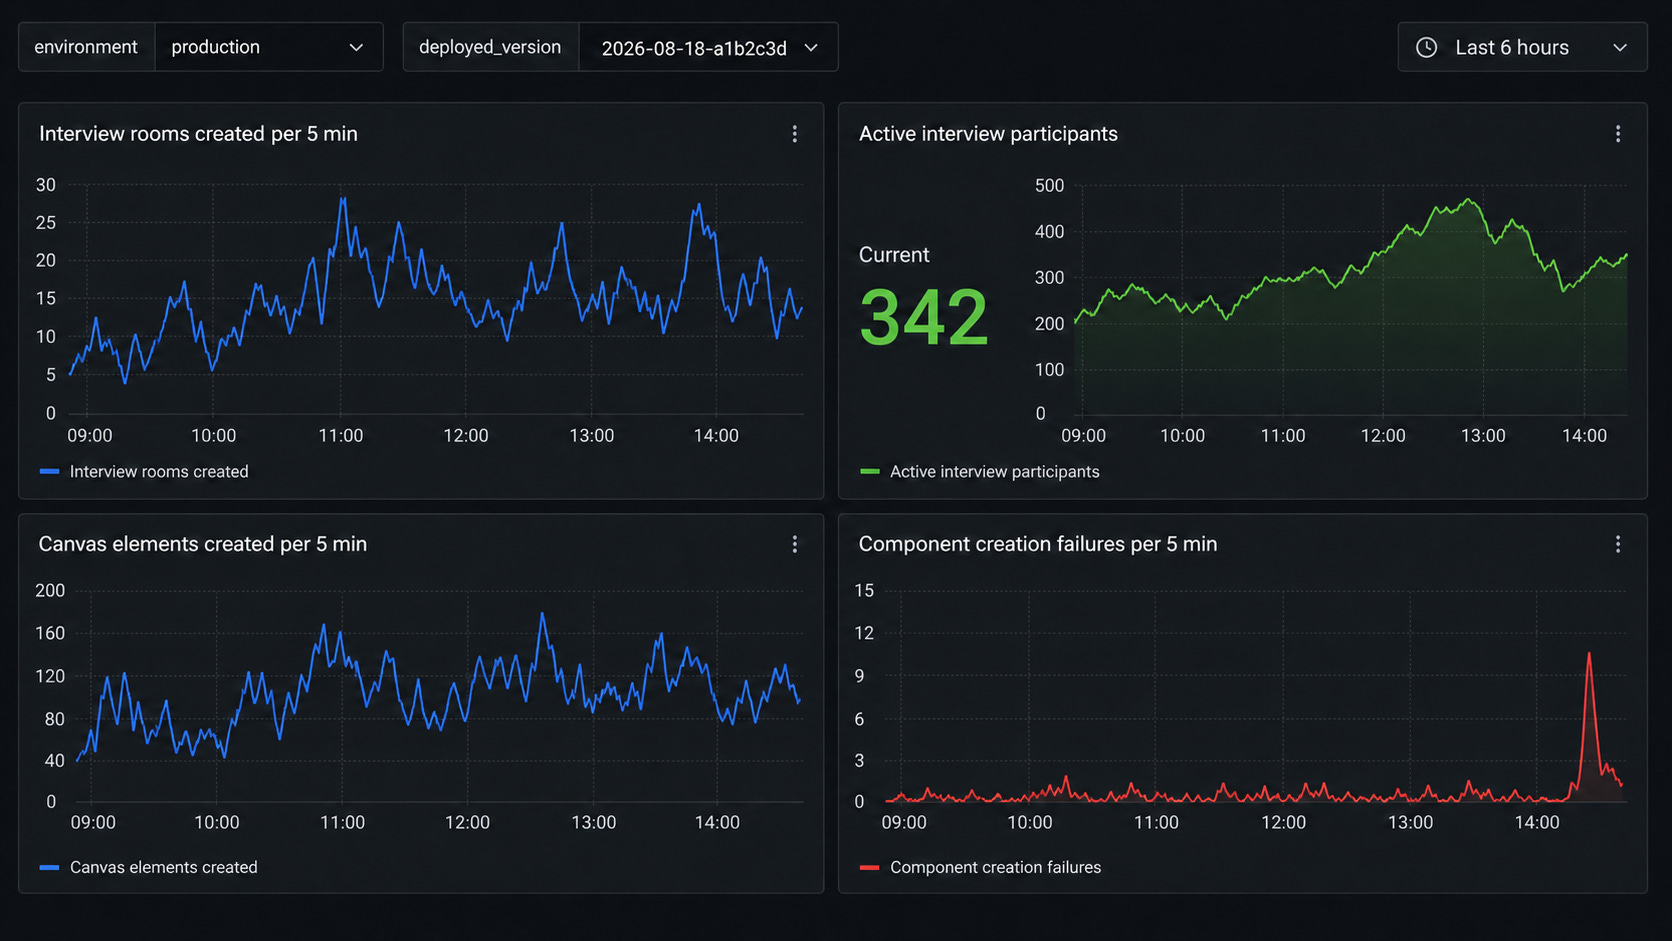
Metrics are numerical measurements collected over time. They can show a current value, such as the number of active participants, or count events during an interval, such as rooms created or errors in the last five minutes.
For System Design Canvas, useful measurements may include:
Total number of interview rooms
Number of active rooms and number of active participants
Number of elements on the canvas across the application
Change propagation delay: when I add an element to the canvas, how long does it take for you to see it
Number of errors
Let’s start collecting some of them:
Track these application metrics:
- interview rooms created
- active interview participants
- canvas elements created
- failures in component creation
Include the environment and deployed version
Now we have the data and can display it in a dashboard:
Add a Grafana panel with these metrics. Make it possible to filter by environment and deployed version.Run it locally and test it by opening our application, creating a room, adding a canvas element, and checking that it appears in Grafana.
If you use the same stack as me (Prometheus, Grafana and others), we need to deploy and manage them ourselves.
If you use a managed OTel-compatible service such as CloudWatch, Grafana Cloud, Datadog, or Sentry, you can skip this step.
So if you’re following my steps, let’s deploy our stack:
Deploy the observability stack. It should be separate from the application stack.
Connect both development and production to it.
After it finishes, you can open Grafana and perform the same test that we did locally.
Note: here we deploy Grafana and the other services openly on the Internet, so everyone can access them. In practice, you put sensitive resources like observability services and databases on private networks, restrict network access, and require authentication so only authorized users can access them.
We have the dashboards, but we can’t watch them all the time to see if some metrics drop or grow too large. If this happens, we need a system that triggers an alert saying that something happened.
Add an actionable alert for repeated canvas component-creation failures.
Use a threshold and duration that represent real user impact. Include the
service, environment, deployed version, owner, and dashboard URL in the alert.
Now that we have alerts, we need to react to them. In companies, there’s usually an on-call engineer. That’s the engineer who receives the alert when something happens. They need to figure out what’s happening and find a quick solution to stop the problem.
When a metric crosses its threshold for long enough, the alert fires and the on-call engineer receives it.
Our AI assistant can be the on-call engineer, and if something happens, it can try to fix it. In real scenarios, AI on-call agents also need to understand if the issue is serious enough to escalate the alert to a human on-call engineer.
In our case, we won’t do it. We will implement a system that checks the observability system for alerts, and if something is happening, an agent session will start and try to fix the problem.
Add an on-call-engineer/ directory with a script that polls the observability
alert API every minute.
When an alert fires, pass the alert details to a headless coding agent.
As a result, we have a worker that polls for alerts and starts an agent session when one fires.
In my case, the agent had this prompt:
You are the on-call engineer for this repository. An alert just fired.
Investigate the root cause. Read the code and reproduce the failure.
If you find a real bug, make the smallest correction, run the backend tests,
and commit the fix with a clear message.
If the alert is a false positive, explain why and do not change the code.
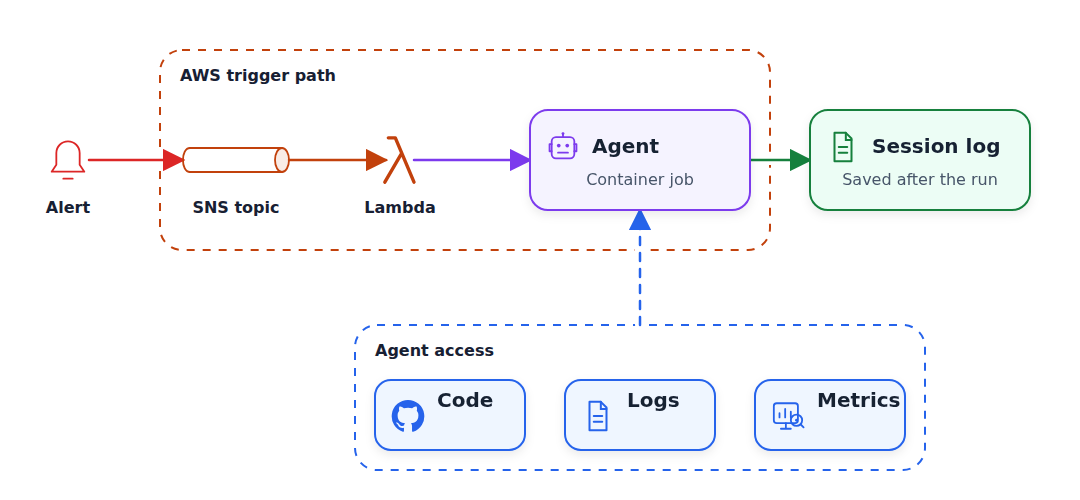
This is a small proof-of-concept script. In reality, you will probably have a system that looks like this:
An alert is triggered and sent via SNS or a similar service.
A Lambda reacts to that alert and starts a container job.
The job launches Codex or Claude in headless mode.
Once the session is over, the logs are saved and the compute is terminated.
Let’s test our idea by introducing a bug.
We want to test that this system works, so let’s start a coding agent and ask it to add a bug or find an existing one.
Introduce a realistic bug in canvas component creation.
For some requests, creating a component should fail even though the existing tests pass. Keep the failure reproducible so we can test that the bug causes an alert and the on-call response.
Here, the goal is to debug the process and make sure our on-call engineer actually wakes up and solves the problem.
After a few iterations, we have an on-call engineer that wakes up when there’s an alert and tries to fix the problem.
After you finish everything for the module, I recommend cleaning up everything. We created these things for learning, so we shouldn’t forget to clean them up. If you don’t, expect a bigger bill at the end of the month.
Ask your agent to clean the infra:
Delete the CloudFormation stacks.Check yourself that everything is indeed gone. You may want to double-check everything in the AWS console or ask another agent to scan the running resources in your account.
We started with an idea, and now our setup is much closer to production. But here I could only briefly touch on the most important concepts.
There are many more things that you should consider for a real production application:
Here I deploy to EC2 by running a shell script on the instance. It’s okay for a proof of concept but very problematic for production. Use a container management system like ECS or an alternative.
Sometimes you will need to roll back a change you promoted to prod. Ask your agent to make it easy to do.
Use a managed database service.
Regularly back up your database. It’s best if your backups live outside of your infrastructure-as-code stack and you have multiple independent copies.
Test that you can actually use these backups.
Put internal services and resources on private subnets inside a VPC, and restrict network access to them.
If your application needs to handle a lot of traffic, learn about scaling and load balancing. Container management systems make this easier to manage.
Ask Fable or GPT-5.6-Sol Max (better both) to audit your code for security vulnerabilities. Do it multiple times.
With this article, we finish developing our end-to-end application. We took it from a raw idea and turned it into a system that’s much closer to production.
In the last article, we will look into coding agent capabilities:
MCP
skills
commands
plugins
specialized agents
You can find the course materials and the next cohort in AI Dev Tools Zoomcamp. It’s free.
Comments
Nothing yet. Say the first thing.
Sign in to join the conversation.