
Summer kicks into high gear in June across the Arctic with (near) continuous daylight and the rapid loss of snow and ice cover.
Sea ice
Arctic sea ice extent decreased about 18 percent during June (Fig. 1) and at the end of month was very low but not quite at the record low level of June 2024. There remains a significant split between the Atlantic and Pacific sectors in ice extent relative to the long term average. On the Atlantic side. the Barents Sea ice extent is the lowest of record while Baffin Bay (between Greenland and northeast Canada) was second lowest and the Greenland Sea (between Greenland and Svalbard and Iceland) was the third lowest. In contrast, sea ice melt has barely started in the Beaufort Sea (north of Alaska and northwest Canada) or in the Chukchi Sea north of 70°N.
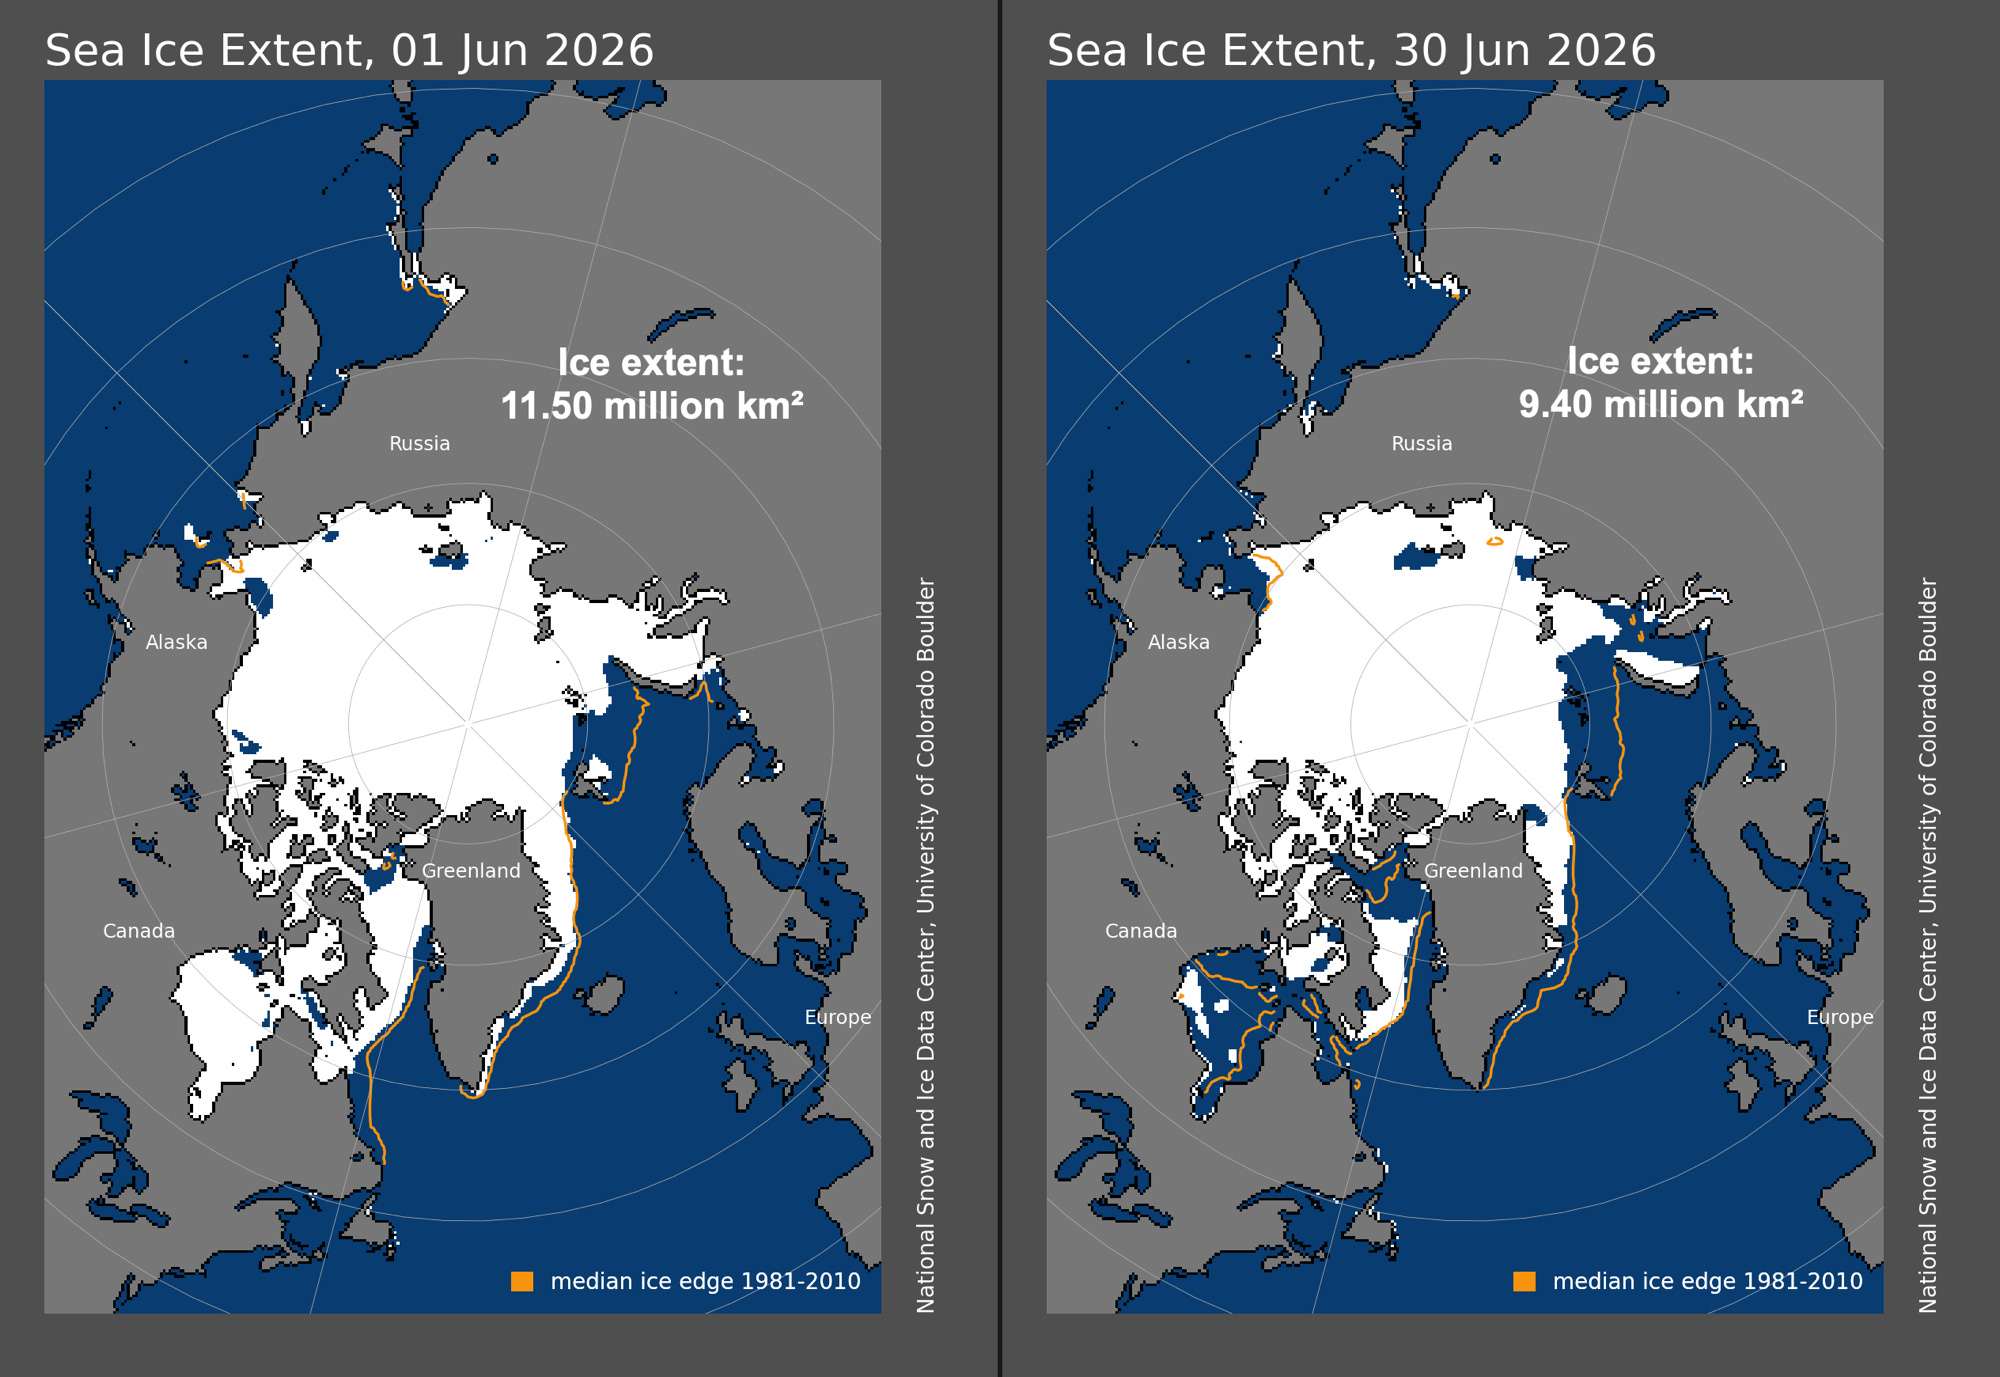
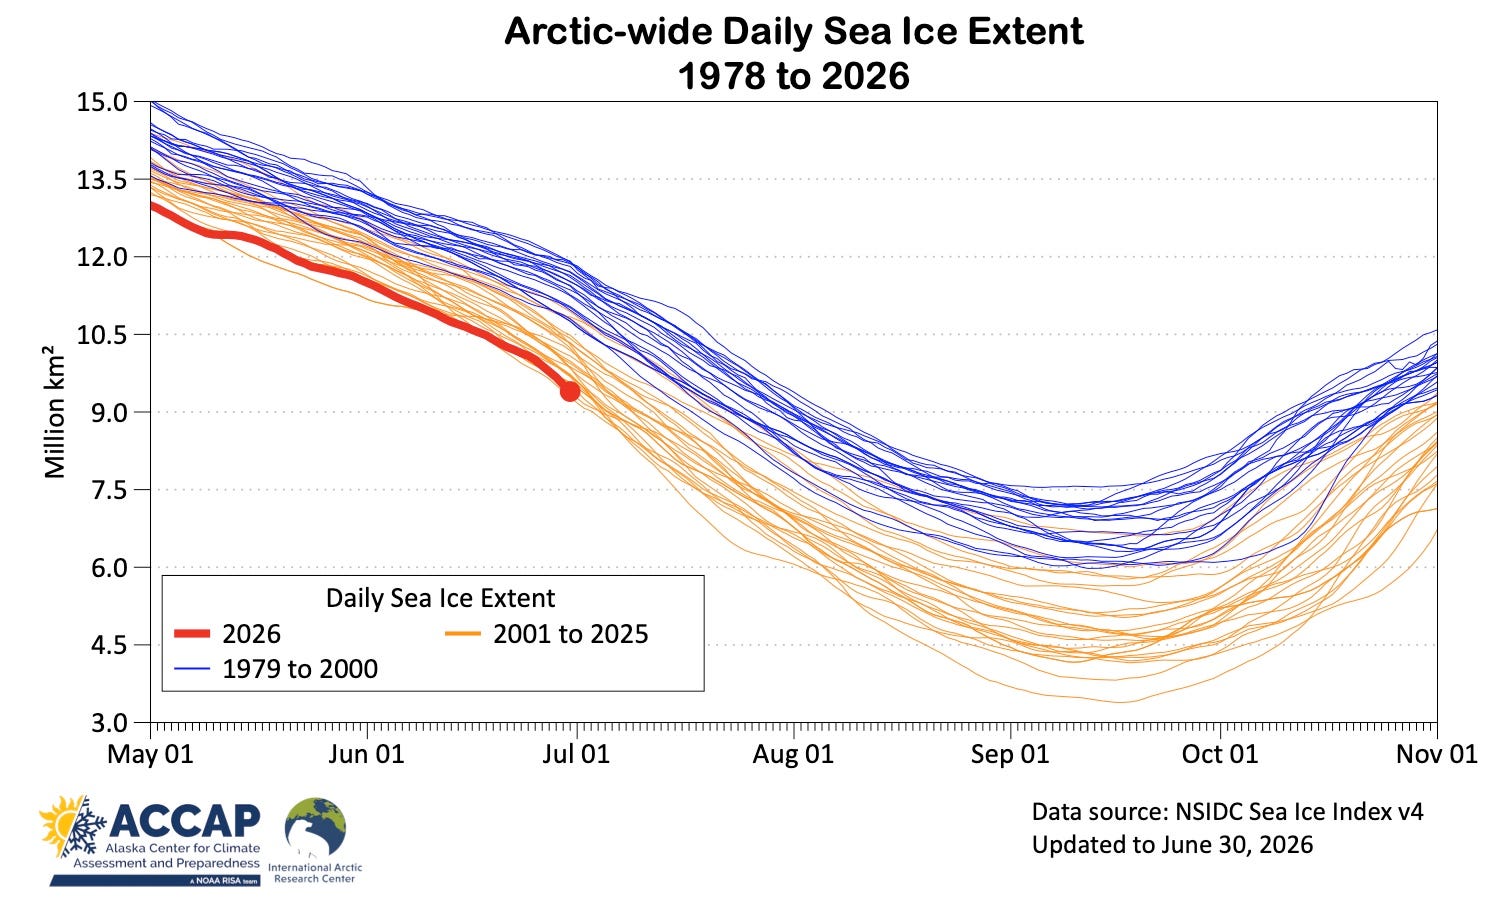
There was some spread in the June 30th sea ice extent ranking (since 1979) between the various analyses. The Japanese Aerospace Exploration Agency (JAXA) analysis was second lowest, National Snow and Ice Data Center (NSIDC) Sea Ice Index v4 was third lowest and the EUMETSAT OSI SAF analysis at fourth lowest. The U.S. National Ice Center/NSIDC Multisensor Analyzed Sea Ice Extent (MASIE) analysis was a bit of an outlier at seventh lowest. The daily extent from the NSIDC Sea Ice Index v4 (Fig. 2) shows the ice extent has been close to lowest all month.
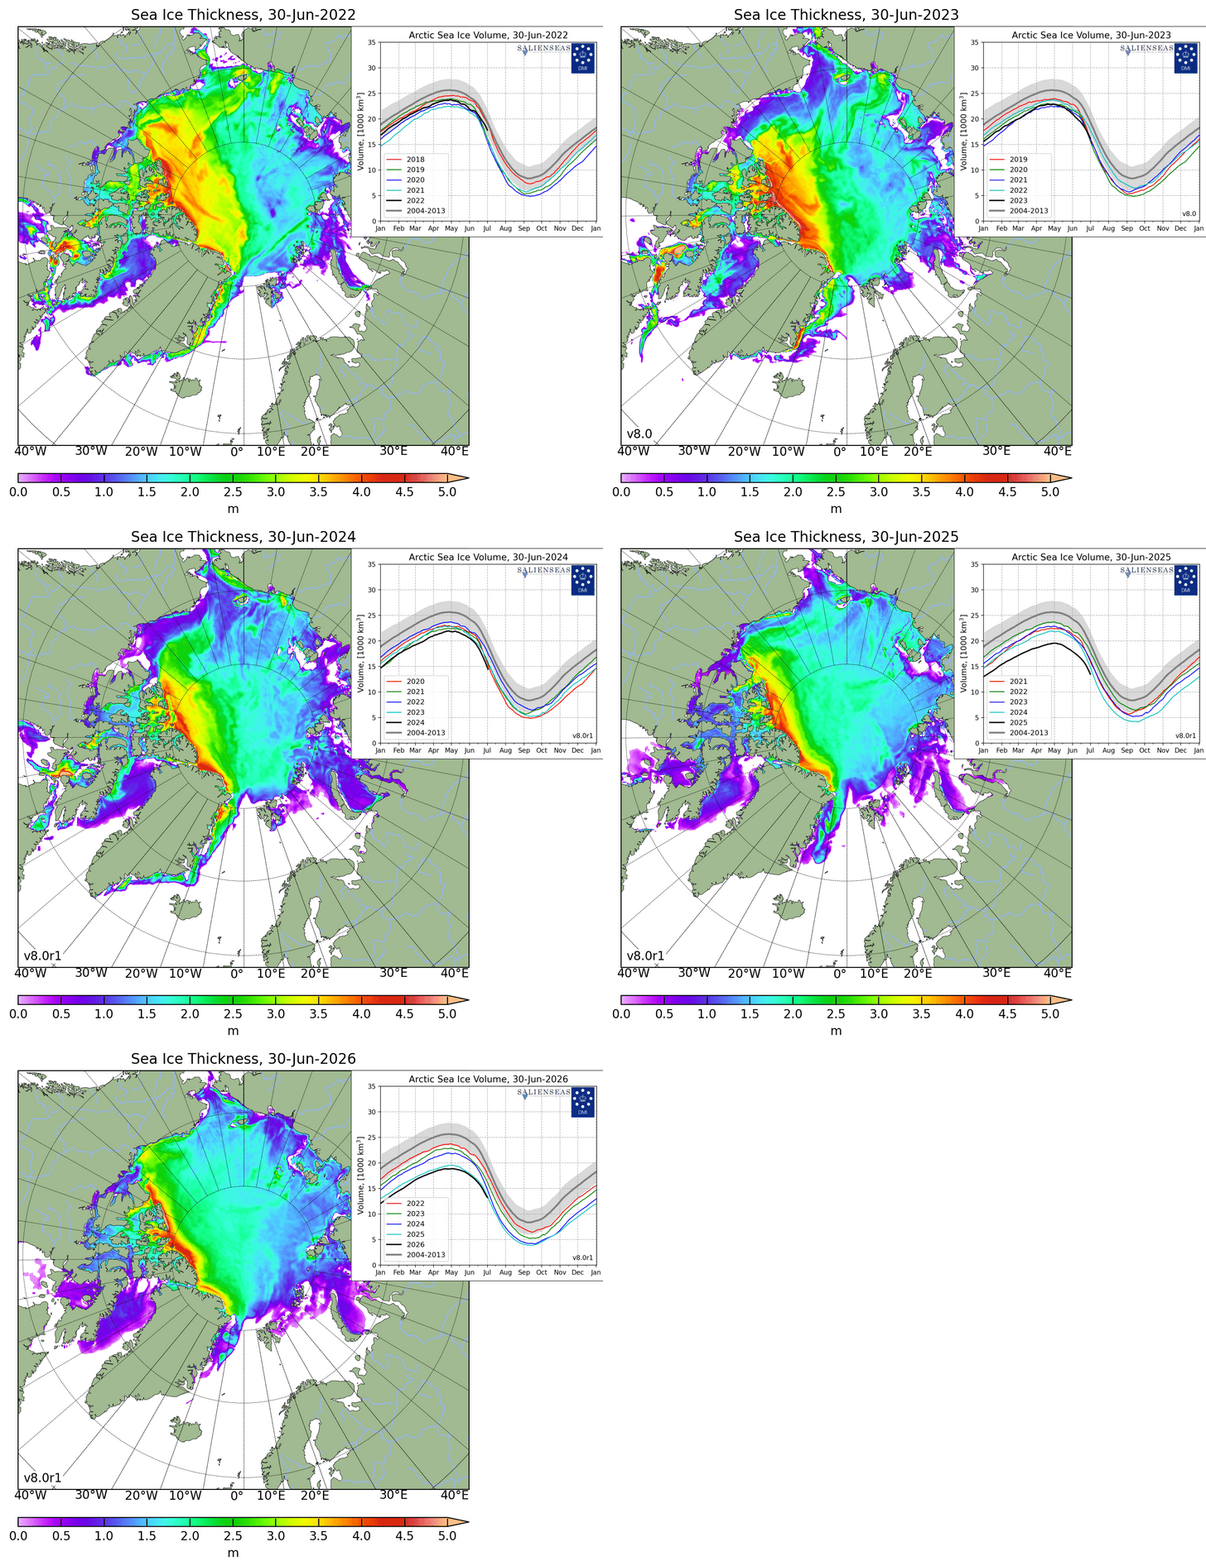
Sea ice thickness and total volume remain very low. I found this animation (Fig. 3) of the Danish Meteorological Institute’s modeled sea ice thickness for June 30th for the past five years (2022-2026) quite interesting. Two things stand out to to my eye: first, the contraction of the thickest ice to right near the northern Canadian Arctic Islands. That’s obvious just from the color scale. But also notice the general decrease in moderately thick ice north of the Russian coast but an increase in thicker ice near the northern Alaska and northwest Canadian coasts.
Snow cover
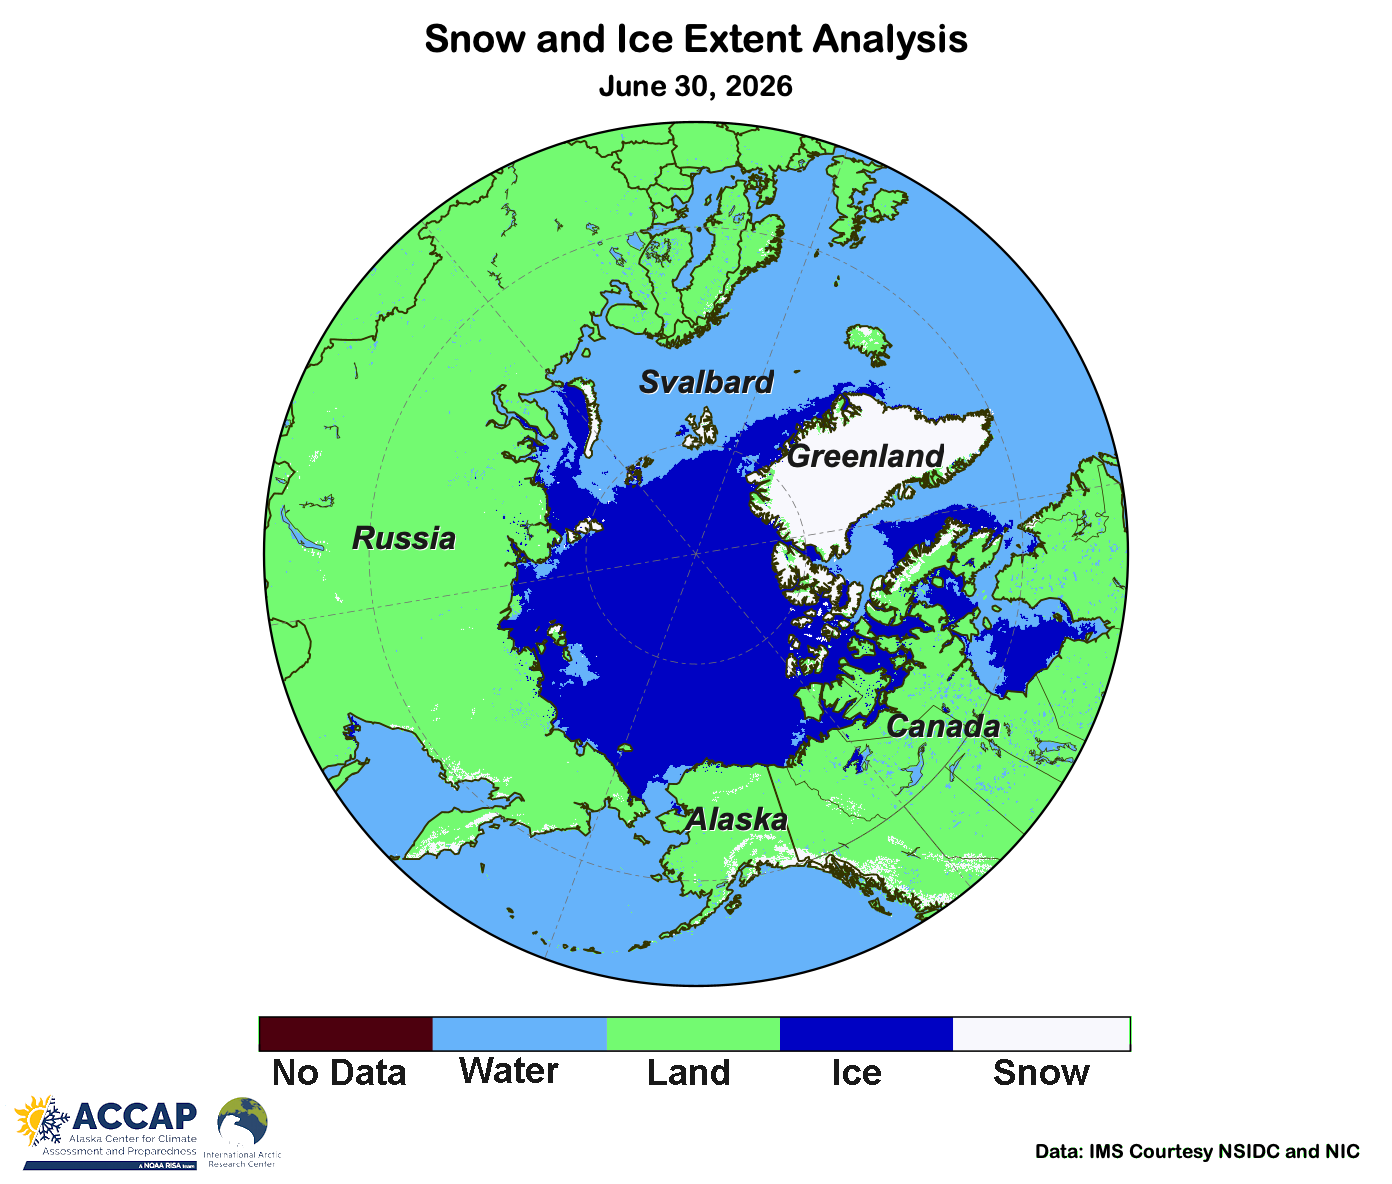
Low elevation snow pack in the Arctic was largely melted away by the end of June except for the northern Canadian Arctic Archipelago, parts of Svalbard and some high latitude offshore islands (Fig. 4). As of June 30, excluding the Greenland Ice Sheet, snow covered 1.33 million km² of the Arctic, the lowest end-of-June snow extent since 2019.
Arctic wildfire
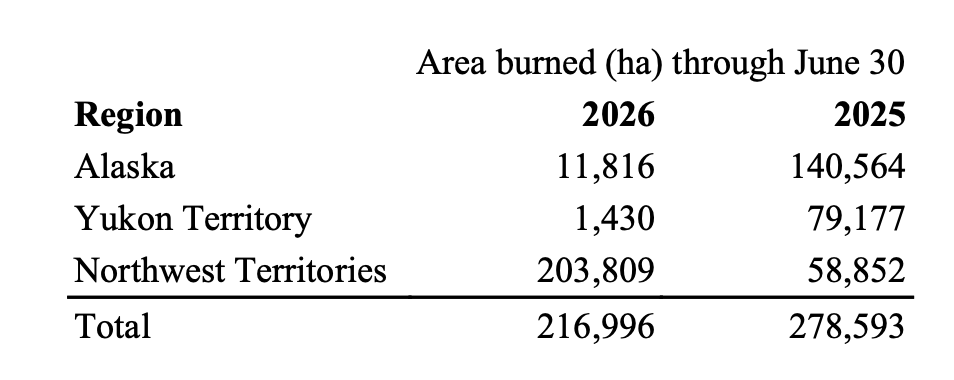
Wildfire actively was fairly low in northern North America through the third week of June. After Solstice, wildfire activity increased dramatically in the Northwest Territories, Canada due to dry fuels and very warm temperatures, even as Alaska and the Yukon Territory continue with a much below normal season in terms of area burned. Table 1 shows the June 30th area burned for the past two years.
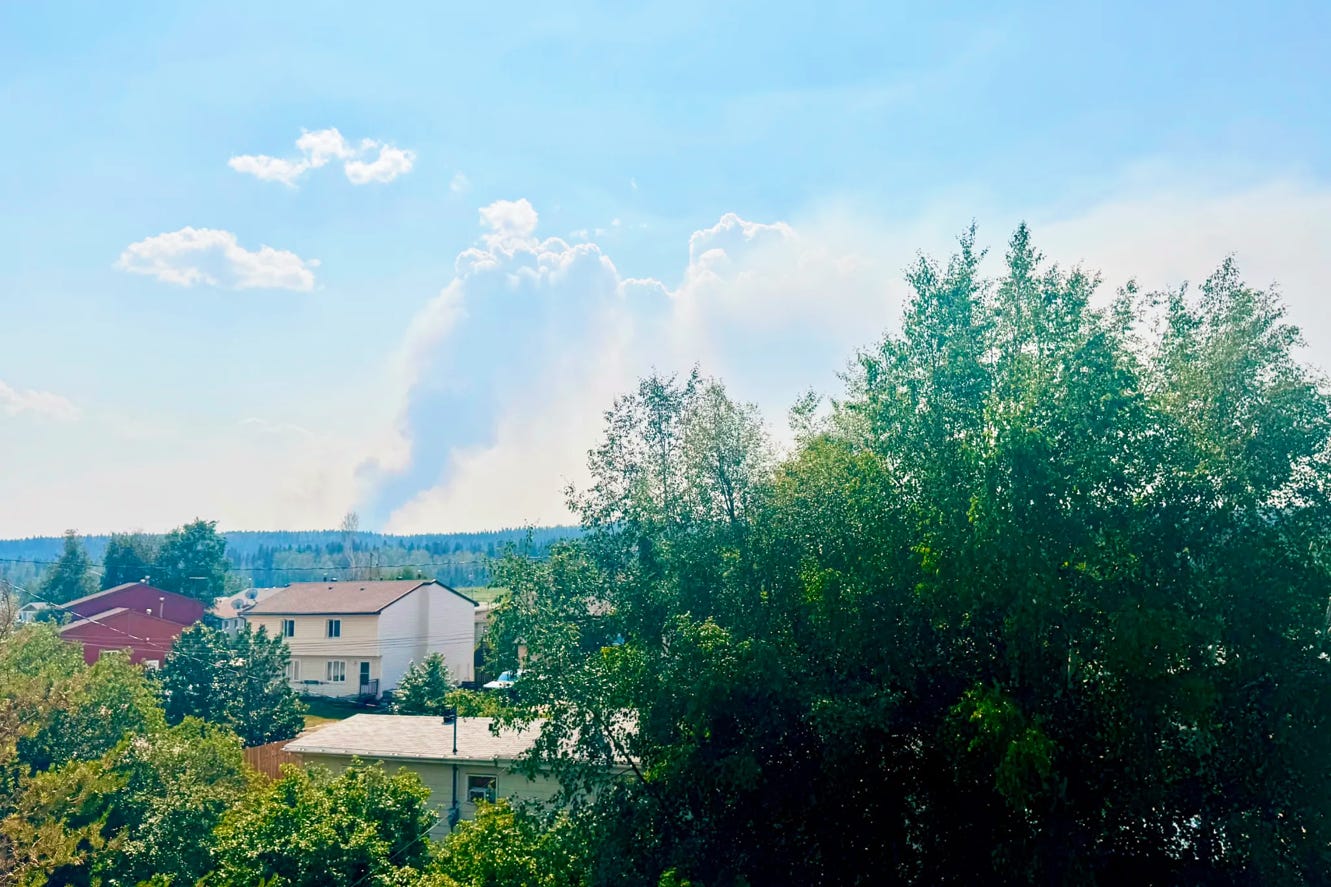
Fort Simpson, along the Mackenzie River in the Dehcho region in the southwest NWT, was threatened by a 14,000 ha (35,000 acre) wildfire only a few kilometers from town the last week of June (Fig. 5).
It’s basically not possible to get comprehensive near-real time quantitative estimates of wildfire area burned in the Russian Arctic, but based on satellite-based detections and available news reports, there’s been substantial wildfire activity so far this summer in western Siberia, well northwest of Lake Baikal, in the vast Krasnoyarsk Krai and Yamalo-Nenets Autonomous Okrug. There appears to have been some but not a lot of wildfire the Sakha Republic of central and eastern Siberia.
Alaska wildfire
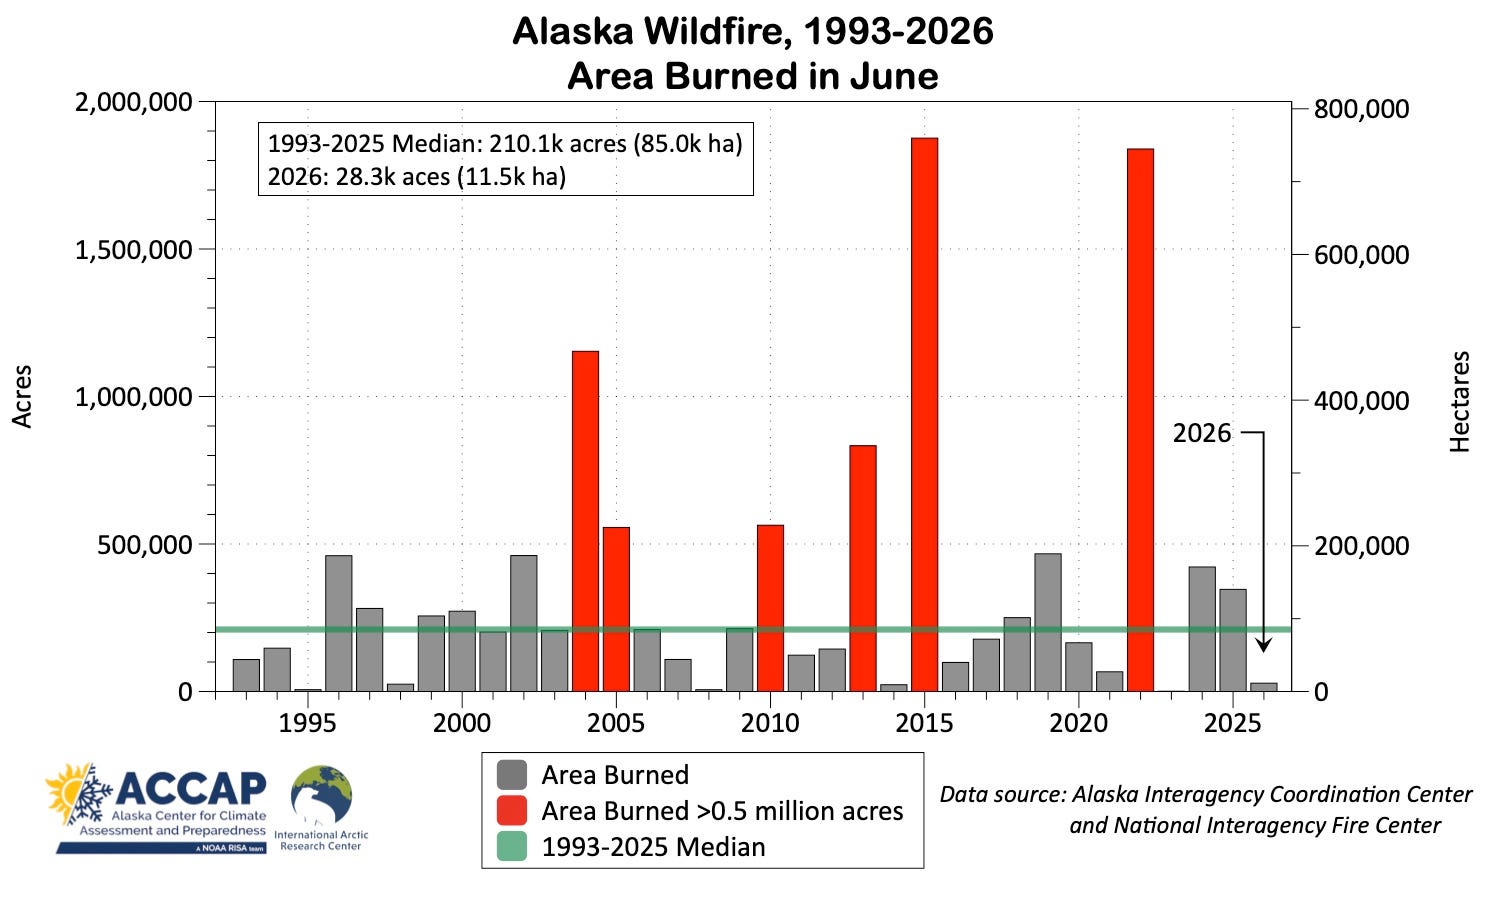
In Alaska, total area burned in wildfire during June was less than 29,000 acres (12,000 ha). This is the sixth lowest June total since 1993 (Fig 6).
Although the total burned area was low, the June 20 lightning-started Starry wildfire, on the edge of Anderson (southern Interior), prompted evacuation notices from Denali Borough officials but quick action by firefighters prevented the fire from spreading into the city.
Unlike 2023, when very low thunderstorm activity played a role in the lack of fires, this June there were about 75,000 lightning strikes in and around Alaska (about 61,000 were ground strokes in Alaska), which is the fourth highest June total since 2012, when the current lightning detection system came online (Fig 7).
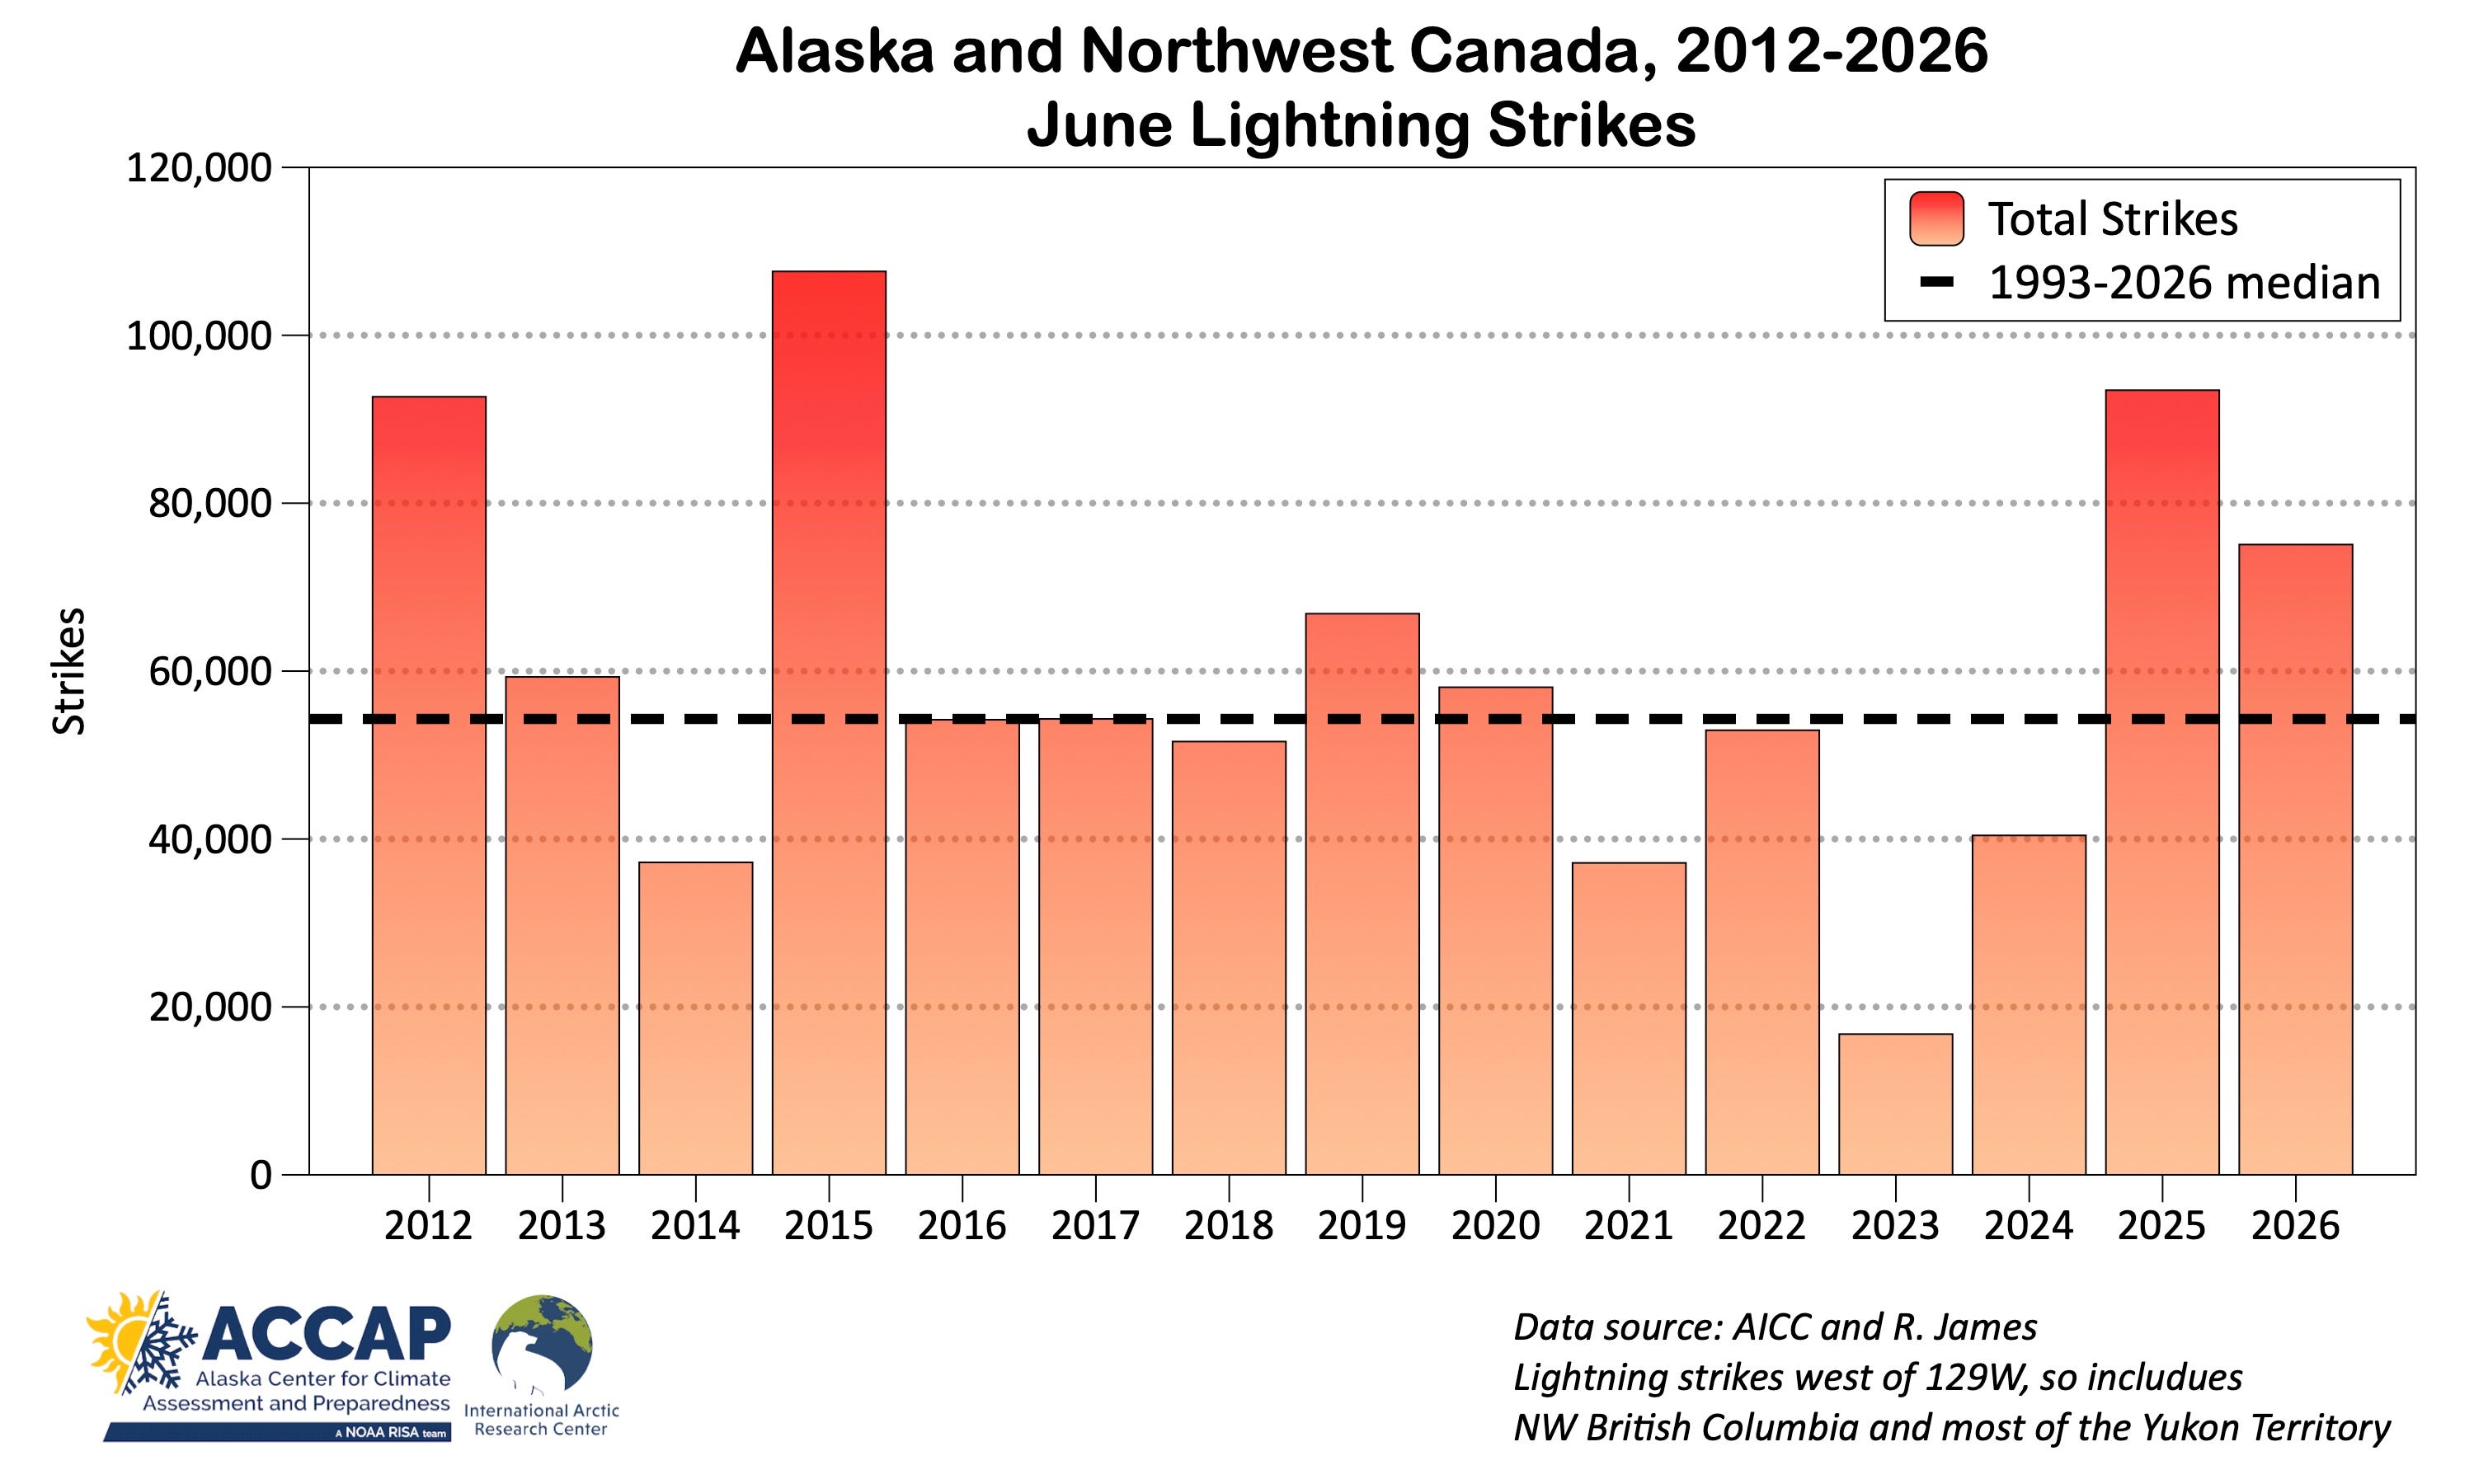
All that lightning started more than 100 wildfires, but the fires were unable to grow rapidly due to rain that accompanied the thunderstorms and, more importantly, a real lack of any sustained hot and dry weather that would rapidly dry the fuels in the boreal forest. June 2012 was somewhat similar in that there was plenty of lightning but well below median area burned.
Technical Details
As usual in this newsletter, Arctic means “poleward of 60°N” unless otherwise specified except for sea ice, where “Arctic” means all northern hemisphere sea ice.
NSIDC Arctic Sea Ice information, graphics and data available here.
Products from the OSI SAF High Latitude Processing Center (including but not limited to sea ice) are available here.
Arctic-wide sea ice extent data is available from JAXA here.
MASIE information and data available from NSIDC here.
Modeled sea ice thickness and volume from the Danish Meteorological Institute is available here.
IMS Snow and ice analysis products are available through the landing page here. There is no information in this product about the depth or water content of the snowpack or sea ice thickness or type.
The Alaska Interagency Coordination Center is the first stop for all things wildfire-related in Alaska, homepage here.
Up-to-date wildfire information for the Yukon Territory here, and for the Northwest Territories here.
Thanks for reading Alaska and Arctic Climate Newsletter! Subscribe for free to receive new posts and support my work.
Comments
Nothing yet. Say the first thing.
Sign in to join the conversation.