
Sea ice continues to melt in the Arctic, with the annual minimum about about four weeks out. The first half of August has seen dramatic changes in ice extent on the Pacific side of the Arctic (Fig 1 left). We are at the time of year when there often a significant difference in sea ice estimates between passive microwave estimates of ice concentration and those using the multi-sensor approach (Fig 1 right). The main differences as of August 16 were in the Chukchi and Beaufort Seas, where passive microwave analysis show that a large area of open water has developed north and northwest of Alaska, while the U.S. National Ice Center/NSIDC Multisensor Analyzed Sea Ice Extent (MASIE) shows ice remaining in most of this area.
These disparities are mostly the result of differences in estimates of dispersed, low concentration ice. Another, confound, usually smaller in scale, is the well known problem of passive microwave sensors detecting melt water on top of sea ice and this being classified as “no ice”. Because sea ice extent is binary, less than 15 percent is open water, any thing over 15 percent counts as ice covered, small but systematic differences near this threshold can result in substantial difference in ice extent areas estimates during the summer. Typically during late August and early September the differences between these two types of data decrease as ice melt proceeds south of 80°N and, at the highest latitudes, refreezing begins in early September.
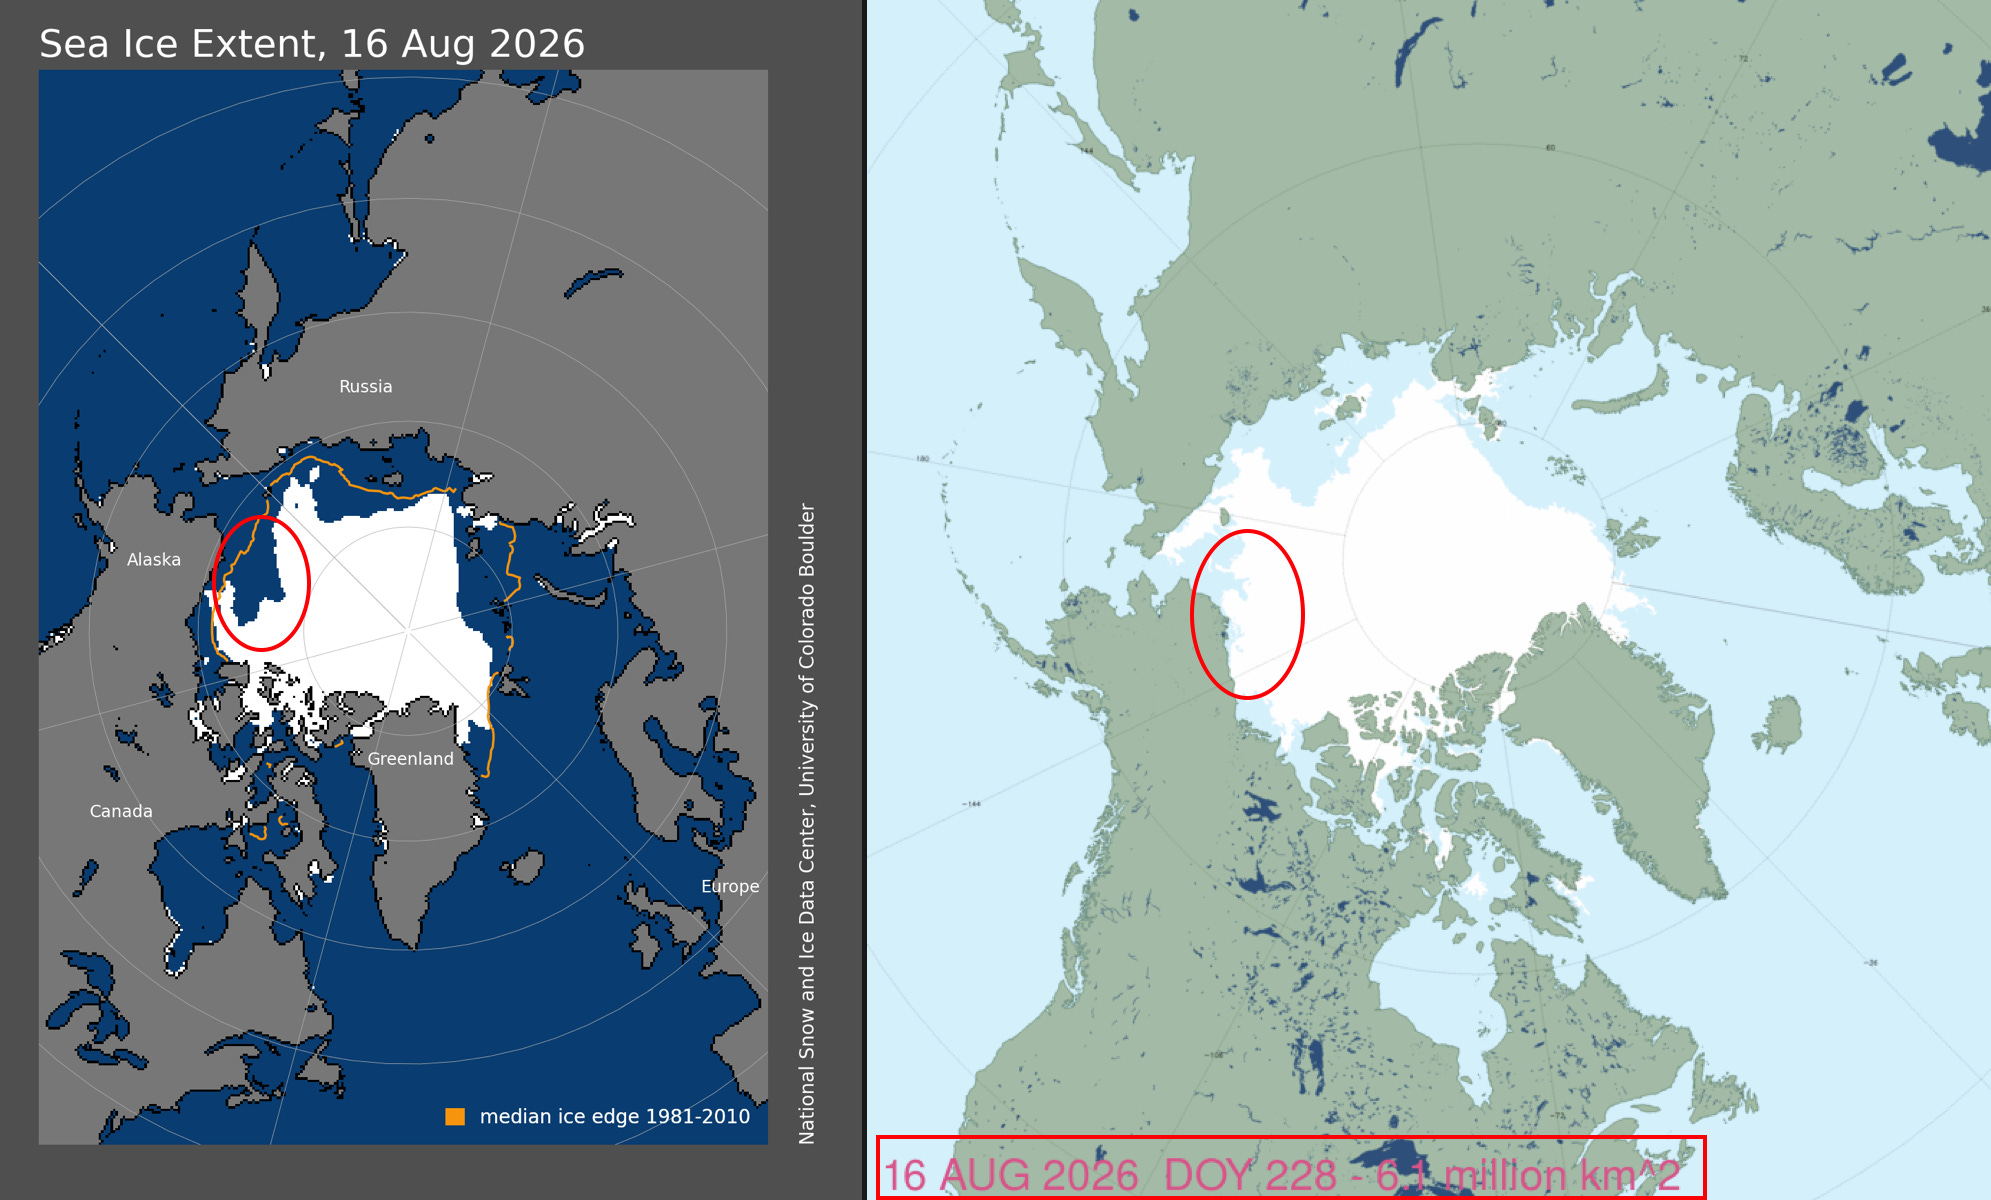
These differences are reflected in the August 16 rankings (since 1979) of Arctic-wide sea ice extent:
8th lowest Japanese Aerospace Exploration Agency (JAXA)
9th lowest National Snow and Ice Data Center (NSIDC) Sea Ice Index
12th lowest EUMETSAT OSI SAF Sea Ice Index
but
16th lowest in the U.S. National Ice Center/NSIDC Multisensor Analyzed Sea Ice Extent (MASIE) analysis.
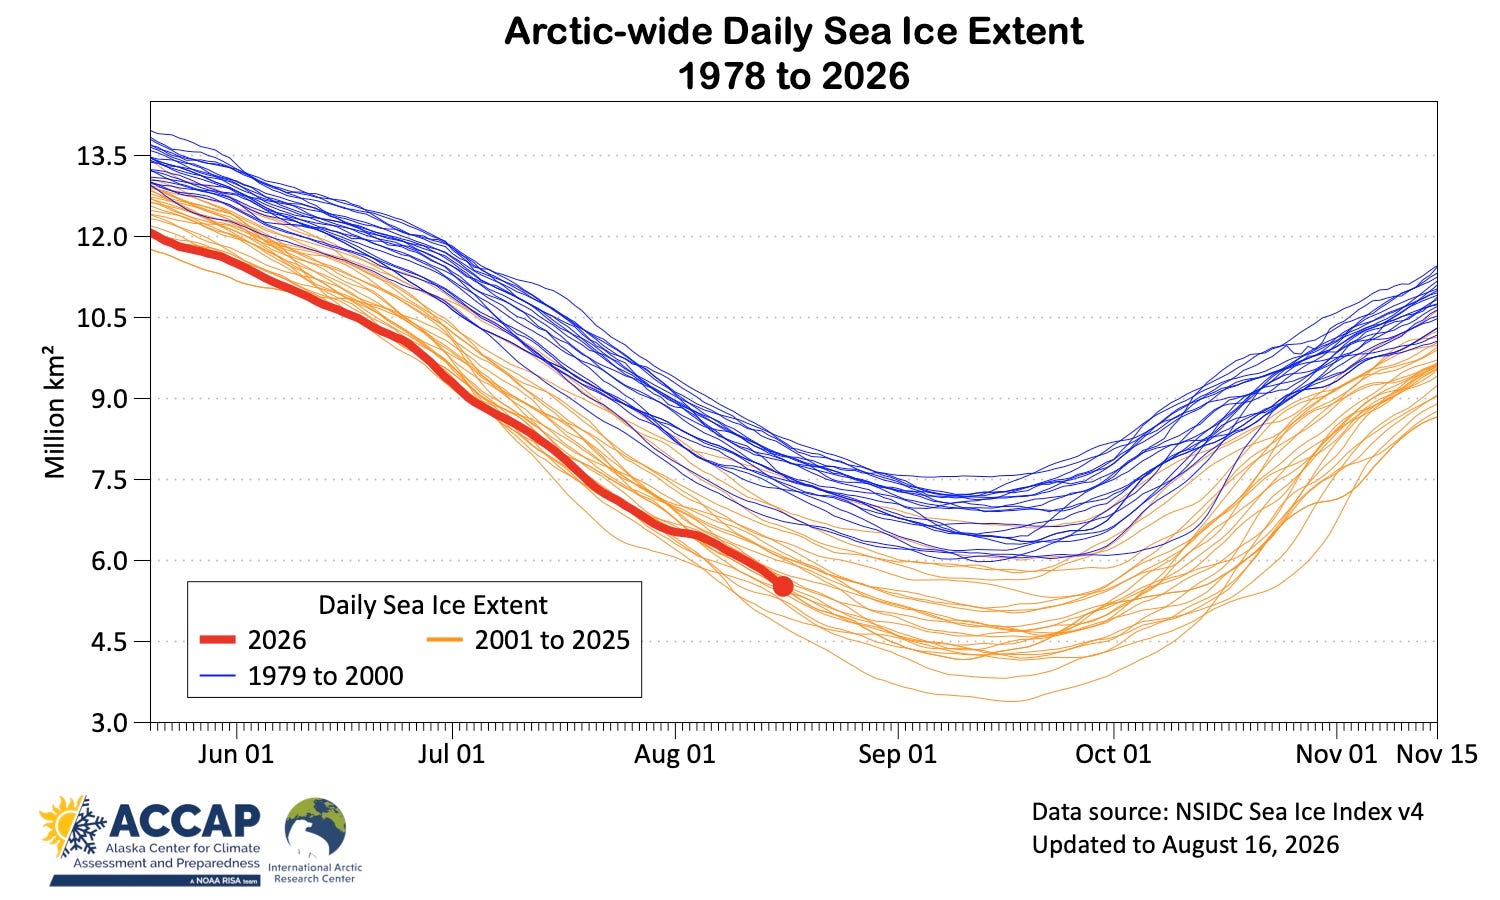
The daily trajectory of sea ice extent decrease this summer (Fig. 2) is similar to recent years except for dramatic slow-down from the end of July into early August. While this sometimes happens regionally at this time of year, it’s more unusual, though no unprecedented, for the Arctic-wide extent decline to show such a pause.
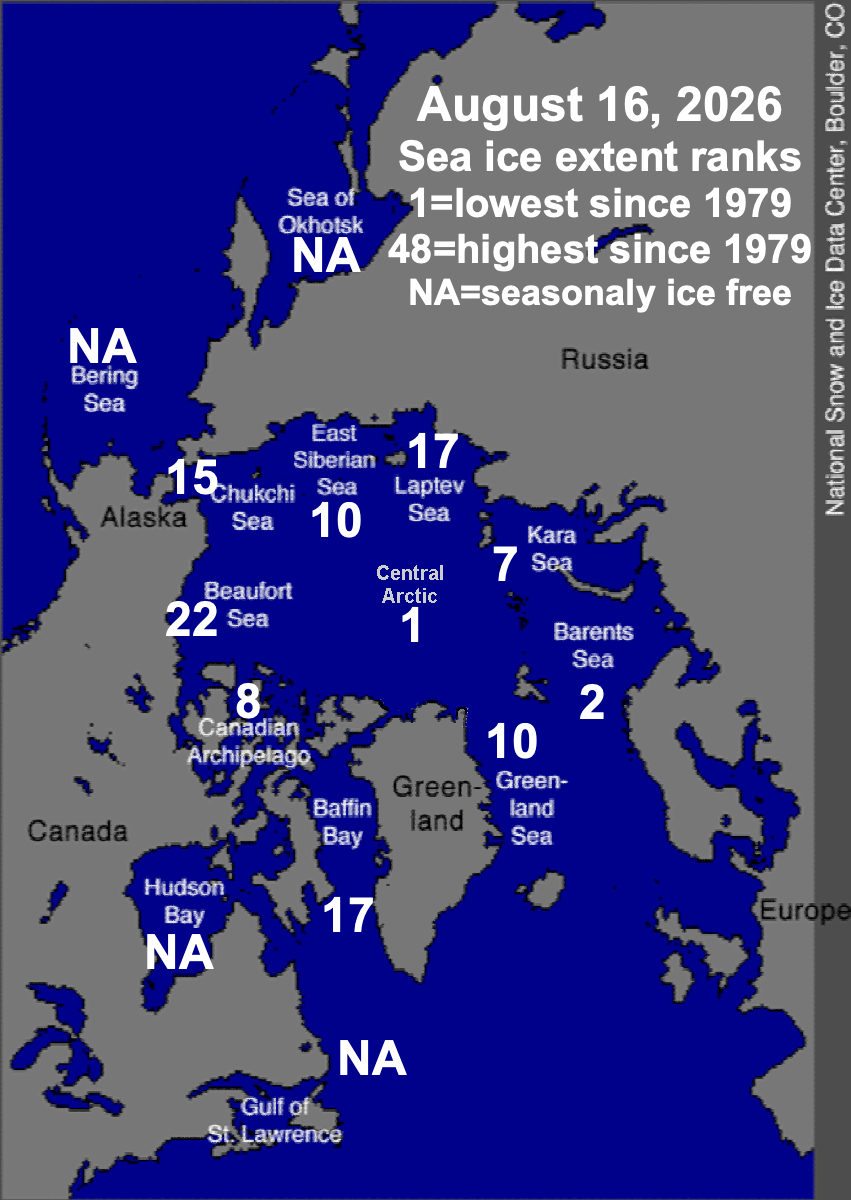
From the passive microwave perspective, sea ice extent rankings have changed dramatically since late July in the Chukchi ad Beaufort Seas, from very high to well below the 48 year median. On the other hand, increased ice drift southward through Fram Strait, between Greenland and Svalbard, has move the Greenland Sea ice extent rank from lowest to tenth lowest, and rankings are also higher now in Baffin Bay and the Canadian Archipelago.
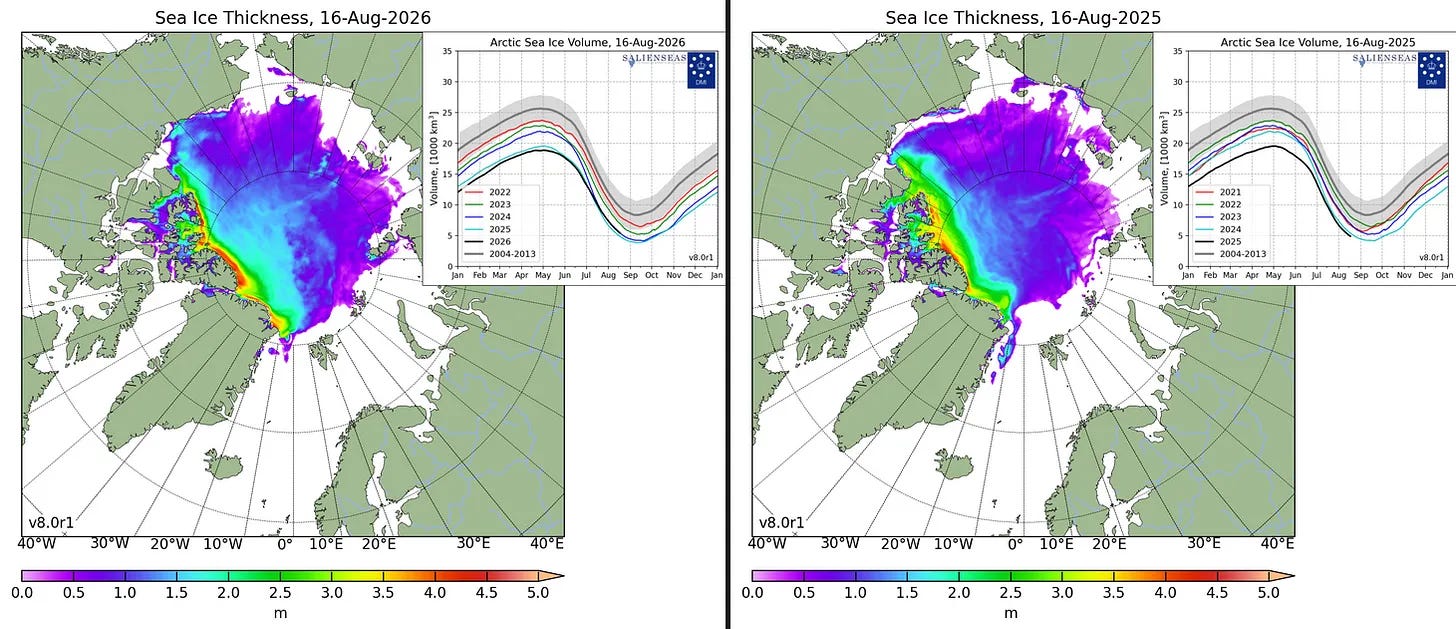
Modeled sea ice thickness and volume from the Danish Meteorological Institute show noteworthy difference between mid-August this year and the same time last year. Just glancing at Fig. 4, it’s clear that thicker ice extends farther north from northern Canada this year (left) than last year (right). Additionally, thicker multi-year ice in the southern Beaufort Sea is closer to the mainland North American coast than last year. Total ice volume (the little inserts), which earlier this year had been at or near the lowest on record, is now appreciably higher than last year and effective tied with 2024 for second lowest.
Technical details and underlying data sources
As usual in this newsletter, Arctic means “poleward of 60°N” unless otherwise specified except for sea ice, where “Arctic” means all northern hemisphere sea ice.
NSIDC Arctic Sea Ice information, graphics and data available here.
Products from the OSI SAF High Latitude Processing Center (including but not limited to sea ice) are available here.
Arctic-wide sea ice extent data is available from JAXA here.
MASIE information and data available from NSIDC here.
Modeled sea ice thickness and volume from the Danish Meteorological Institute is available here.
No posts
Comments
Nothing yet. Say the first thing.
Sign in to join the conversation.