
Summer solstice is nearly here, and with it the Arctic accelerates into summer. With solar heating at the annual maximum, here’s an update on the status of sea ice and high latitude snow pack melt.
Sea Ice
Arctic-wide sea ice extent as of June 15 was fourth lowest since 1979 in the Japanese Aerospace Exploration Agency (JAXA) analysis and sixth lowest in EUMETSAT OSI SAF and U.S. National Ice Center/NSIDC Multisensor Analyzed Sea Ice Extent (MASIE). The National Snow and Ice Data Center’s Sea Ice Index was a bit of an outlier among the analyses with having the lowest sea ice extent for the date.
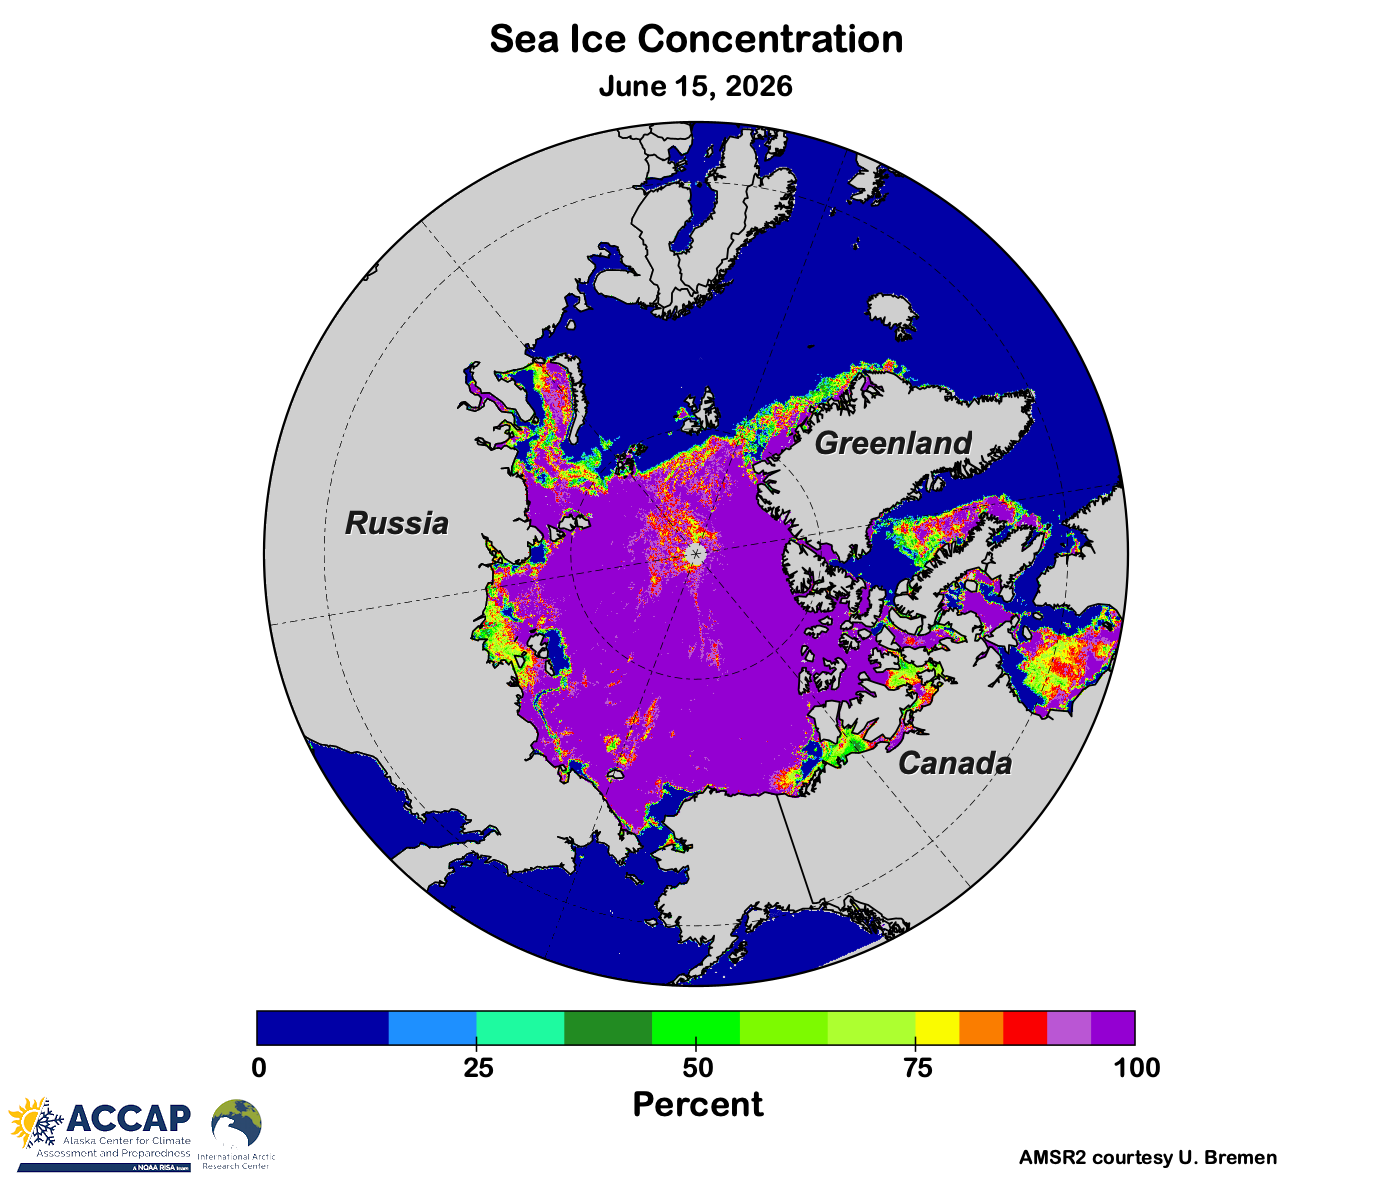
Sea ice melt-out is largely complete in the Bering Sea and Sea of Okhotsk (Fig. 1). Ice melt has been slower than usual in the Chukchi and Beaufort Seas. On the Atlantic side of the North Pole, there is little sea ice remaining around Svalbard while ice melt is well underway in Hudson Bay.
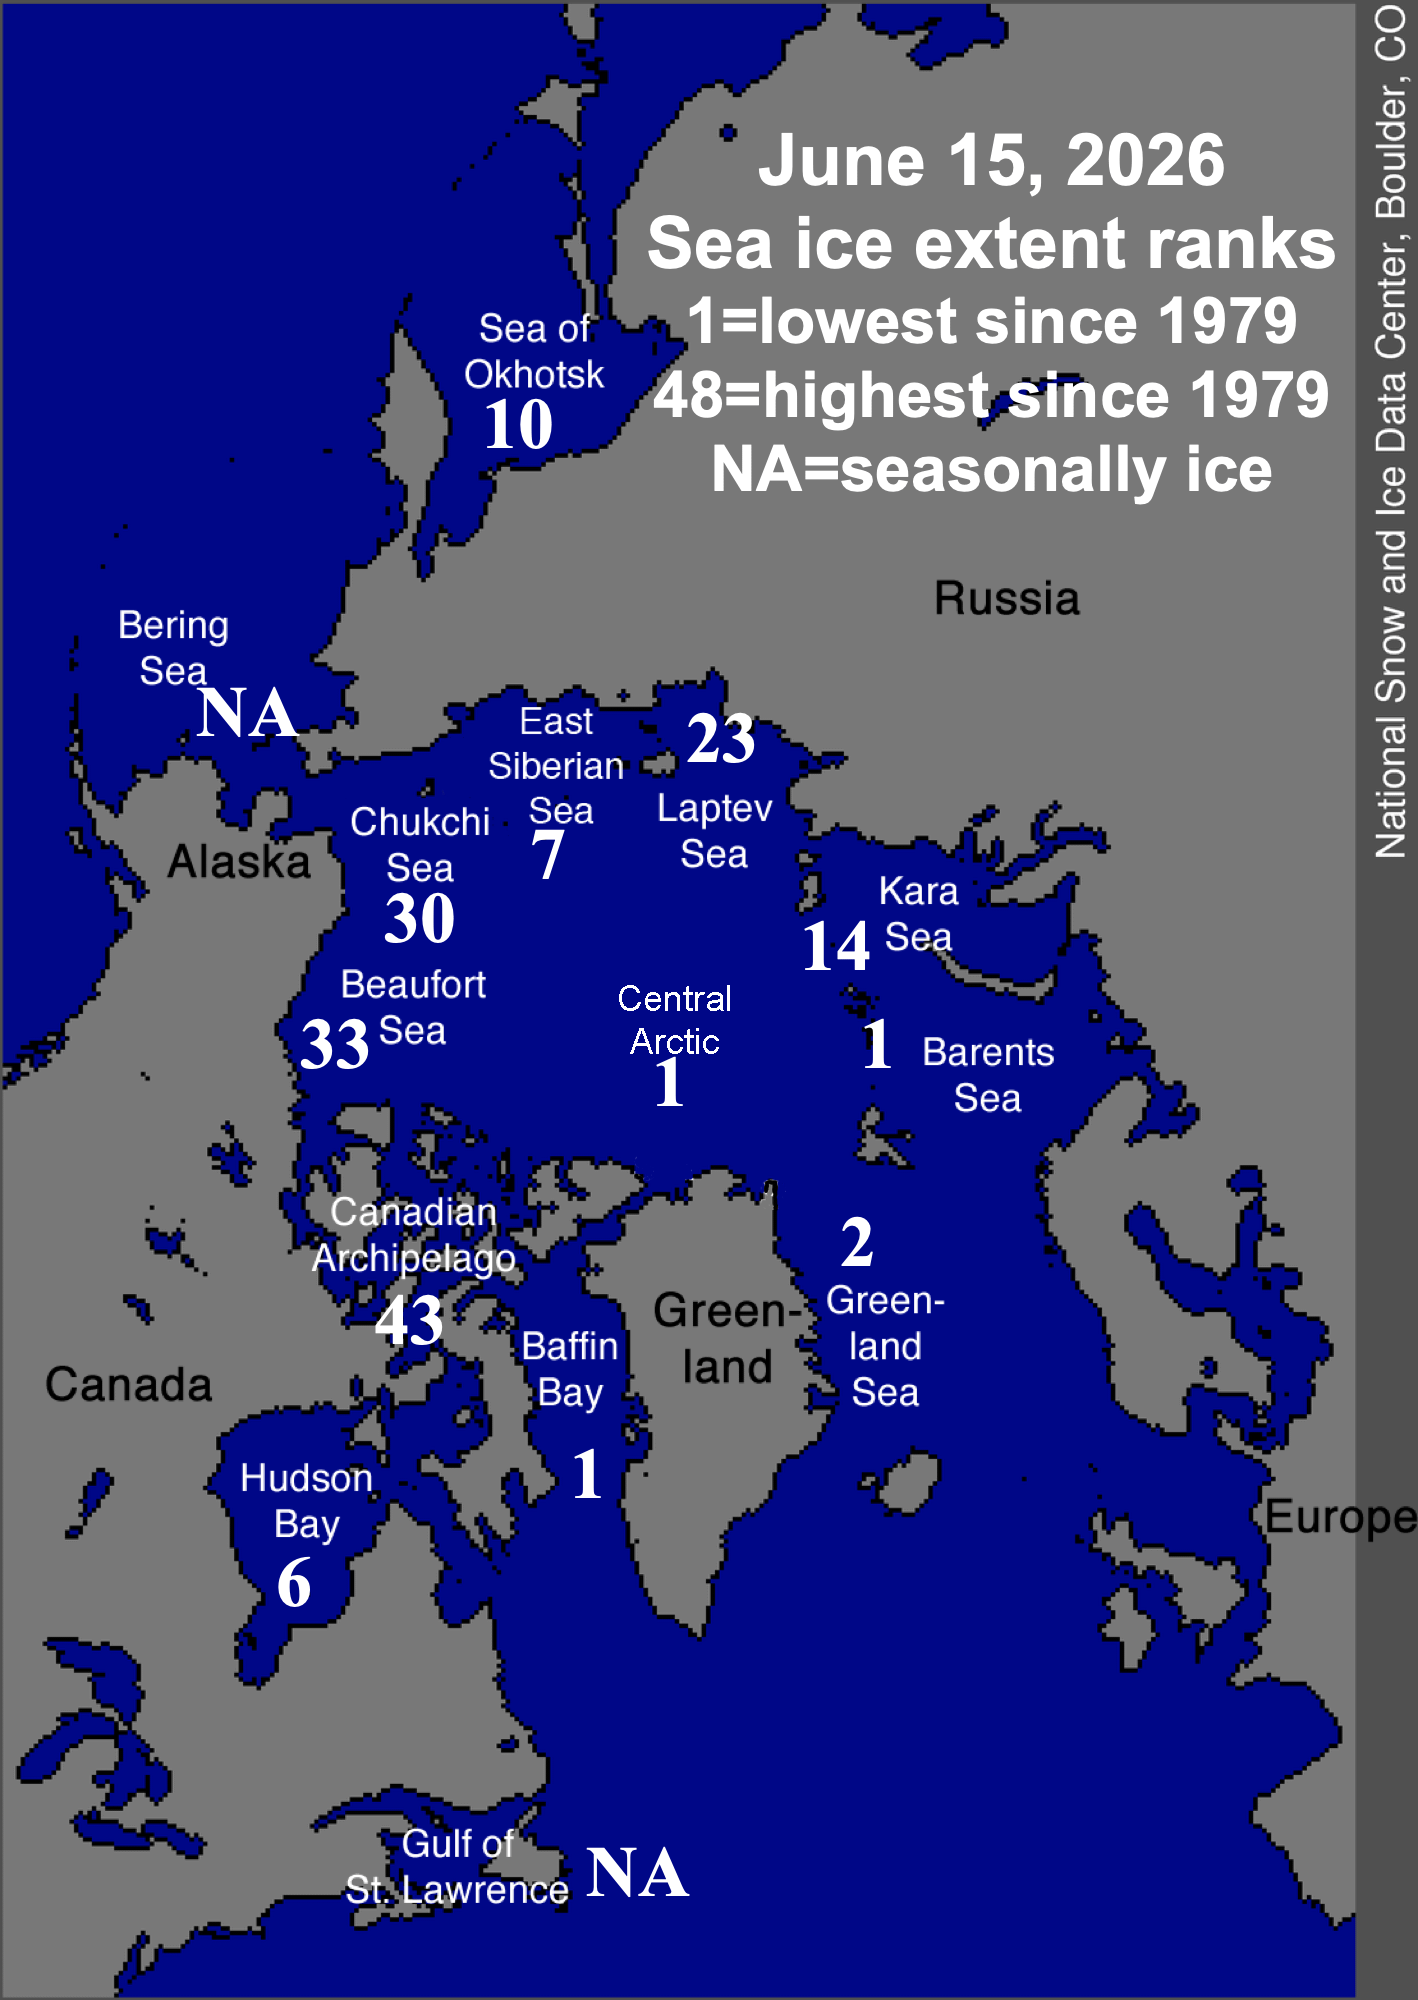
Regionally, sea ice extent is well below median in most basins and the Atlantic side of the Arctic continues to lead the way in low ice extent (Fig. 2). On the Pacific side north of the Bering Strait, sea ice melt is just getting underway, so the ranks are not yet very meaningful. For example, while sea ice extent in the East Siberian Sea was the 7th lowest since 1979, only 1.4 percent of this basin was open water as of June 15 in NSIDC data, compared to the average over the previous 30 years for the date of 0.7 percent.
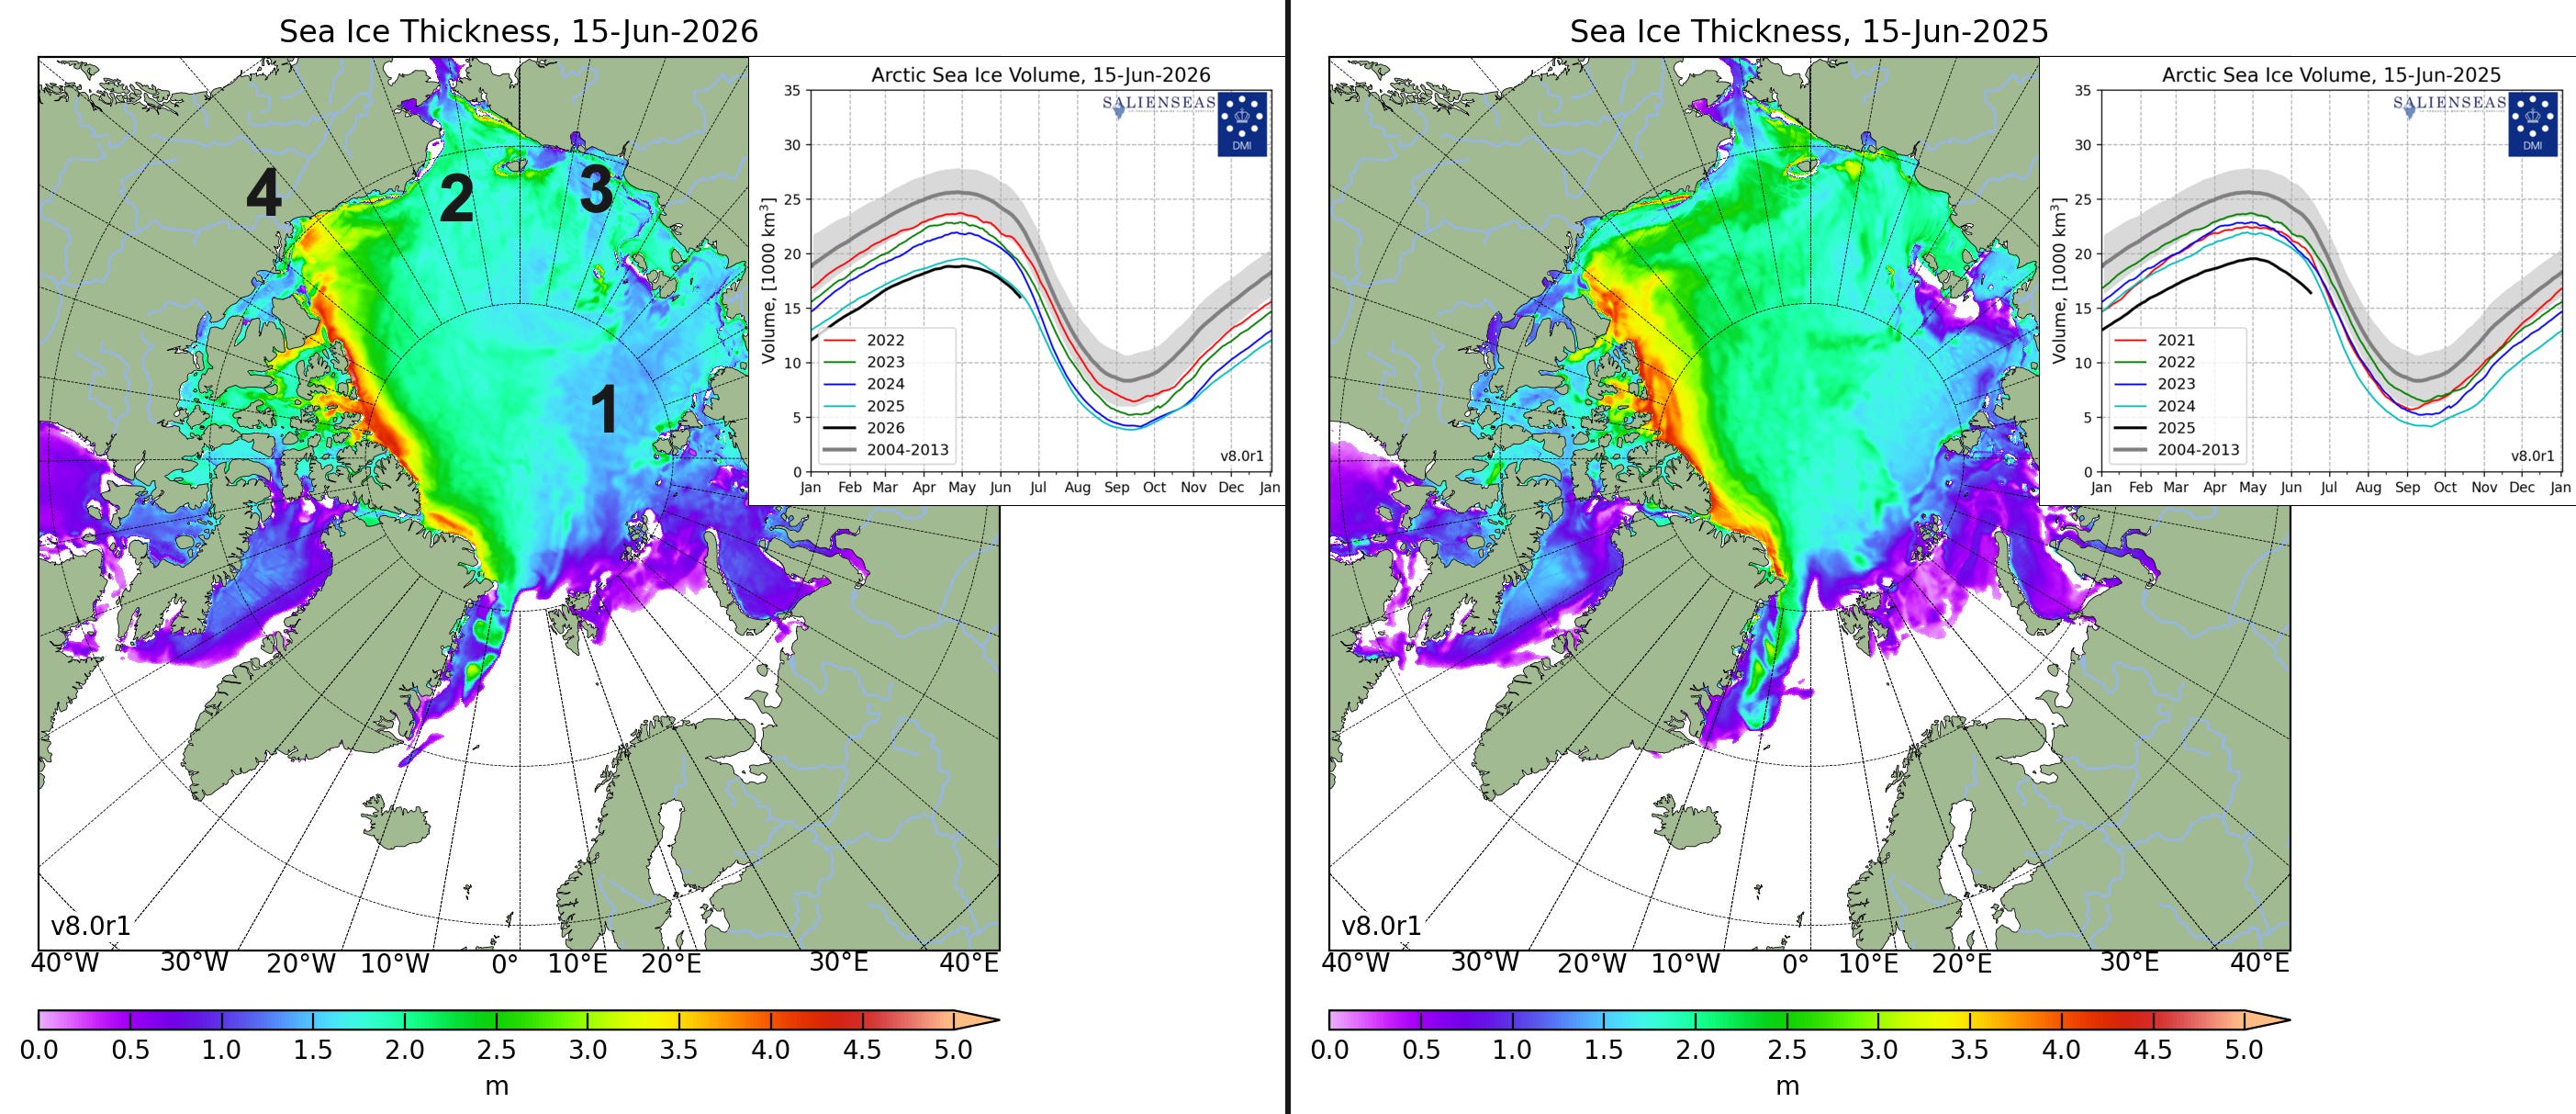
Modeled sea ice thickness from the Danish Meteorological Institute for June 15 this year and the same date last year are shown in Fig. 3. There are few areas with noticeable differences this year relative to last June. Ice is notably thinner in the northern Kara Sea (labeled #1 in Fig. 3, left), the eastern Laptev sea (#2) and northwest Chukchi Sea (#3). In contrast, thick multi-year has drifted much farther south in the southeast Beaufort Sea than it did last year (#4). Overall, modeled Arctic sea ice volume this year is almost identical to last year’s record low volume for mid-June.
Snow cover
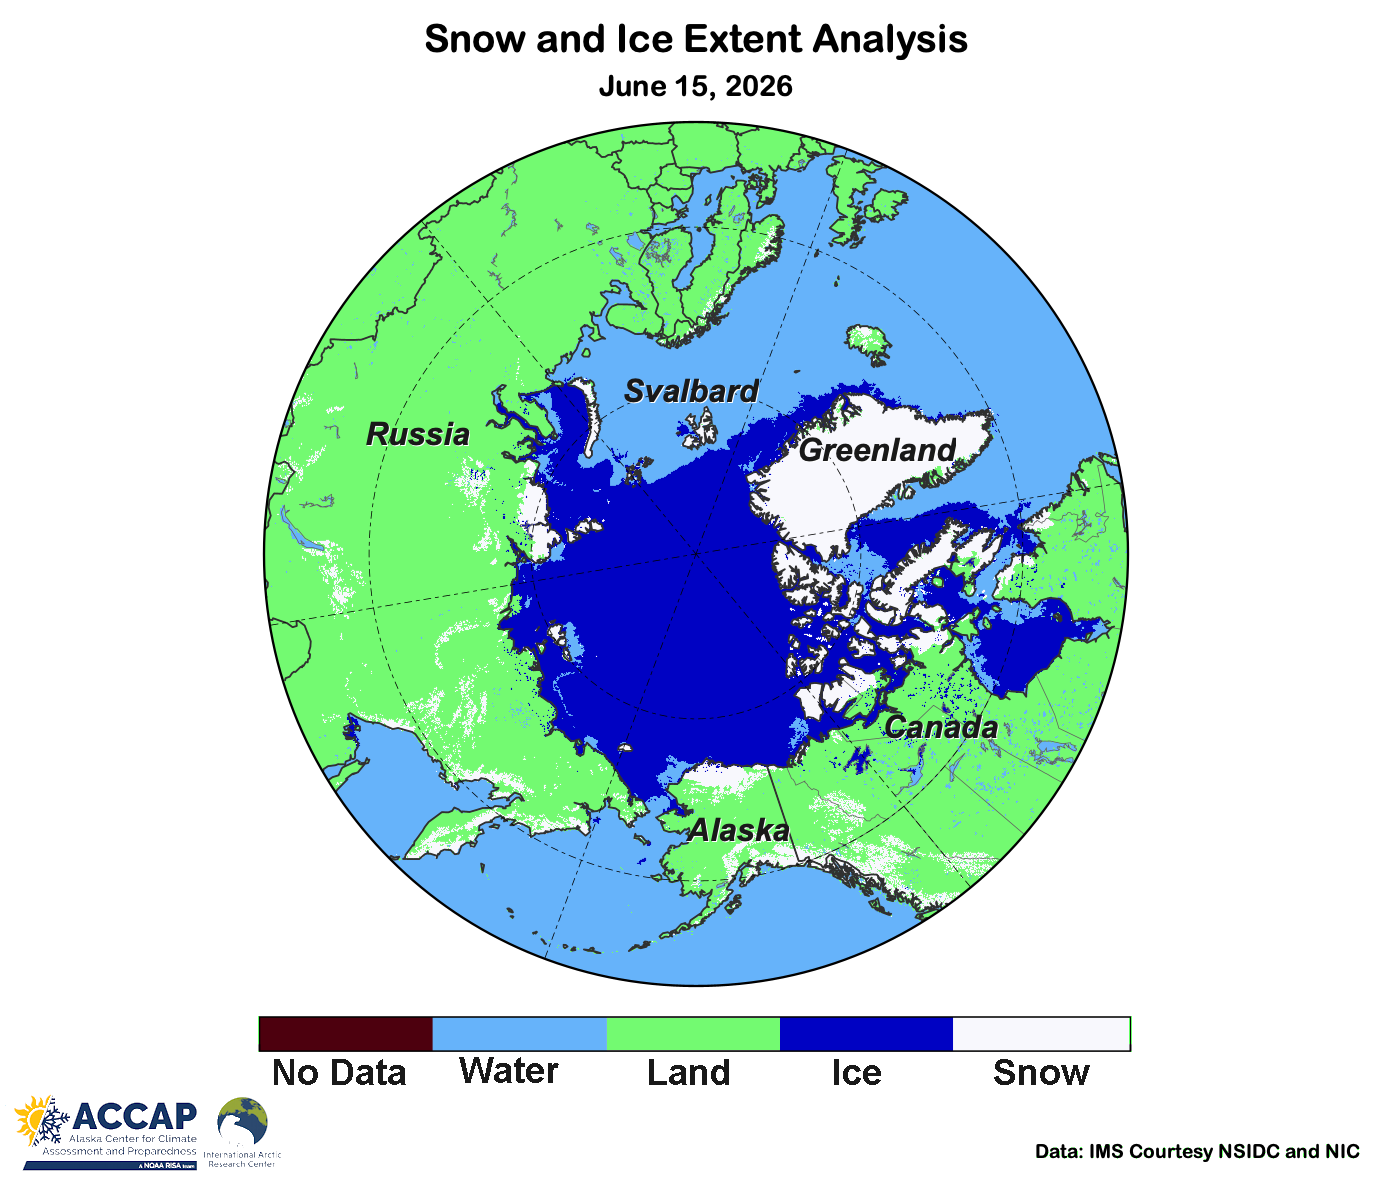
The winter snowpack continues to melt away in high Arctic lands. Excluding the Greenland Ice cap, snow cover extent decreased by 55 percent the first half of June, and extent was the lowest for June 15 since 2023. In North Amercia, low elevation snowpack is mostly confined to the Canadian Arctic Islands and parts of Alaska’s North Slope (Fig 4). In the Eurasian Arctic at low elevations, remaining snow cover is confined to the high latitude offshore island, the Taymyr Peninsula in northwest Siberia and some coastal strips bordering the Sea of Okhotsk and western Bering Sea.
On the Greenland Ice Sheet, analysis from the Danish Meteorological Institute shows that the ice sheet has began the summer “loss” of snow and ice as melting and runoff now exceed daily snowfall. Additionally the fraction of the surface area experiencing melt has increased significantly in recent days. In short, summer has arrived on the Greenland Ice Sheet.
Technical details and underlying data sources
As usual in this newsletter, Arctic means “poleward of 60°N” unless otherwise specified except for sea ice, where “Arctic” means all northern hemisphere sea ice.
NSIDC Arctic Sea Ice information, graphics and data available here.
Products from the OSI SAF High Latitude Processing Center (including but not limited to sea ice) are available here.
Arctic-wide sea ice extent data is available from JAXA here.
MASIE information and data available from NSIDC here.
Modeled sea ice thickness and volume from the Danish Meteorological Institute is available here.
IMS Snow and ice analysis products are available through the landing page here. There is no information in this product about the depth or water content of the snowpack or sea ice thickness or type.
Thanks for reading Alaska and Arctic Climate Newsletter! Subscribe for free to receive new posts and support my work.
Comments
Nothing yet. Say the first thing.
Sign in to join the conversation.