
I am all about data. Since discovering my passion for analytics, I have always enjoyed every part of the process in making data narratives. Well, maybe not the occasional data entry tasks. I find them to be mind-numbing and only god knows how I finished those tasks. I am pretty sure most of you in my readers list have also come across a time in their lives where they have had to take data from 0 to 1 i.e. process some basic, unorganized facts, details, information into excel-like organized cells.
While all of us agree that this process is the most boring, it is arguably the most indispensable part of the analysis process. Without accurate and well-structured data, even the most sophisticated algorithms or analysis techniques are futile.
These spreadsheets full of data points have become omnipresent. From shopping lists to mental budgeting, even the most ‘human’ tasks are a reflection of our desire to bring structure and clarity to our lives. You may disagree, but even the points you make are somewhat tabulated and organized.
Data is everywhere around us — like water around fish. It has become a part of our environment. However, simple data entry processes have become so routine and automated that we take its presence for granted. It has faded into the background. Just as fish don’t actively recognize that they are in water — their medium for life, we too have forgotten about the importance of data entry and the groundwork that it lays.

During my time at the University of Chicago, I was able to take coursework which taught me how to recognize collective behavior, cultural patterns, and the histories of their emergence. It was truly hard to believe that it was a Booth School of Business course. This course forced to us to notice the world around us. It let every part of our life become a place where we can keenly observe human behavior and learn more about how we operate collectively.
In this essay, I want to describe a social experiment that I, along with my colleagues, designed to understand norms of politeness. Put easily, this study looks at how different cultures affect what people do in public when faced with a minor inconvenience.
I co-authored this study with 3 other colleagues:
Anonymous, Booth School of Business
Rhodwin Chungag, Booth School of Business
Omar Ansari, Harris School of Public Policy
The experiment
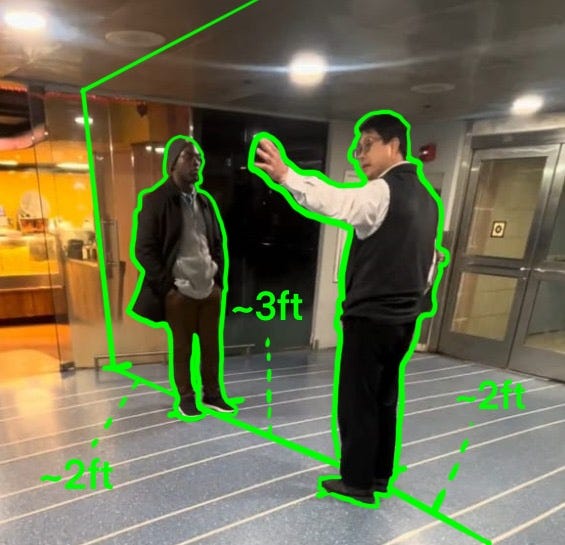
We placed ourselves in public places such that pedestrians would be faced with 2 options:
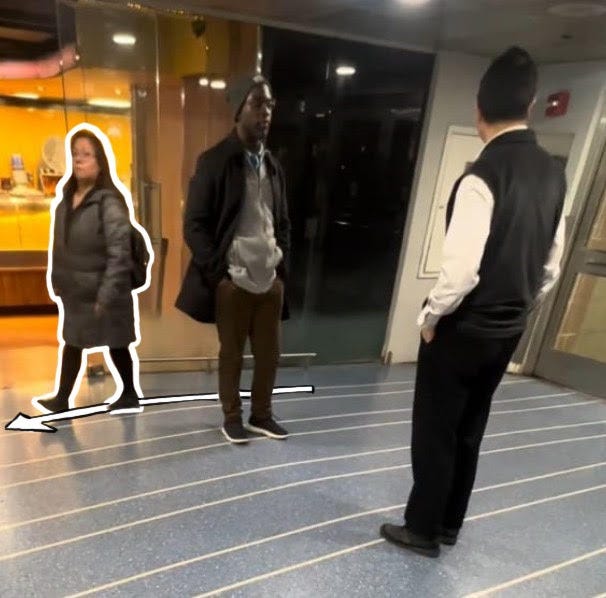
To pass around us (see example picture below)
To pass through us (see example picture below)
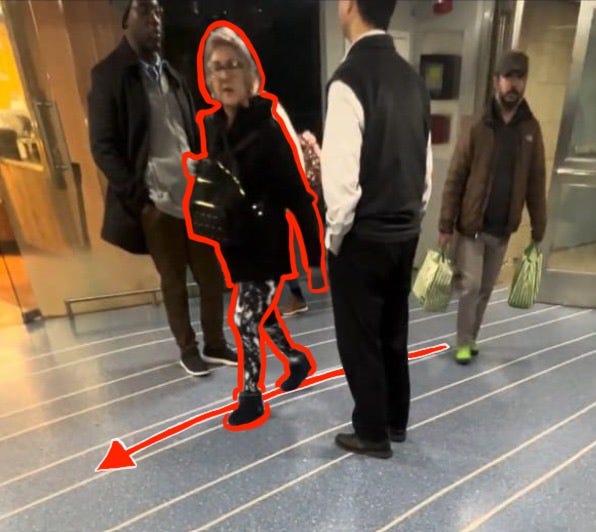
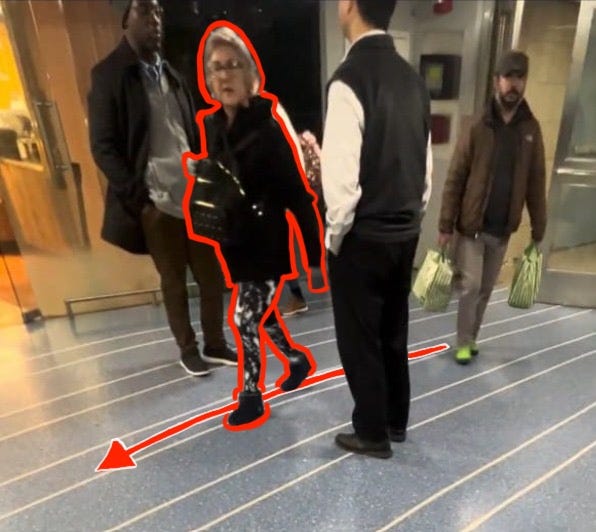
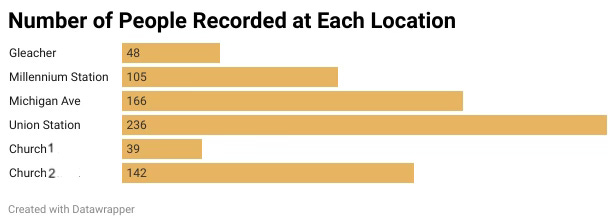
With this experiment, we recorded a total of 736 people across six locations! That was a lot of recording and data entry. We were deep in the waters.
All the locations were in Chicago, 4 in downtown and 2 in the suburbs:
Michigan Avenue & East Wacker: This area’s proximity to the Riverwalk and the Magnificent Mile primarily attracted tourists. Pedestrian traffic was predominantly composed of individuals sightseeing and shopping.
Union Station: As a central transit hub, Union Station provided a diverse sample, including tourists and suburban commuters carrying luggage and office bags. Data collected at 4:30 PM during the Thanksgiving rush hour showed crowded conditions and reactive movements, with all instances of bumping here.
Millennium Station: Located at the final stop for trains coming from Chicago's South Side, Millennium Station offered a commuter-focused sample. Observations were conducted at 2 PM early in Thanksgiving week, capturing localized movement patterns.
Gleacher Center: This location featured a younger crowd of students and professionals. Some pedestrians were familiar with the speakers, which likely introduced bias, as four individuals initiated conversations with them.
5. & 6. Churches in Northern Suburbs of Chicago: Situated in the suburbs of Chicago, these locations involved a group member conducting the experiment alongside their child. The familiarity between pedestrians and speakers introduced bias, as six pedestrians engaged in conversations with the speakers.

To observe pedestrian behaviors, the speakers positioned themselves to occupy approximately half of the sidewalk or passageway at each of the six locations. This intentional obstruction subtly but deliberately inconvenienced pedestrians, introducing a cost to their decision-making.
We maintained consistent body language and flow of conversation throughout the experiment. Additionally, we used a phone placed at a discreet vantage point to record the experiment at each location for at least 10 minutes.
Recordings were then transcribed in Excel, making note of pedestrian movements during experimentation. We logged and analyzed visual characteristics of race, gender, age, and group presence. These traits were assessed solely through visual observation, which introduces some bias into our data. To ensure consistency among us tabulators, we conducted an inter-rater reliability exercise, achieving 74% agreement in classifying pedestrians' ethnicity.
Inter-rater reliability is a way to measure how much two or more people agree when observing or judging the same thing.
Know someone from Chicago? Or know someone who finds the study culture interesting? Share this post with them and make their day!
Results
We observed 736 pedestrians across six locations, with almost an even split between men (51%) and women (49%). Most people walked around the speakers: 93% (685) walked around the speakers, while only 7% (51) walked through or bumped into them.

Of the 51 pedestrians who exhibited deviant behavior, 84% were European/European American, with African Americans (14%) and East Asians (2%) comprising the rest.
Results by Ethnicity

This matches Gelfand's research, which suggests that loose cultures value personal choice and efficiency over following group norms. People from Western Cultures (European American, African Americans) tend to have looser norms In contrast, people from tighter cultures (such as East/South Asians, North Africans/Middle Easterners, and Hispanics) almost always stuck to the norms, always walking around the speakers, regardless of the situation. This supports the idea that tighter cultures prioritize harmony and avoiding disruptive behavior.
Gelfand's idea of "tight" and "loose" cultures refers to how strictly societies enforce rules and norms. In tight cultures, there are clear, strict rules that people are expected to follow, with little tolerance for deviations. These cultures prioritize group harmony and order. On the other hand, loose cultures have more relaxed rules and allow for greater individual freedom and flexibility. People in these cultures are more likely to make personal choices and may not always follow group norms
However, since Eurpean/Eurpoean Americans also are present in the dataset in a higher number, it is good to visualize this in relative terms i.e. as a percentage of total.

Results by Location
We observed the highest rates of walking in between in the churches! Churches are spiritual places with established communities where people exhibit togetherness and it is not a stretch to assume that people are more respectful and polite toward each other. So how could this be?
Youth: Youths made up 27% of the walk-in-between instances, with notably high rates at the churches. When youths were excluded from the data, the rates of deviant behavior at these locations were more in line with other areas, indicating that their presence had a significant impact on skewing the results. This supports Bronnenberg et al. (2009), indicating that youth adapt quickly to dominant norms but have yet to internalize cultural frameworks fully. Their higher rates of deviant behavior likely reflect incomplete socialization and responsiveness to immediate situational influences.
But why were the youth more deviant at these places? The more obvious answers could be that Churches tend to be more compact places especially when compared to our other locations. And so, smaller, more confined environment may compel people to move around more freely, leading to higher instances of walking in between.
A more complicated explanation could be what I call the "sin theory," where individuals may feel a subtle desire to "punish" the speakers for occupying the hallway, which they perceive as an improper, illegal or disruptive act. This desire could be more pronounced in religious people or religious places. It is important note that this is just a theory and not been evidenced by the data collected in this experiment. This theory is not included in the original study, and reflects the personal opinion of the author of this post.

Performing this social experiment made me realize the critical importance of foundational tasks like data entry. Through this process, I became keenly aware of the mistakes and biases that can creep in during such tasks. The inter-rater reliability exercise, where we compared observations, highlighted how differently people can interpret the same visual information.
Most importantly, I realized that data entry didn’t feel like a chore because I was fully engaged in the project. From hypothesizing to collecting and tabulating data, and finally analyzing it, I was connected to every step of the process.
I’ve come to appreciate data entry as more than just a technically necessary step — it’s a rite of passage into the world of analysis. It teaches patience, attention to detail, and humility, while reminding us of the deeply interconnected nature of our work. Like the water in Wallace’s fish analogy, it’s easy to overlook, yet it is what sustains the entire process. Realizing this transforms data this seemingly boring chore into a profound act of creation.
If you enjoyed this experiment and liked the analysis, subscribe to this newsletter! It motivates me to research and write more. I keep the newsletter interesting, informative and fun!
Comments
Nothing yet. Say the first thing.
Sign in to join the conversation.