
As opposed to North Dakota where strict lockdowns were enforced, South Dakota, under the leadership of Governor Kristi Noem, chose to open up and allow its annual Sturgis Motocycle Rally to go ahead in August 2020. Half a million bikers showed up.
In the end there was little difference between the two states excess mortality data busting the contagion myth.
As expected, South Dakota was vilified for its stance through the fraudulent use of the PCR test to drive up fake cases of ‘Covid’.
Dr Gerry Waters flew to Sturgis in South Dakota to talk to some of the locals about their memories from that time and to applaud them for taking a stand against some of the most draconian measures ever witnessed internationally.
As context to Dr Gerry Waters report from Sturgis, this is an extract taken from Dr Mick McConville’s book Scandemic: The Covid 19 Story in Ireland and Beyond (Chapter 20). Dr Conville is among the Irish dissident doctors who has been brought before a Medical Council fitness-to-practise hearing accused of misconduct over social media posts. In his book he examines the difference between South and North Dakota and gives his conclusion.
Dr Mick Mc Conville writes:
Sweden’s public health officials have been described as either superstars or madmen, and while it’s often said, “Sweden didn’t lockdown,” this isn’t entirely accurate. Sweden shut down businesses and limited public gatherings to 50 people, yet private garden parties with 200 guests were allowed. Since the Swedish situation is nuanced, to better examine the impact of “lockdowns,” “social distancing,” masks, and other sweeping pandemic measures, let’s shift our focus elsewhere.
To clarify the difference in COVID-19 policy approaches, let’s compare North Dakota and South Dakota directly.
Before statehood, the northern Plains were home to the Dakota and related nations, who relied on natural resources and seasonal movements. U.S. expansion and settler pressure led to conflicts like the U.S.–Dakota War of 1862 and, eventually, to the creation of Dakota Territory in 1861. By 1889, due to population growth and political motives, Congress split the territory into North and South Dakota, admitting both as states the same day.
On 18 March 2020, Governor Burgum of North Dakota signed Executive Order 2020-06, ordering bars and restaurants to close to on-site patrons, closing schools, and prohibiting large gatherings, effective from 20 March. The restrictions in North Dakota continued and intensified: On 1 May 2020, the state introduced the “ND Smart Restart” plan with tiered capacity limits and social distancing mandates. By November 2020, further steps included Executive Order 2020-43, which limited restaurants to 50% capacity, capped event venues at 25%, mandated masks, and maintained typical COVID restrictions through January 2021. These actions represented a comprehensive set of statewide restrictions in North Dakota.
By contrast, South Dakota Governor Kristi Noem took a markedly different path. She sought emergency powers—through HB 1297—to grant the Secretary of Health broad closure authority, but the legislature refused to grant them. Governor Noem issued only limited executive orders in April 2020, requiring adherence to CDC guidance and postponement of non-emergency surgeries. She soon reversed these steps and never issued statewide business closures, shelter-in-place orders, or mask mandates. In direct contrast to North Dakota, South Dakota adopted minimal state-level COVID-19 restrictions throughout the pandemic.
The sharply differing approaches of the Dakotas quickly drew media attention. For example, The Spectator declared South Dakota’s less-restrictive strategy a failure, claiming the virus was out of control, and hospitals were overwhelmed. However, the data in this chapter show both claims are unfounded: South Dakota’s hospitals were not overrun, and the state’s mortality matched North Dakota’s despite minimal restrictions.
In the western foothills of the Black Hills of South Dakota, the little town of Sturgis has a population of 7,000. Every year, it hosts a motorcycle rally that dates back to the 1930s. The rally paused or shrank during the war years but returned in the late 1940s with more riders, scenic “Gypsy tours” through the Hills, and increasingly elaborate races and award ceremonies. As numbers swelled, the town started closing off sections of Main Street for bikes and festivities, and what had begun as a club race slowly turned into a regional pilgrimage for motorcyclists.
Throughout the 1960s and 1970s, Sturgis took on a more freewheeling “biker-festival” character, with the event expanding from three to five, then seven days. Sturgis exploded with campsites and makeshift accommodations spread around town, and the rally gained a reputation for a mix of racing, partying, and countercultural flair. Over time, commerce expanded to include temporary vendors, official logos, licensed merchandise, organised rides, and, eventually, major concert venues that brought nationally known bands to the Black Hills each August. The Sturgis rally ballooned into a ten-day wonder, drawing hundreds of thousands of visitors in peak years and transforming a small prairie town into a dense, roaring city of chrome and leather.
From the Sioux Falls Argus Leader: “Screw COVID. I went to Sturgis. Rally kicks off with defiant bikers in attendance.”
Thousands of bikers poured into Sturgis, a small city in South Dakota, on Friday. The 80th Sturgis Motorcycle Rally rumbled to life despite fears of a massive coronavirus outbreak. Organisers expected 250,000 people from across the country for the 10-day event. That would be about half the number of previous years. Residents and a few bikers worried that the crowds could create a “super-spreader” event. City Manager Daniel Ainslie acknowledged public safety concerns. He said the city had prepared hospital staging and tested rally workers and emergency responders. Officials concluded they couldn’t cancel, since “no one owns the event” and riders would come anyway.
Once the rally began, public criticism and media speculation about COVID escalated almost immediately, intensifying the spotlight on Sturgis within the broader debate about pandemic responses.
One widely cited example came from Sky News: “Coronavirus: US biker rally responsible for more than 260,000 cases of COVID-19, study suggests.”
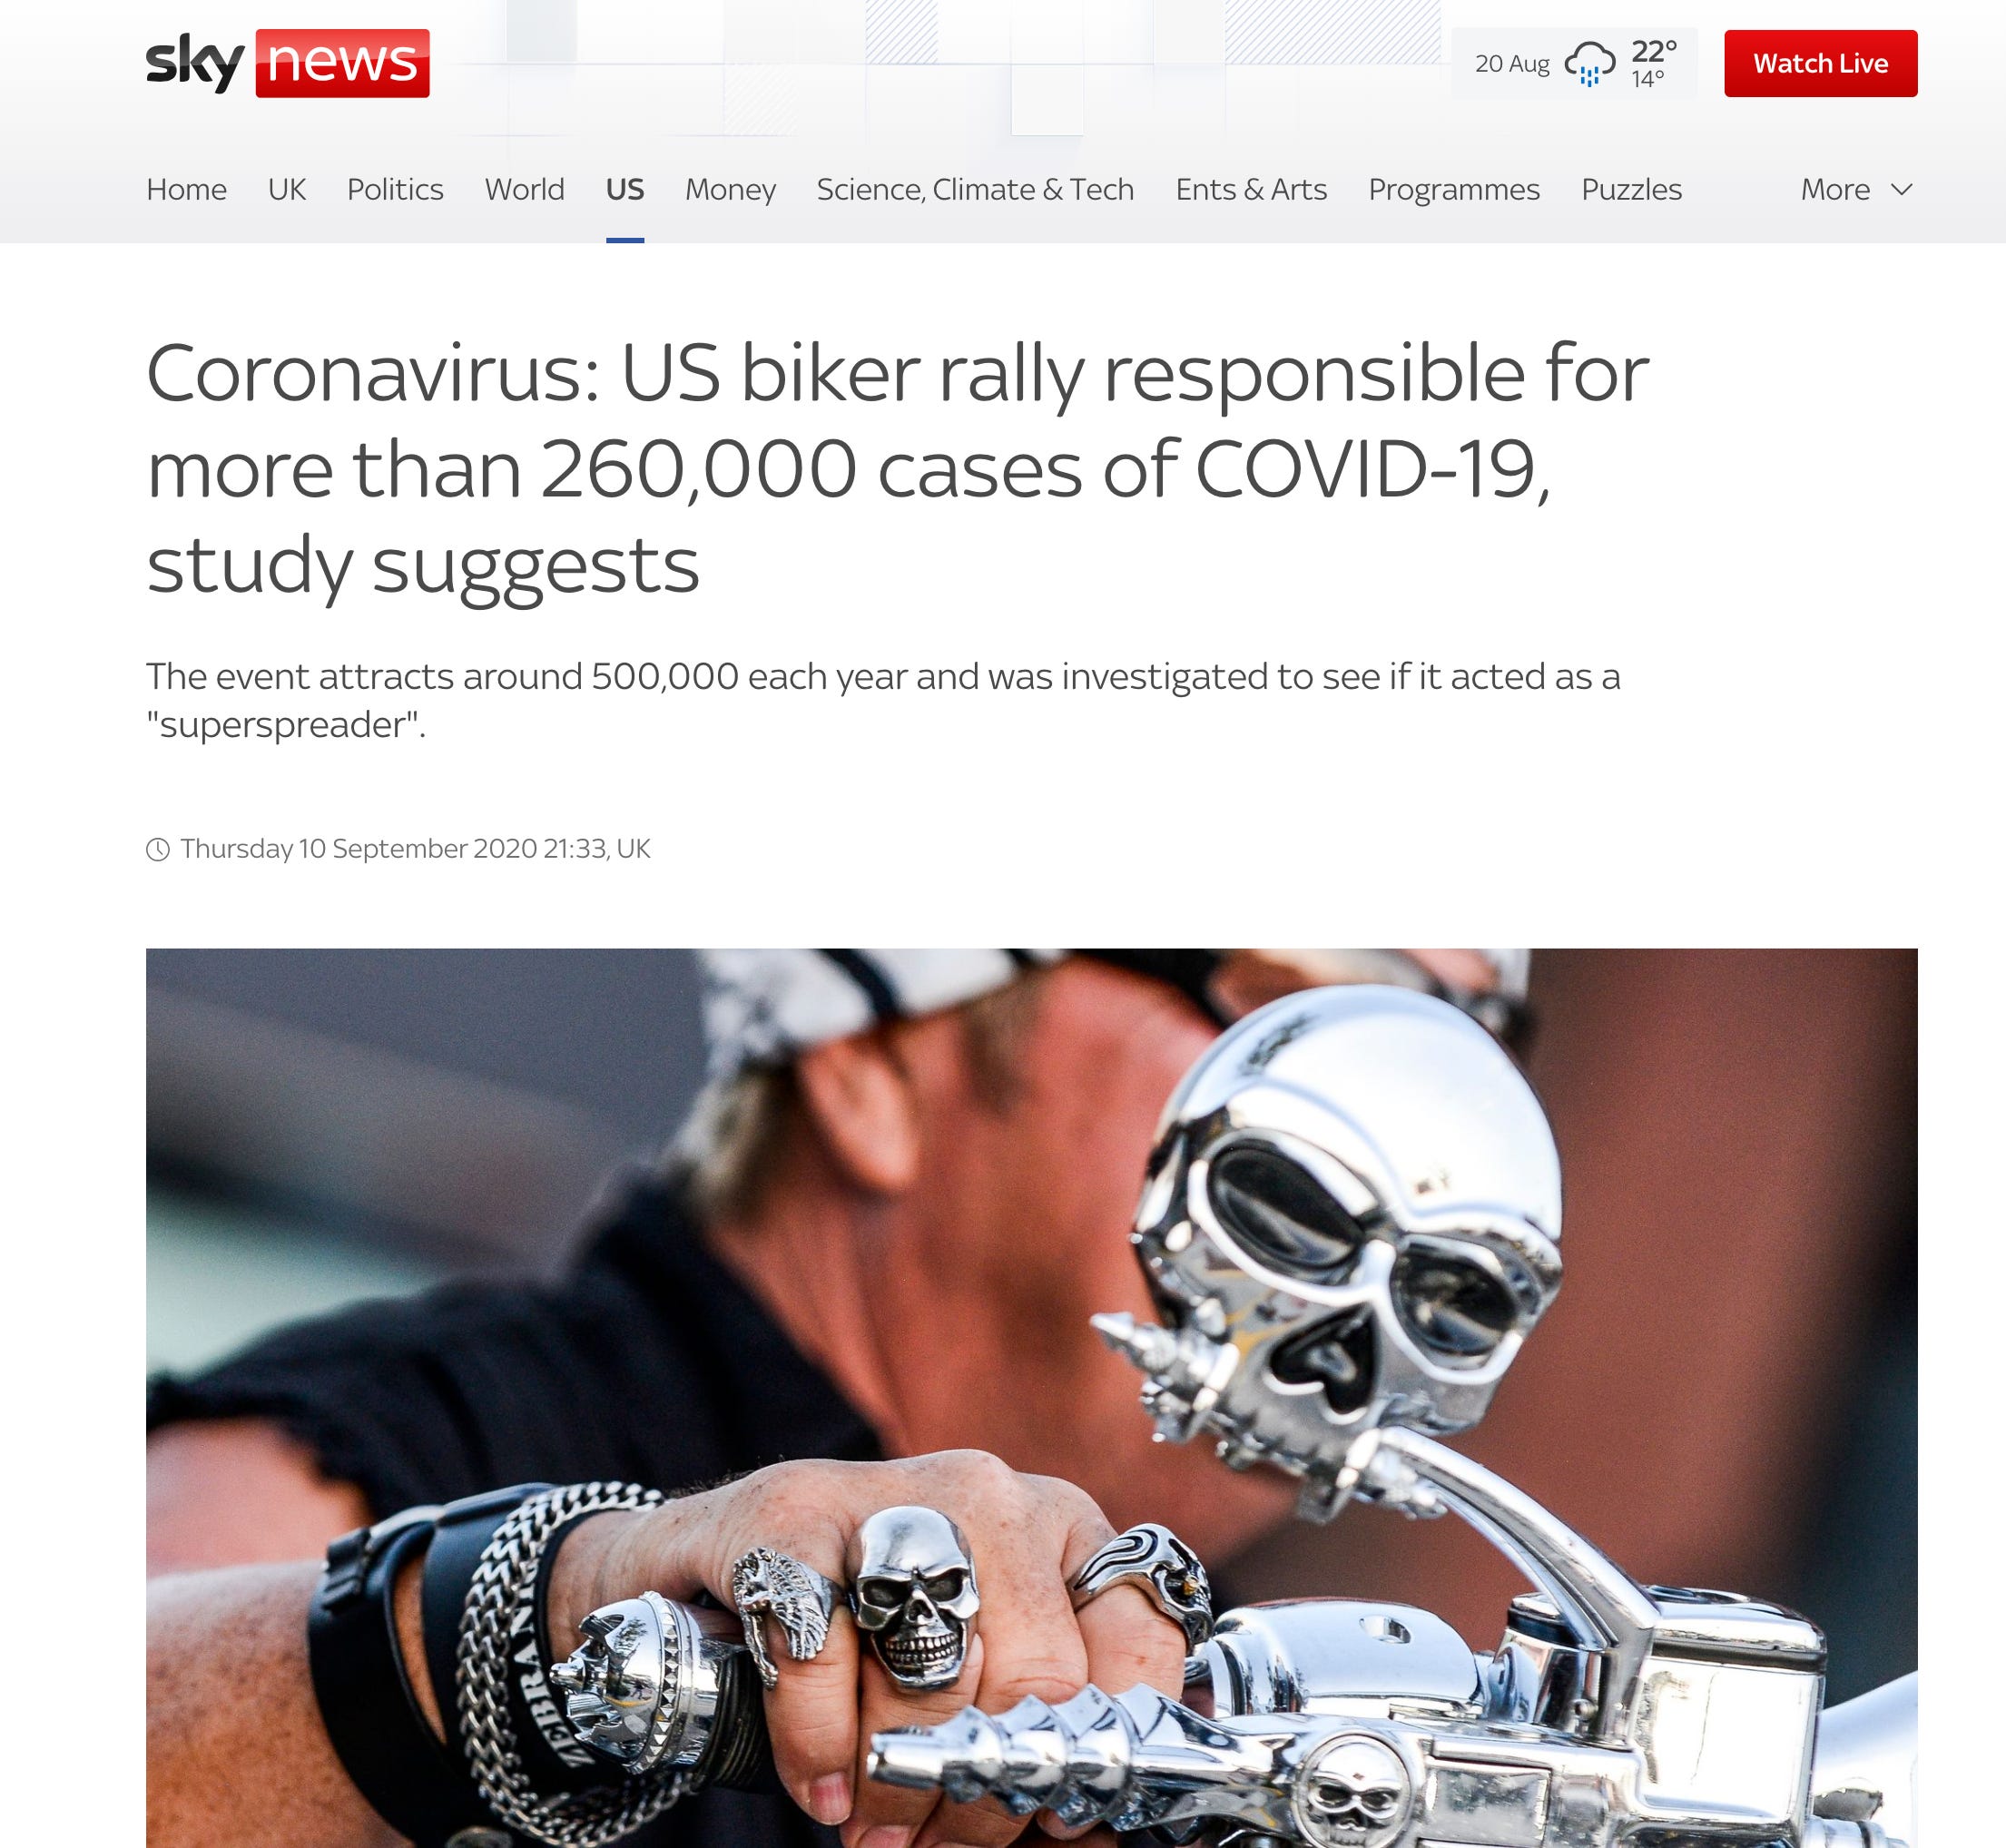
Sky borrowed the claim from a non-peer-reviewed paper from San Diego State University titled “The Contagion Externality of a Superspreading Event: The Sturgis Motorcycle Rally and COVID-19.” The study used anonymised smartphone mobility data (SafeGraph) to estimate how many people travelled to Sturgis in August 2020 and then returned to their home counties. The authors applied a “synthetic-control” and “difference-in-differences” approach to compare COVID case growth in Meade County and in high-inflow counties nationwide. The methodology assigned cases to Sturgis attendance by comparing modelled counterfactual trends with observed case trajectories—an approach that cannot distinguish rally-associated transmission from community spread, which was already accelerating across the Midwest in August 2020 as autumn transmission conditions returned. The result was a headline figure of roughly 260,000 COVID cases and over $12 billion in healthcare costs — a figure that, as Ashish Jha, dean of the Brown University School of Public Health, noted, did not “pass the sniff test.”
From the online journal Inverse, reporting by Sarah Sloat on 10 September 2020: “What the Sturgis superspreader report actually says about COVID-19.” The South Dakota Department of Transportation recorded about 462,000 vehicles entering Sturgis during the 10-day event, a 7.5% drop from 2019. The San Diego study used a smartphone-data estimate of 395,453 attendees. This is a different figure, based on anonymised device movements rather than vehicle counts, and it appears in the Inverse article. The non-peer-reviewed report estimated 266,796 COVID-19 cases nationwide could be linked to the event. Smash Mouth’s lead vocalist Steve Harwell summed up the attitude at their Sturgis concert: “F**k that COVID sh*t.” The study claimed the rally caused 19% of all 1.4 million US cases between 2 August and 2 September. This is both mathematically and epidemiologically absurd. It shows the gap between modelled estimates and real, contact-traced data.
After the event, the South Dakota Department of Health found only 124 cases linked to the rally through contact tracing. The CDC’s published study (MMWR Morb Mortal Wkly Rep. 2020 Sep 18;69(37):1319–1323) later reported 463 primary cases among rally attendees within two weeks of the event. They also found 186 secondary or tertiary cases among close contacts — a total of at least 649 COVID-19 cases directly linked to rally attendance. This was not a “super-spreading” event, but rather a minor one. Not 260,000 and $14 billion; it was far fewer cases than Moderna received million-dollar instalments from Operation Warp Speed, for about the same epidemiological result. Governor Kristi Noem called the report “grossly misleading.” The rally’s organisers called it “blatantly faulty,” and Ashish Jha said the methodology didn’t “pass the sniff test.”
This episode exemplifies a common pattern from the pandemic: questionable models garner prominent media coverage and shape public perception, while thorough contact tracing reveals a much smaller impact that receives little attention. For sound policy judgments, we must distinguish sensational projections from actual outcomes.
In reality, South Dakota’s COVID wave from August through December 2020 followed a classic Gompertz curve, indicating that the surge was unrelated to Sturgis, which undercuts the claim that the rally “triggered the wave.”
Most importantly, for South Dakota, we have an antibody survey of healthcare workers that ran independently of case numbers:
Neises JZ, Hossain MS, Sultana R, et al. Seroprevalence of SARS-CoV-2 antibodies among rural healthcare workers. J Med Virol. 2021 Dec; 93(12):6611–6618. doi: 10.1002/jmv. 27224. PMID: 34289148; PMCID: PMC8426917.
The study concluded: “14.8% of healthcare workers from eastern South Dakota and western Minnesota seroconverted over the course of an 8-month testing period, while 85.1% remained susceptible to COVID-19.” For the entire first year of the pandemic, 85% of healthcare workers in South Dakota — those most exposed to the virus — remained unaffected. By late September, only 1.92% of HCWs had been infected. This phase supposedly included the “Sturgis explosion,” but HCW data show minimal transmission. The healthcare worker antibody studies confirm the Gompertz pattern: May–July: 0.29% (baseline), August–September: 1.92% (slow growth), October–December: 14.89% (peak saturation). The Gompertz curve is self-limiting and natural, occurring when an epidemic burns through a limited susceptible population as natural immunity builds up. No external interventions are required.
If we examine hospital admissions, we observe rapid exponential growth from October to early November: 303 admissions on 14 October to 547 on 16 November, an 80% increase in 33 days. Cases peaked in mid-November, hospitalisations peaked in late November, and deaths lagged hospitalisations by. During this peak, the South Dakota COVID-19 dashboard on 14 October reported that 34% of hospital beds, 39% of ICU beds, and 73.9% of ventilators were still available. available. The health system in South Dakota was never overwhelmed. The Atlantic’s report that “a network of 37 hospitals sent more than 150 people home with oxygen tanks” failed to note that those 37 hospitals were owned by Avera Health — a regional health system whose critical access hospitals, the majority of which operate with 25 beds or fewer in line with federal CMS critical access designation criteria, routinely transfer patients across their five-state network as standard operating procedure, pandemic or not.
Both states survived the pandemic with more than 99.6% of their populations intact. Over the full pandemic period, cumulative excess deaths are estimated at approximately 220.7 per 100,000 in South Dakota and 200.5 per 100,000 in North Dakota — substantial and comparable per-capita burdens. In almost every age-adjusted ranking, North Dakota and South Dakota appear next to each other: North Dakota 13th worst, South Dakota 21st, a difference statistically minor relative to the gap separating them from Vermont (lowest) or Mississippi (highest).
NBC News, not a sympathetic source, reported that both Dakotas “set global COVID records” for per-capita case rates in late 2020. Both states had minimal government intervention compared to most of the country. If setting a global record while having minimal restrictions produced the same outcome as heavy restrictions elsewhere, then restrictions were not the operative variable.
Both states suffered disproportionately high mortality among their Indigenous populations: North Dakota, approximately 1,510 per 100,000; South Dakota, approximately 1,224 per 100,000. These figures are real. But to compare state-level mortality for the purpose of evaluating NPI policy, the Indigenous mortality must be removed symmetrically from both states, because it is not attributable to anything either governor did or did not do.
The arithmetic is straightforward. South Dakota’s AIAN population is approximately 8.5% of the state’s total (~75,000 people). At a mortality rate of 1,224 per 100,000 against a white rate of approximately 124 per 100,000, this produces roughly 825 excess AIAN deaths above the white rate. North Dakota’s AIAN population is approximately 5.3% (~41,300 people). At 1,510 per 100,000, this produces roughly 572 excess AIAN deaths above the white rate. Stripping both figures out leaves South Dakota with approximately 2,406 adjusted deaths and North Dakota with approximately 2,299 — a residual gap of around 107 deaths across a combined population of 1.67 million, or 0.006 percentage points. That is within any plausible margin of error due to epidemiological noise. North Dakota’s AIAN mortality rate was, if anything, worse than South Dakota’s, suggesting that heavier NPI implementation offered no measurable protection to the most vulnerable population in either state.
The reason the Dakotas appear near the top of “worst mortality” lists is demographic, not policy. The catastrophic outcomes in tribal communities heavily skew the overall state numbers. Adjusted to the white population rate, both states would move from among the “worst” to near the national average, comparable to Minnesota or Wisconsin. There were effectively two Dakota COVID experiences: one regionally typical, one globally catastrophic. Conflating them and then blaming the catastrophic one on Governor Noem is not epidemiology.
South Dakota’s Native American tribes — particularly the Oglala Lakota of Pine Ridge and the Rosebud Sioux — were among the earliest and most aggressive implementers of non-pharmaceutical interventions nationwide. Beginning in early March 2020, weeks before most states, they established tribal checkpoints, mandatory curfews, mask mandates, and reservation border controls. The Oglala Lakota established a formal COVID-19 task force, used tribal radio (KILI) for continuous public health messaging, and implemented colour-coded window systems for elder welfare checks. The South Dakota Army National Guard was subsequently called in to support vaccination events on Pine Ridge in April 2021 — at the tribe’s invitation, since tribal logistics were driving the programme.
Critically, tribal vaccination was administered through a parallel federal system, entirely separate from South Dakota’s state infrastructure. As sovereign nations, tribes received their own direct vaccine shipments through the Indian Health Service (IHS), with independent scheduling and administration. The Rosebud Sioux ran daily vaccination clinics, drawing people from surrounding non-tribal areas and vaccinating at rates exceeding the state average. Whether the CDC has reliable data on any of this is, in itself, an open and documented question. A peer-reviewed study in BMC Public Health (March 2022) found that 64% of US states did not report AIAN data for at least one COVID health metric. Dr Marcella Nunez-Smith, Chair of the White House COVID-19 Equity Task Force, acknowledged in January 2021 that race and ethnicity data were missing for 49% of COVID cases and 47% of vaccine recipients nationally. The CDC’s own vaccination survey, based on a telephone response rate below 25%, explicitly acknowledged that race and ethnicity were missing for approximately 25% of vaccine administration records. In this context, any confident assertion about AIAN vaccination coverage or protection rests on data too incomplete to support the certainty with which such claims were made.
Despite this, the public record is clear enough on the trajectory: the most thoroughly intervened population — running its own lockdowns, checkpoints, and vaccination clinics — experienced the worst outcomes, and those outcomes worsened through 2021 as vaccination coverage rose. Life expectancy for Native Americans dropped from approximately 67 years in 2020 to 65.2 years in 2021, the largest decline of any racial group in the United States, occurring precisely during the period of maximum vaccination effort.
The standard response is “structural inequality.” It does not survive scrutiny. The 10-fold mortality differential between AIAN and white populations in the same state, exposed to the same variants at the same time, cannot be attributed to SARS-CoV-2 itself. The virus does not discriminate by race. A peer-reviewed meta-analysis establishes that the known comorbidity multipliers — cardiovascular disease (RR 2.25), chronic kidney disease (RR 3.25), diabetes (RR 1.48), hypertension (RR 1.82) — can account for a 3–5-fold disparity at most, even when stacked. A matched-comorbidity study published in Scientific Reports found that Native Americans with identical comorbidity profiles to white patients still died at 234% higher odds, confirming that a substantial excess mortality remains after controlling for pre-existing disease, driven by structural failures in healthcare delivery that IHS chronic underfunding had embedded over decades. These are deaths that SARS-CoV-2 accelerated but did not cause. They were never going to be solved by a mask mandate or a booster campaign. Attributing them to Governor Noem’s policy choices is not an epidemiological argument; it is a political one, and it does not survive scrutiny.
A CDC study found that mRNA COVID-19 vaccines were 94.6% effective at preventing hospitalisations among AIAN people. If that figure is accepted, and if AIAN communities did achieve meaningful coverage — as IHS and tribal programme data suggest, though the CDC’s own records acknowledged race and ethnicity data were missing for approximately 25% of vaccine administration records — then AIAN mortality should have declined in 2021. Instead, life expectancy fell further. Either the vaccine efficacy figure does not translate to population-level outcomes at scale, or coverage was lower than reported, or both. The data architecture that would resolve this question was, by the CDC’s own admission, incomplete. What is not incomplete is the outcome: the most intervened population in South Dakota experienced the worst result.
South Dakota also exposes the mysterious disappearance of influenza, used as an off-switch by public health officials when needed, and an on-switch to explain the failure of COVID vaccines.
If masks and social distancing were so effective that they eliminated influenza, which is less transmissible than SARS-CoV-2, why did they fail to stop COVID waves in the same populations at the same time? In late 2020, places with strict lockdowns saw massive COVID spikes while simultaneously recording near-zero flu. If NPIs work mechanistically, they should block both viruses. The fact that one vanished while the other surged is not a scientific finding — it is a data artefact.
Prominent sceptics such as John Ioannidis at Stanford argued that the intense focus on COVID created a “surveillance bias”: medical systems were incentivised to test for COVID first. Using high-cycle PCR thresholds for COVID while largely stopping routine flu screening in outpatient settings created the illusion. Laboratory data — Australian FluView and U.S. FluView — showed that positive flu tests dropped to near zero. But if you looked at death certificates, deaths attributed to “Influenza and Pneumonia” did not vanish. They persisted at baseline levels. Flu vanished in places with no COVID, such as Australia in early 2020, and persisted in places with lots of COVID, such as the Dakotas in late 2020.
Kumar et al. (2022), in Annals of GIS, built a statistical model from 20 years of historical data (1999–2019) for 11 causes of death. In 2020, for “all causes combined,” 55% of actual values exceeded the upper confidence limit of the historical baseline. Crucially, the influenza and pneumonia category stayed at or above baseline throughout, meaning deaths did not simply swap from one column (flu) to another (COVID). The total burden increased. The clinical syndrome of severe respiratory death never decreased; only the label changed. This means the excess mortality in South Dakota was not a substitution effect. It was a genuine increase in total disease burden — one that makes the “NPIs and vaccines solved the problem” narrative even harder to sustain, because the underlying burden of severe respiratory illness persisted regardless of what policy was in place.
Kumar found that mortality was roughly the same across all states, regardless of lockdown severity, vaccination rates, or geography. North Dakota, with restrictions, and South Dakota, without, had the same outcome. Heavily locked-down Northeast states and open Southern states had the same outcome. If all states experienced roughly equivalent increases in all-cause mortality, then the variables that differed across states were not causal drivers of mortality. The universal mechanism that operated everywhere — healthcare system disruption, delayed diagnoses, deferred care, social isolation — was the commonality. The response itself, not the virus, was the driver of excess mortality.
South Dakota was the natural experiment that exposed every COVID public health claim in sequence: “Lockdowns Save Lives,” “Without Lockdowns, Hospitals Will Be Overwhelmed,” “COVID-19 is Highly Transmissible — Everyone Will Get It,” “COVID-19 is Exceptionally Deadly,” “Mass Testing and Contact Tracing Are Essential,” and “We Need to Vaccinate Our Way Out of This.”
The Sturgis Rally, with approximately 462,000 vehicles entering the city over 10 days, resulted in only 649 documented cases — a 0.14% attack rate, as verified by the CDC’s MMWR study.
But while epidemiologists debated whether Sturgis caused 124 or 260,000 cases, people lived their lives. In South Dakota, businesses stayed open. Schools remained open. Social connections continued. Children saw their friends. Older people weren’t isolated. Communities made their own decisions about risk.
In North Dakota, restaurants operated at 50% capacity. Event venues were capped at 25%. Masks were mandated. People complied, hoped, and waited for the restrictions to end.
Both states experienced identical mortality curves that peaked and declined almost simultaneously. The demographic-adjusted difference between them was approximately 107 deaths across 1.67 million people. The “worst state” rankings that placed them near the bottom reflected pre-existing health vulnerabilities in Native American populations and comorbidity burdens, not policy failure.
Ignoring all the COVID confounders, where would you rather have lived? That is a question about human welfare, the only measurement that ultimately matters, and the one that disappeared entirely from the COVID story without debate, except in South Dakota.
For those who think the Dakotas are too sparsely populated or remote for comparison, and who think human society has a sustained capacity to learn, a look at the 1918 influenza pandemic may change their mind.
From the South Dakota State Historical Society archives, Matthew Reitzel, manuscript archivist: on 17 September 1918, Mrs Arthur Nielson of Hot Springs received word that her brother had died while serving in Cambridge, Massachusetts. “He died of the new disease, Spanish Influenza, and was only sick three days.” He became one of the first documented South Dakota casualties of the 1918 flu pandemic.
Reports indicated that approximately one-fifth of the world’s population contracted the Spanish flu over two years. Deaths worldwide ranged from 25 to 50 million people; approximately 675,000 Americans died of the flu in 1918. In December 1917, the South Dakota Division of Vital Statistics recorded only 54 flu-related deaths — influenza ranked 20th of 189 causes of death. By December 1918, flu deaths skyrocketed to 1,847, making influenza the number one killer of South Dakotans for the next two years, accounting for 28% of total deaths (6,728) in 1918 — the vast majority occurring in just three months from October.
Throughout the state, churches, theatres, schools, pool halls, and other public gathering places were closed indefinitely. In Rapid City, the Home Guard roamed the streets fining and arresting people for violating sanitation laws. A police officer was himself arrested by the Home Guard for violating the anti-spitting ordinance and paid the customary $6 fine. In some cities, a doctor’s note was required as proof of full recovery to walk in public. “It would be safe to say,” wrote Reitzel, “that the state went through a period of organised chaos.” Despite all these measures, deaths continued throughout 1919 (700 deaths, 14% of total) and 1920 (551 deaths, 10% of total).
Matthew Reitzel’s closing observation, offered in 2005, reads differently today than it did then: “I believe medicine has come a long way since 1918.”
A long way since 1918?
Perhaps not as far as we think.
ENDS

You can purchase Dr McConville’s book HERE.
Related articles:
Comments
Nothing yet. Say the first thing.
Sign in to join the conversation.