
There is a moment in every data science project where the tutorial ends, and the work begins. The notebook runs, the accuracy looks good, and then someone asks a question it cannot answer. Why did the coefficient come out at twelve hundred? Why does the model score 0.95 offline and 0.60 in production? Why did the revenue number double overnight after we added a join? Why does the chart say one thing and the stratified table say the opposite?
Every one of those questions has a precise answer, and every one of those answers lives in the six libraries this book covers. Not in their exotic corners, either. In the parts everyone uses, and few people examine: what an array actually is in memory, what a merge does when a key repeats, what a bar chart claims when its axis does not start at zero, what a Pipeline prevents that careful discipline does not.
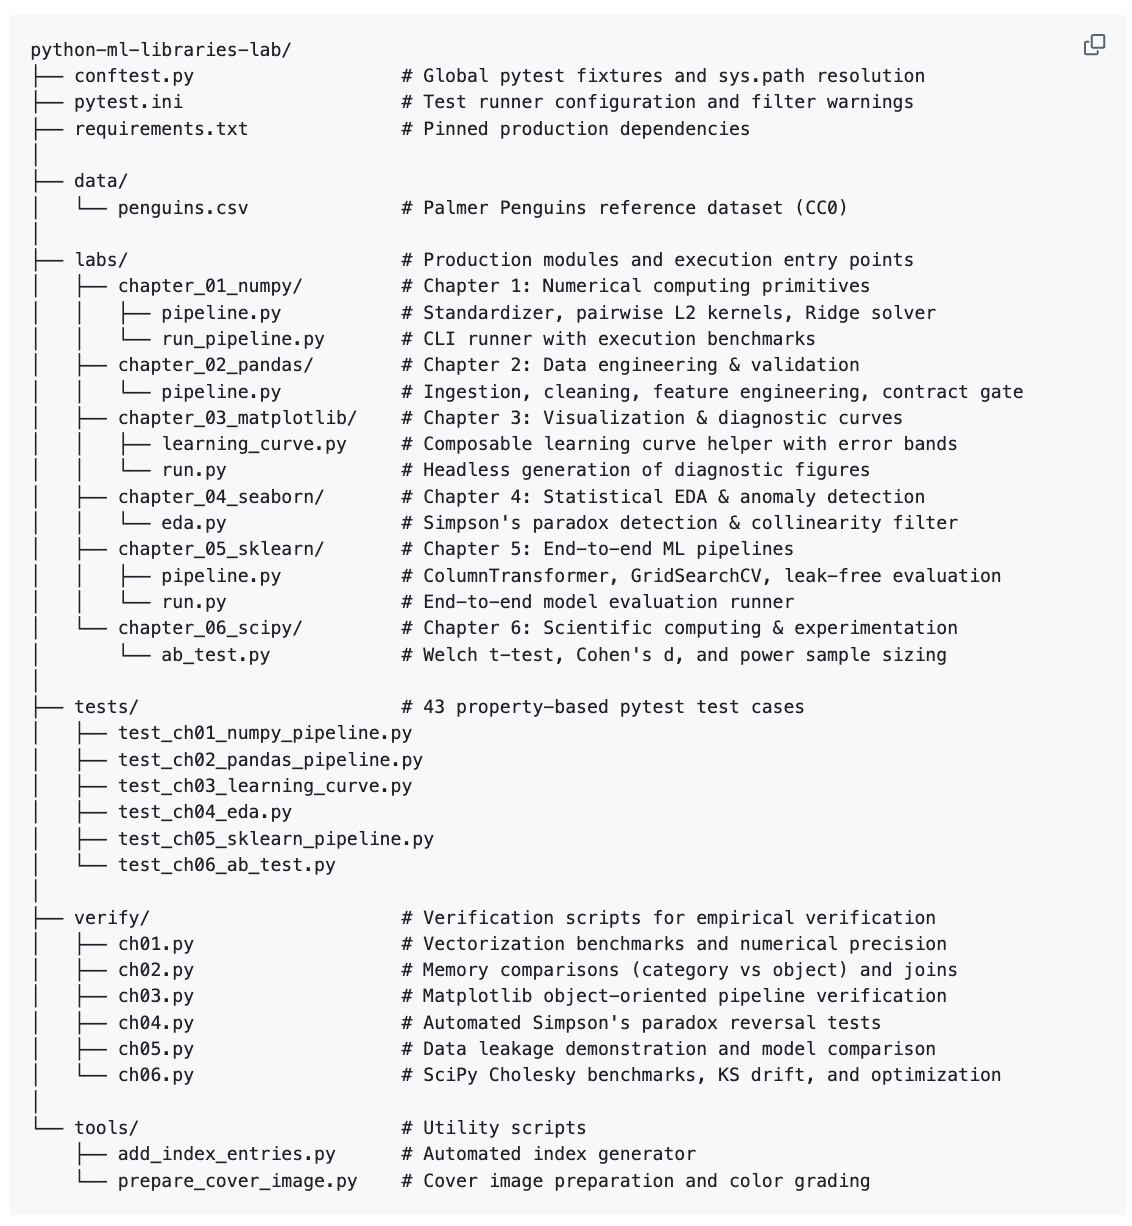
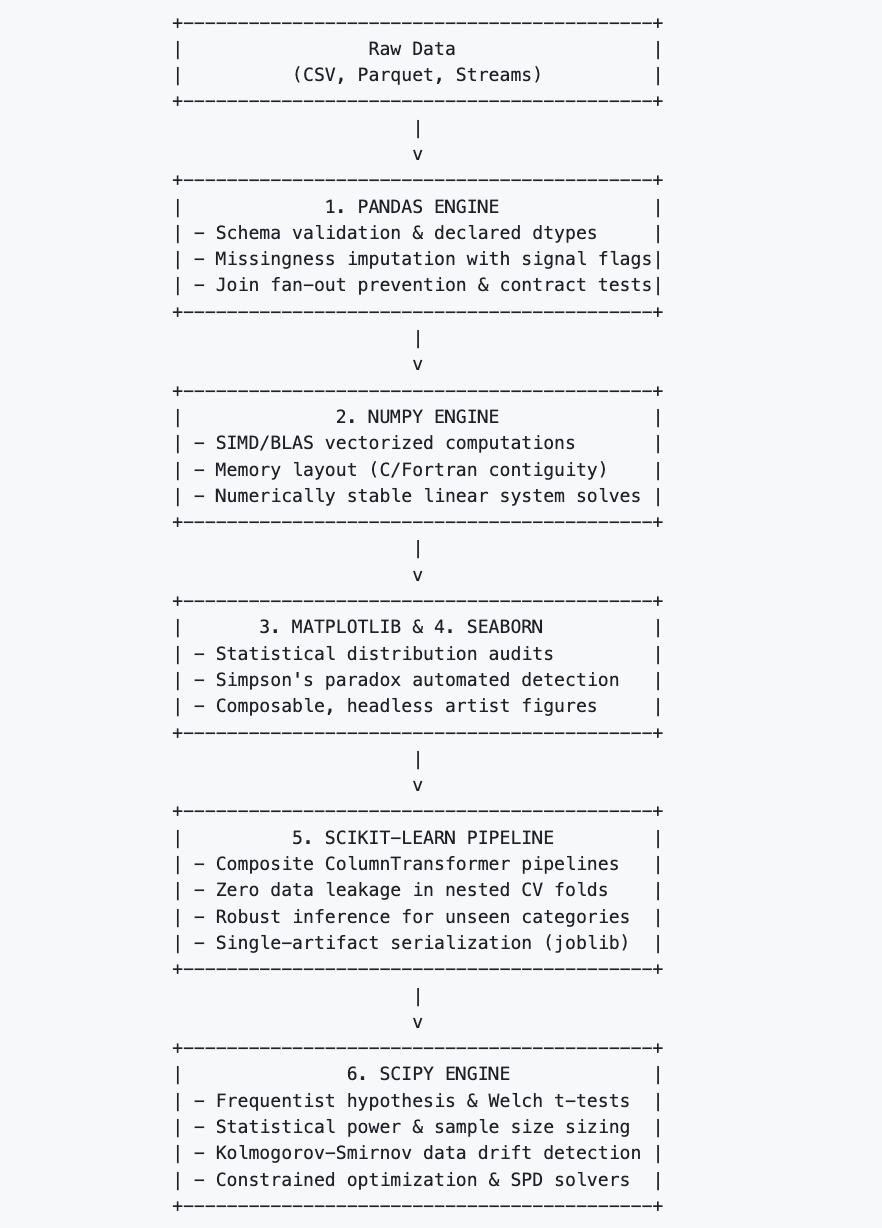
This book takes those six libraries in the order a real project meets them, and it treats each one as an engineering subject rather than an API surface. Pandas loads and cleans. NumPy computes. Matplotlib and Seaborn show you what you have before you model it. Scikit-learn trains and evaluates. SciPy tells you whether the difference you found is real and optimizes whatever scikit-learn does not cover. Each chapter closes with a lab, a debugging playbook, a cheat sheet, and five interview-grade questions answered at the depth a senior interviewer actually reaches. A bonus chapter then works through fifty rapid-fire questions, the ones a screening call opens with, so you can rehearse the short answers as well as the long ones.
Book preview: preview
Apply coupon code below 100% FREE for paid subscribers 👇👇👇
Book a call with us, a high-impact consultation for engineers serious about landing top AI, ML, RAG Engineering, GenAI, and MLOps roles. Book a call
Premium e-book: premium guide

Repository link FREE: github link
What is NumPy, and why is it faster than Python lists?
What is an ndarray?
What is the difference between a Python list and a NumPy array?
Explain vectorization in NumPy.
What is broadcasting? Give an example.
What is the difference between reshape(), resize(), and flatten()?
What is the difference between np.array(), np.asarray(), and np.zeros()?
How do you perform matrix multiplication in NumPy?
What is the difference between element-wise multiplication * and matrix multiplication @?
How do you handle missing or NaN values in a NumPy array?
What is the difference between a Pandas Series and DataFrame?
What is the difference between loc[] and iloc[]?
How do you handle missing values using Pandas?
What is the difference between dropna() and fillna()?
How do you merge two DataFrames?
What is the difference between merge(), join(), and concat()?
How does groupby() work?
What is the difference between apply(), map(), and applymap() or DataFrame.map()?
How do you identify and remove duplicate rows?
How would you optimize Pandas’ performance when working with a very large dataset?
What is Matplotlib, and what is it used for?
What is the difference between the pyplot interface and the object-oriented interface?
What is the difference between Figure and Axes?
How do you create multiple plots using subplots()?
How do you customize titles, labels, legends, and gridlines?
What chart types are most commonly used in data analysis?
How do you save a Matplotlib visualization?
What is Seaborn, and how is it different from Matplotlib?
What is the difference between sns.histplot(), sns.kdeplot(), and sns.displot()?
How do you create a correlation heatmap?
What is the difference between a box plot and a violin plot?
What are FacetGrid and categorical plots used for?
How do you visualize relationships between multiple variables using Seaborn?
What is Scikit-learn, and what problems does it solve?
What is the difference between supervised and unsupervised learning?
What is the difference between fit(), transform(), and fit_transform()?
What is the purpose of train_test_split()?
Why is feature scaling important?
What is the difference between StandardScaler and MinMaxScaler?
What is cross-validation, and why is it important?
What is the difference between overfitting and underfitting?
What is the bias-variance tradeoff?
What is a Scikit-learn Pipeline, and why should you use one?
How do you handle categorical features using OneHotEncoder and LabelEncoder?
What are precision, recall, F1-score, and ROC-AUC?
What is SciPy, and how is it different from NumPy?
What is scipy.optimize it used for?
How do you perform statistical hypothesis testing with scipy.stats?
What is the difference between a t-test, chi-square test, and ANOVA?
How do you perform numerical integration and interpolation using SciPy?
If you are preparing for a Data Analyst, Data Scientist, ML Engineer, or AI Engineer interview, focus especially on:
↳ NumPy broadcasting and vectorization
↳ Pandas merge, groupby, apply, and missing data
↳ loc vs iloc
↳ Data visualization and choosing the correct chart
↳ fit, transform, and fit_transform
↳ Feature scaling and data leakage
↳ Cross-validation
↳ Overfitting and underfitting
↳ Precision, recall, F1-score, and ROC-AUC
↳ Scikit-learn Pipelines
↳ Statistical hypothesis testing
Comments
Nothing yet. Say the first thing.
Sign in to join the conversation.