
BTC HISTORY IS STARTING TO REPEAT 📈
Bitcoin loves repeating history.
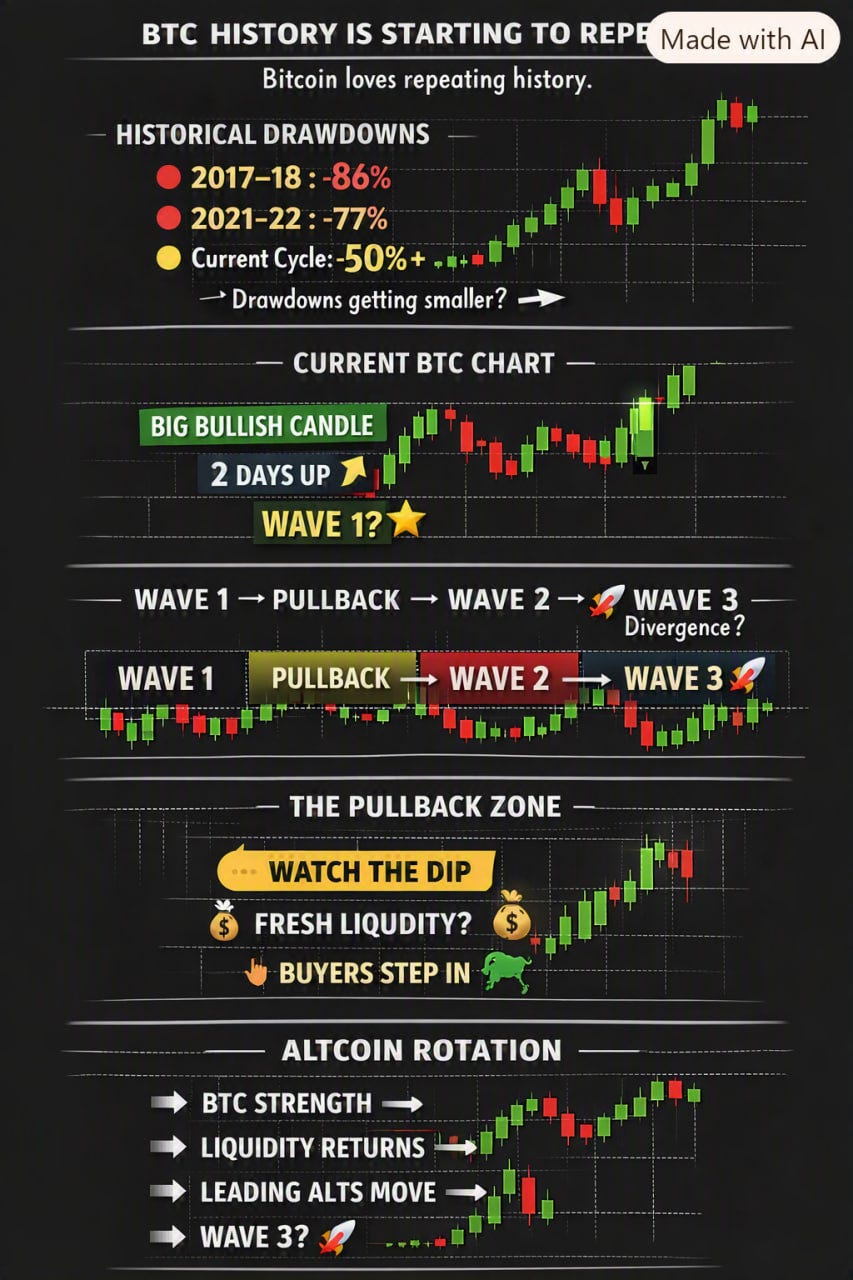
HISTORICAL DRAWDOWNS
LABEL ON CHART:
🔴 2017–18: -84%
🔴 2021–22: -77%
🟡 Current Cycle: -50%+
➡️ “Drawdowns getting smaller?”
CURRENT BTC CHART
🟢 “BIG BULLISH CANDLE”
⬆️ “2 DAYS UP”
⭐️ “WAVE 1?”
If you follow the 5-wave framework, this could be Wave 1.
WAVE STRUCTURE
WAVE 1 → PULLBACK → WAVE 2 → 🚀 WAVE 3
The next phase could bring divergence — bulls and bears fighting for control while volatility cools down.
THE PULLBACK ZONE
🟡 “WATCH THE DIP”
💰 “FRESH LIQUIDITY?”
🐂 “BUYERS STEP IN”
If BTC pulls back and holds, fresh capital could return from gold, stocks and the sidelines.
Then watch the on-chain market.
ALTCOIN ROTATION
➡️ BTC STRENGTH
➡️ LIQUIDITY RETURNS
➡️ LEADING ALTS MOVE
➡️ WAVE 3? 🚀
Wave 2 = volatility + opportunity.
Wave 3 = potentially the real expansion.
My take: BTC may be entering a new bullish phase.
Don't try to trade every candle.
WATCH THE CHART. WATCH LIQUIDITY. WATCH ON-CHAIN ACTIVITY.
Historical patterns are a framework, not a guarantee. DYOR
.
No posts
Comments
Nothing yet. Say the first thing.
Sign in to join the conversation.