
How Derivatives Distort the Spot Market
Series: Decision Architecture for Bitcoin
Part: 7 of 9
Series roadmap:
Why Most Traders Misread SignalsWhich Metrics Matter FirstHow to Read Conflicting SignalsWhen Macro Breaks a Clean On-Chain SetupWhere the Real Pain for Holders SitsHow to Read Flow Signals Without the MythsHow Derivatives Distort the Spot Market ← you are here
How to Compress 20 Signals Into One Verdict
Why Even Good Signals Can Lose Money
What you will get from this lesson:
You will understand why the derivatives layer can temporarily move price against the on-chain structure
You will get the Leverage Context Matrix - a two-axis map showing who pays and whether fuel is accumulating, turning funding and Open Interest into a meaningful conclusion
You will learn to read Open Interest as a fuel tank, not as an indicator of market health
You will learn why the neutral funding baseline is not zero and how that changes the way “positive” funding should be read
You will break down the October 10, 2025 cascade and the three-month February-April 2026 divergence using real numbers
You will read derivatives using data from July 15, 2026 and assess the role leverage played in the rebound from $58.6K
DECISION QUESTION
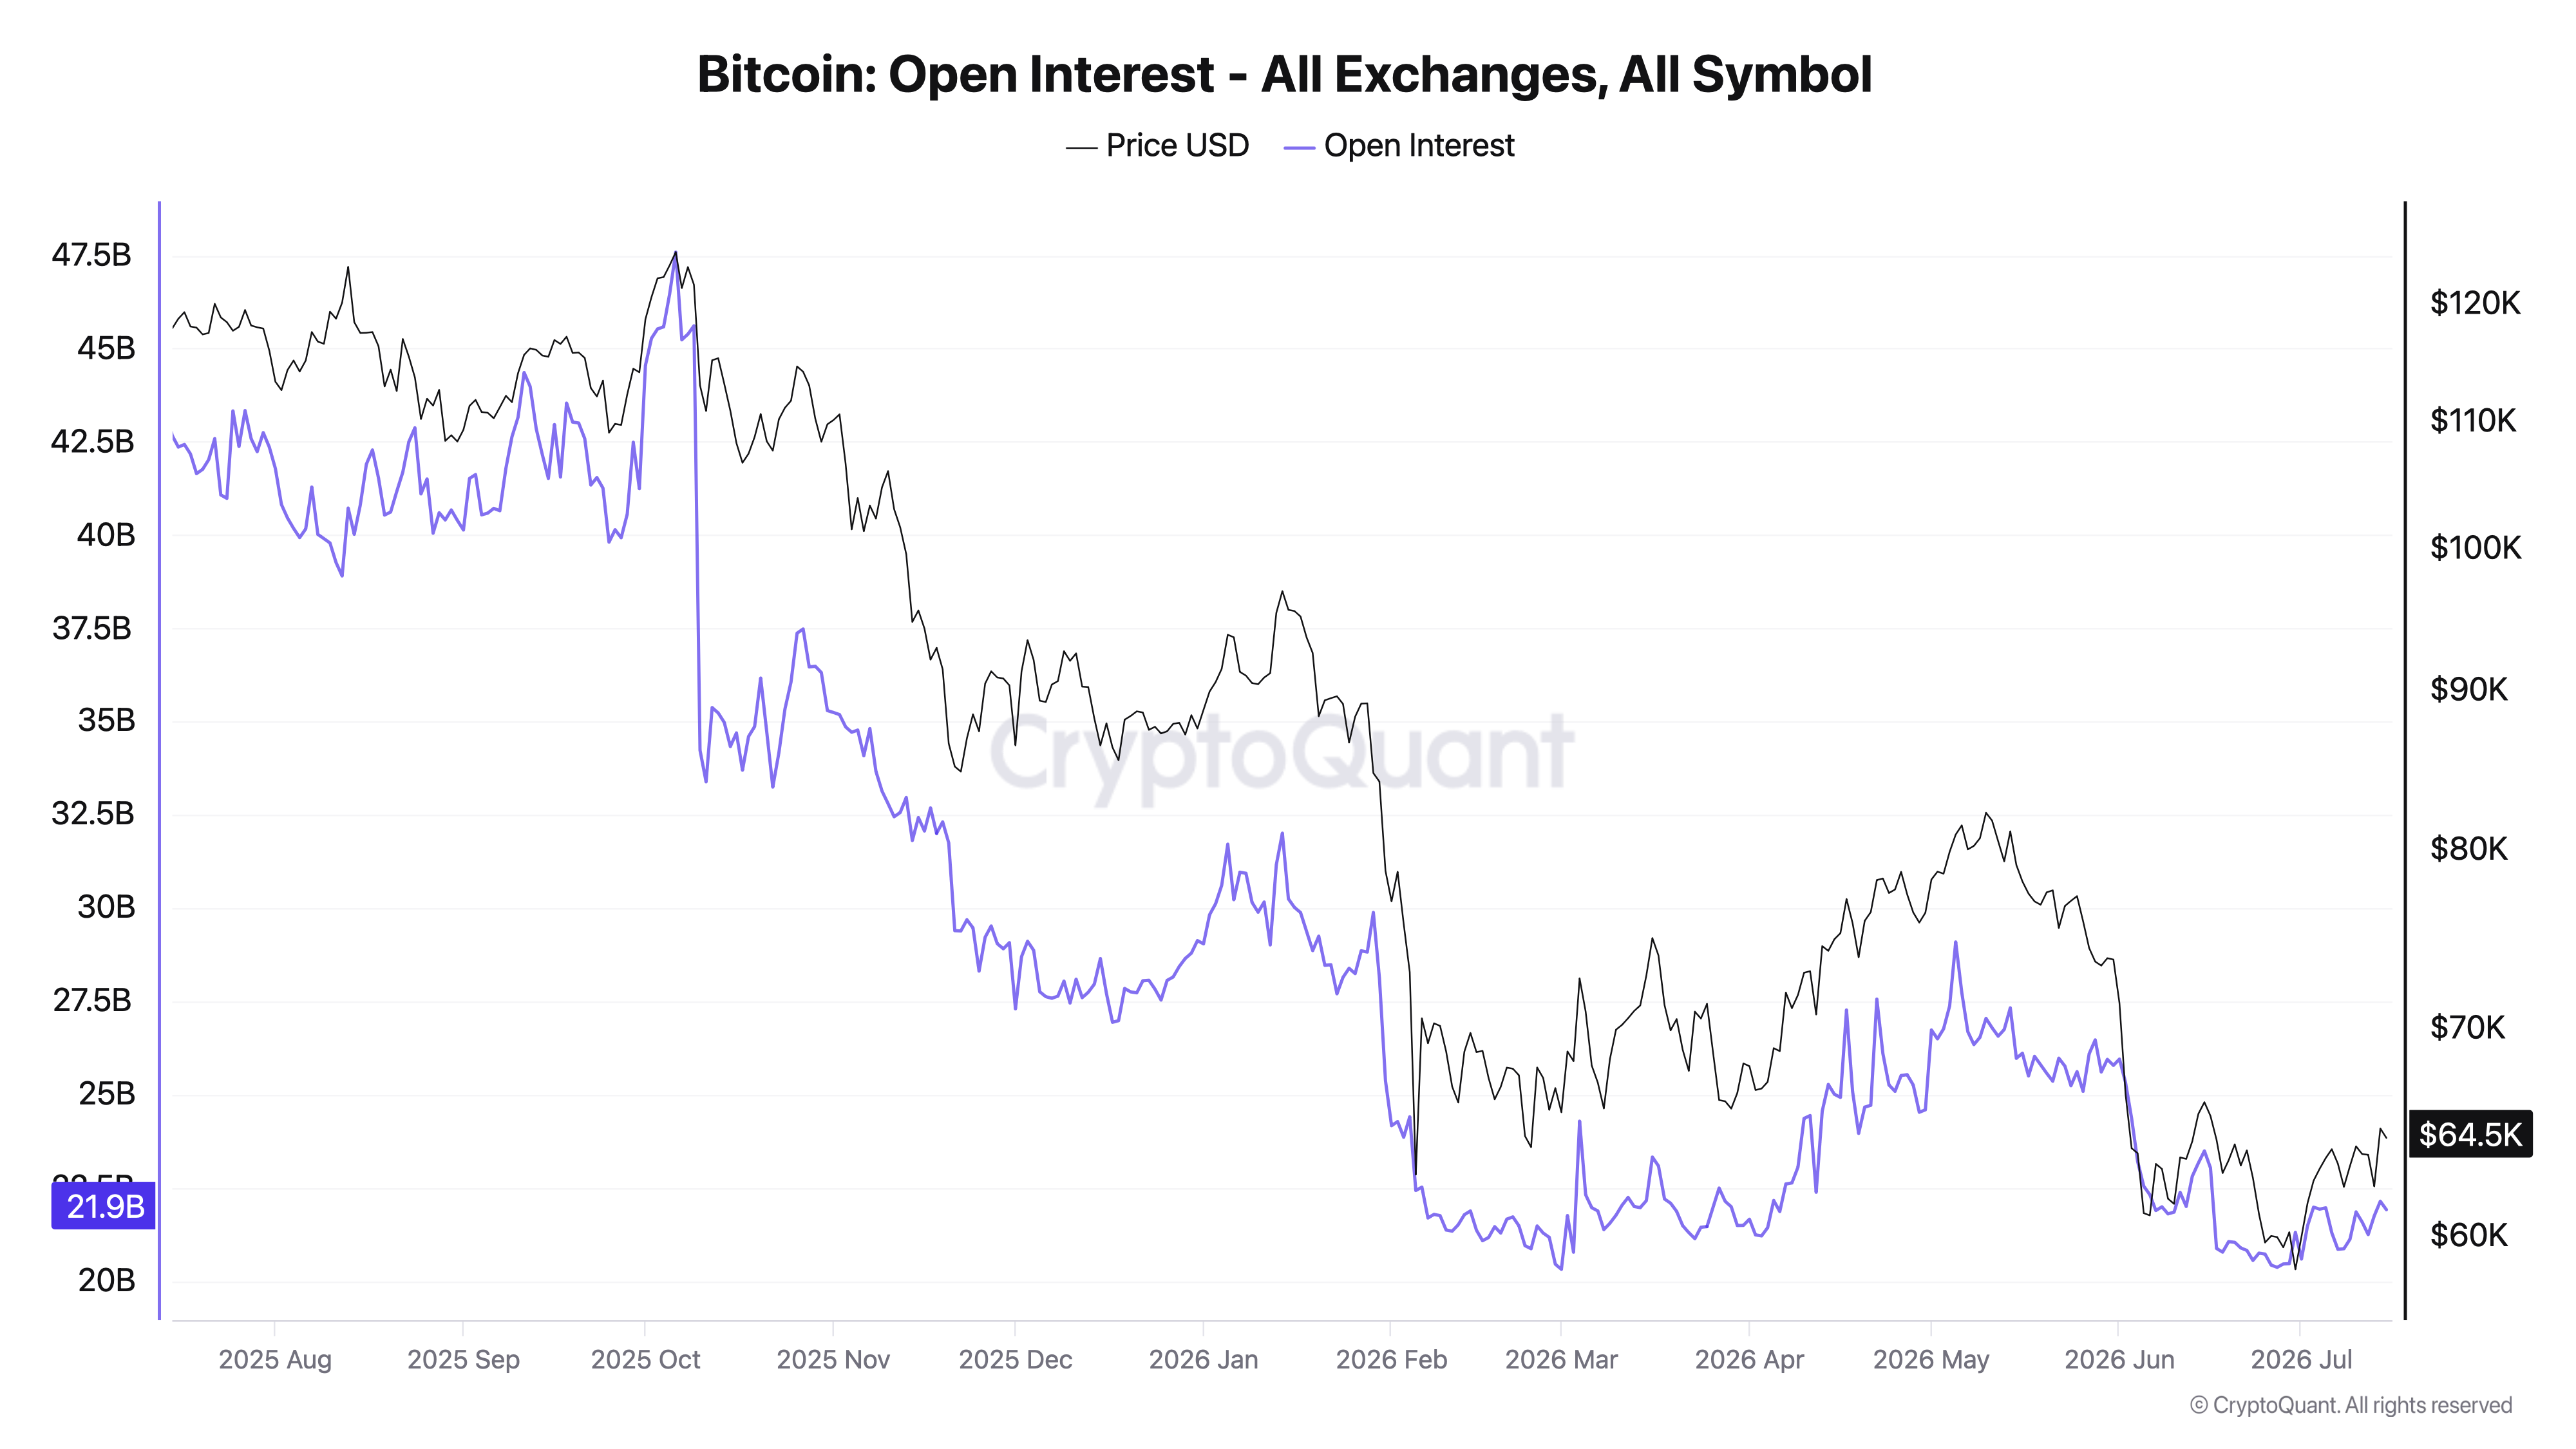
Chart: Bitcoin: Open Interest - All Exchanges, All Symbol (CryptoQuant)
On-chain data points to stress: coins are flowing onto exchanges, Coinbase Premium is negative, and stablecoin liquidity is drying up. Yet price is moving higher. Which side is right? And how can we tell whether the move is funded by spot demand or borrowed money?
In Part 6, we built the Flow Context Matrix and read the flow using July 1 data: BTC at $58,600, coin inflows in a stress regime, an elevated whale ratio, deeply negative Coinbase Premium, and shrinking dry powder. The conclusion was cautious: as long as price held the Aggregate RP near $54K, inflows under stress should be read as seller exhaustion.
Two weeks have passed. Price did not break $54K. Instead, it rebounded and is now trading near $64.5K. The spot structure did not show a comparable improvement. That means part of the impulse has to be traced to the derivatives layer.
That layer is the focus of today’s issue. Leverage sits on top of the spot market and can temporarily overpower its signal. It does not cancel the underlying structure. It temporarily distorts how that structure is expressed.
TL;DR
During liquidation events, derivatives move price through forced execution rather than new demand. A spot buyer clicks “buy” because they want to. A liquidation happens because it has to. To the order book, both appear as the same market buy, but their economic meaning is different: the first reflects voluntary demand, while the second is a forced close caused by insufficient margin.
This leads to the main skill covered in this issue: do not read derivatives as a directional signal. Read them as fuel. Funding shows who is paying to hold a position. Open Interest shows how many obligations have accumulated. Liquidations show that the fuel is burning right now.
A move amplified by leverage can run against the underlying structure until the supply of forced orders is exhausted. Once that happens, the derivatives impulse weakens and spot becomes the dominant force again. The analyst’s job is not to argue with such a move, but to measure how much fuel it has left.
Key takeaways:
During liquidation events, derivatives move price through forced execution, not new demand
Open Interest is not an indicator of market health. It is the size of the fuel tank: peak OI means maximum potential risk, not maximum strength
The neutral funding baseline is not zero, but roughly 0.01% every 8 hours - a mechanical exchange setting, not a market consensus
Negative funding is not a bearish signal. It tells you that shorts are paying to hold their positions
Leverage can move price against the underlying structure, but only while the fuel is burning
1. Why the Mistake Happens
1.1 The Typical Mistake
An analyst sees Open Interest rising alongside price and concludes: “capital is entering the market, interest is growing, and the move is confirmed.” Then they see negative funding and conclude: “the market is bearish, shorts are in control, expect further downside.”
Both conclusions treat a derivatives metric as a sentiment indicator. This is a category error. Funding and OI do not measure sentiment. They measure positioning and obligations.
1.2 Why the Mistake Feels Logical
Because traders borrow their intuition from the spot market. In spot, higher volume means more real capital changing hands. It seems natural to assume that rising OI in derivatives also means more money is entering the market.
But OI is not capital. It is the notional value of open obligations, and every contract has two sides: every long has a corresponding short. Rising OI does not mean someone bought more than someone else sold. It means more pairs of counterparties are now obligated to settle. More OI does not mean more conviction. It means more forced orders in the future.
Funding creates the same trap. Negative funding is emotionally interpreted as “the bears are winning.” In reality, it only means that shorts are paying longs for the right to keep their positions open. In other words, the short side is carrying the cost. This is not a forecast of lower prices. It is a description of who will suffer if the market moves against them.
1.3 How It Breaks the Decision Process
When an analyst reads derivatives as sentiment, they repeatedly make two opposite mistakes.
They treat peak OI as confirmation of strength and add exposure precisely when the fuel tank is full and any shock can trigger a cascade. They also treat negative funding as a bearish signal and short precisely when the short side is crowded and vulnerable to a squeeze.
Both mistakes come from the same belief: that a derivatives metric describes what the market wants. In reality, it describes what the market is obligated to do.
Comments
Nothing yet. Say the first thing.
Sign in to join the conversation.