
Series: Decision Architecture for Bitcoin
Part: 8 of 9
Series roadmap:
Why traders misread signalsWhich metrics matter and which misleadHow to read conflicting signalsWhen macro breaks a clean on-chain setupWhere the real pain of holders livesHow to read flow signals without mythsHow derivatives distort the spot marketHow to compress 20 signals into one verdict ← you are here
Why even good signals lose money
What you will get from this lesson:
You will understand why the seven market layers almost always say different things and why this is normal, not a failure
You will get the 3-Layer Decision Stack as a compression framework: a way to reduce the entire signal set to three states instead of twenty separate opinions
You will learn to aggregate layers through hierarchy and veto rather than averaging, and understand why averaging destroys edge
You will see that the verdict consists of two separate fields - strategic target exposure and execution status - and why they cannot be collapsed into a single number
You will examine a historical illustration of horizon hierarchy and a complete live run-through of the stack
You will read the live market as of July 29, 2026 across all three layers and see how the current setup produces the verdict “reduced target exposure, entry blocked” while the structure remains constructive
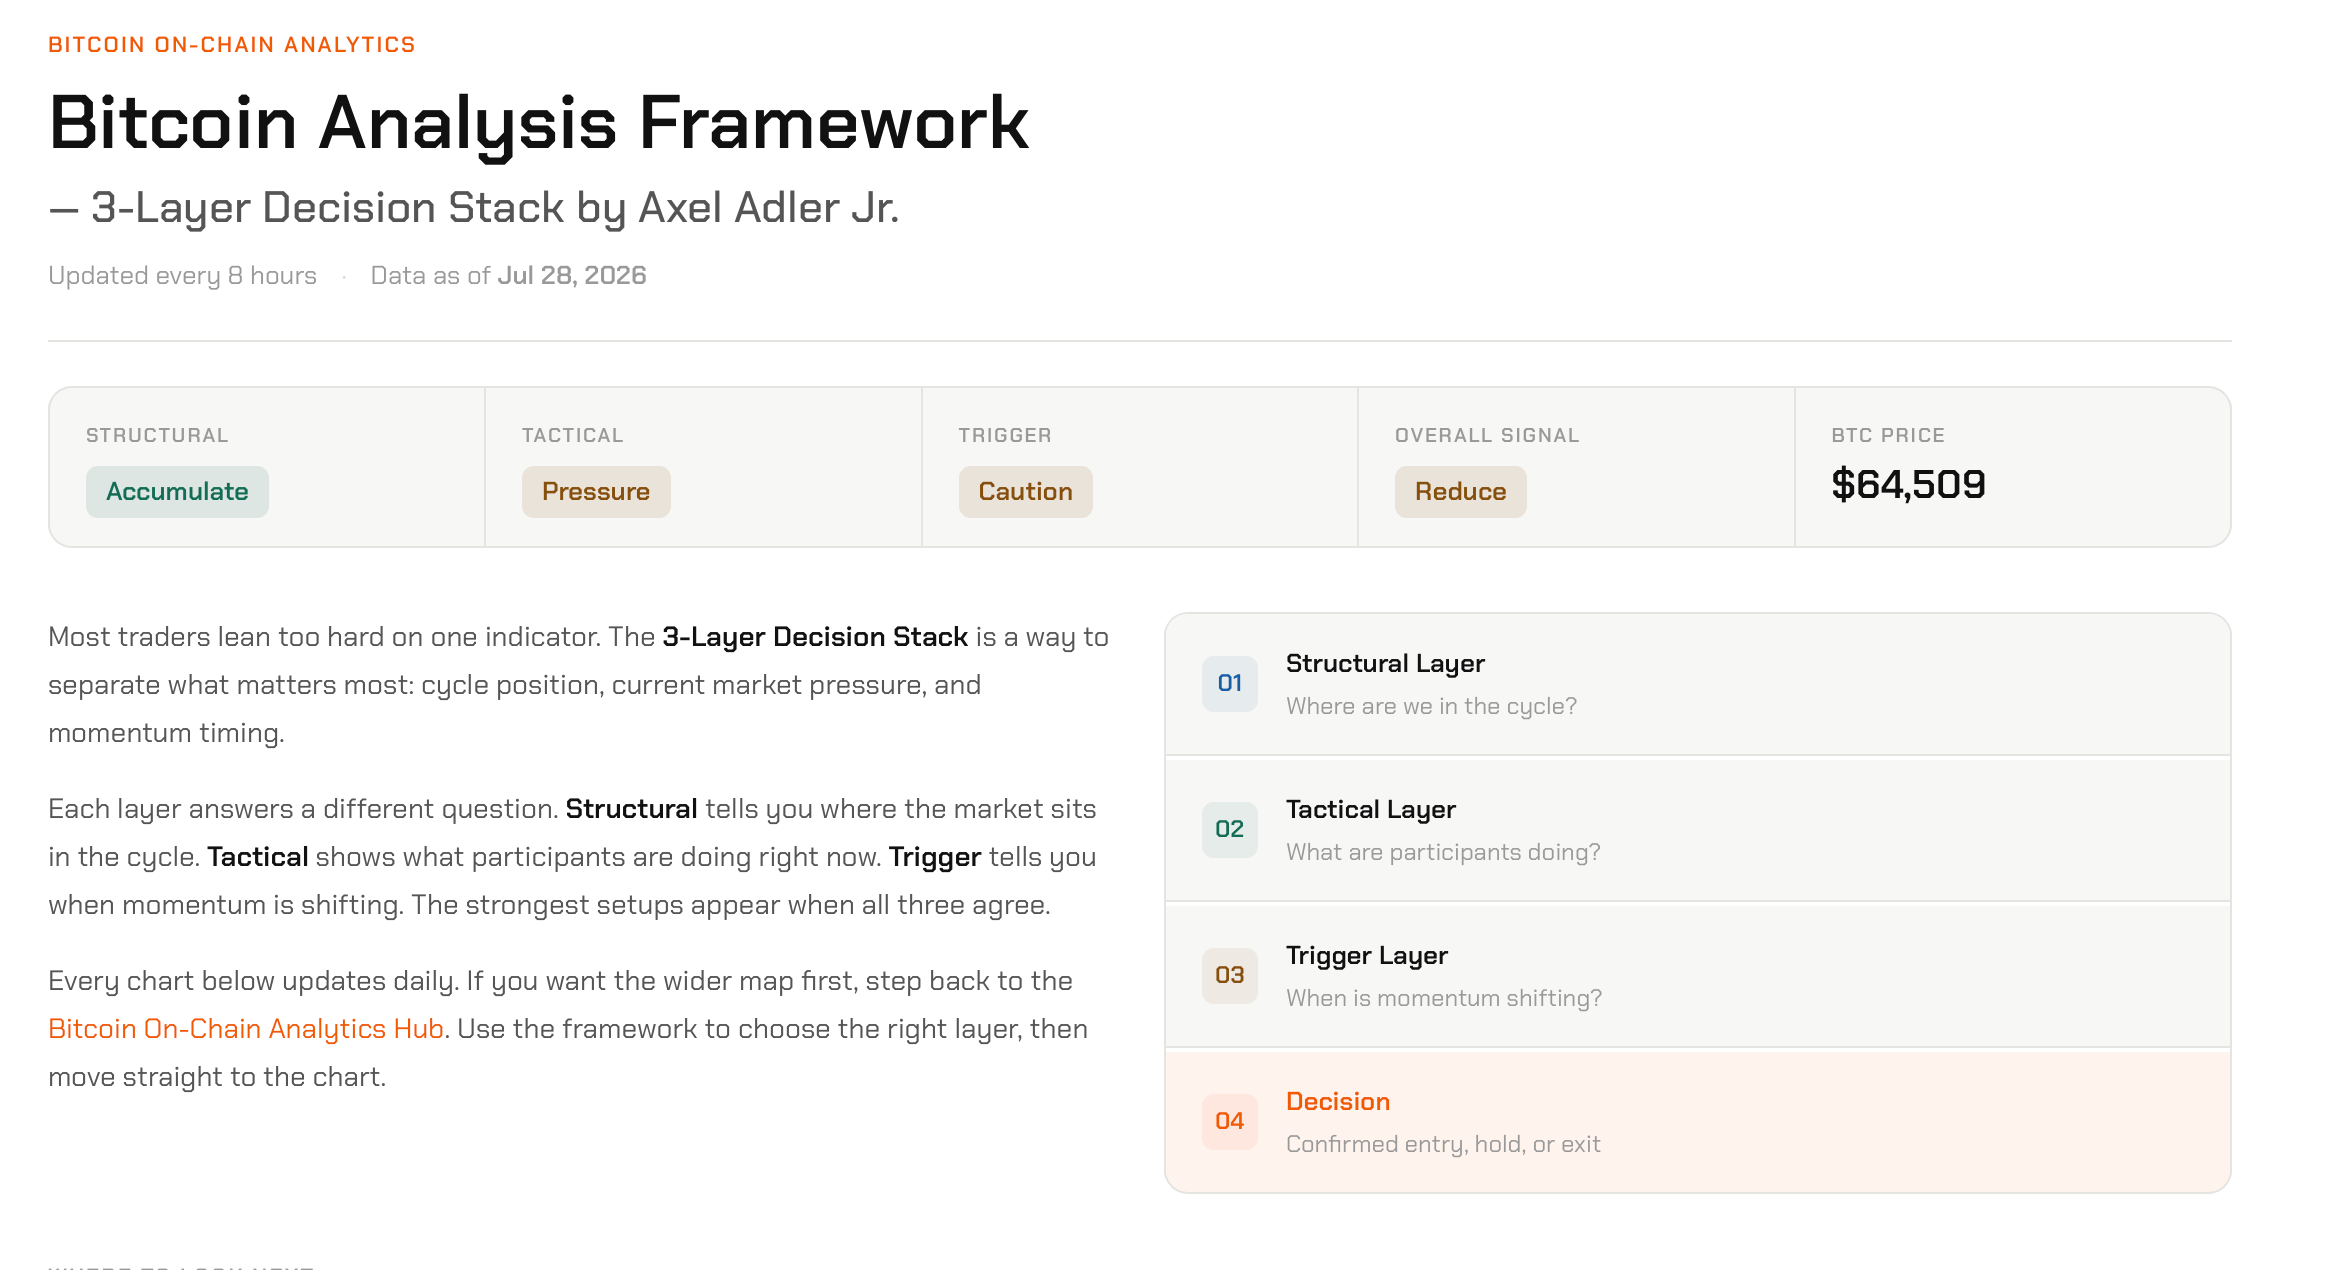
Structure is constructive. Tactical conditions show pressure. The trigger provides no confirmation. The final decision still has to be one. How do we compress three conflicting states into a single verdict without averaging them into meaningless noise or letting the fast layers distort what the slow layers are saying?
In Part 7, we completed the seventh and final layer - derivatives - and learned to read Funding and Open Interest as fuel, not direction. The framework is now complete. Across seven parts, we built seven lenses: structure, metrics, conflicts, macro, cost basis, flows, and derivatives. Each has its own horizon, logic, and limits.
The problem is that in the real market, all seven lenses operate at the same time. They almost never agree. Today, July 29, the cyclical structure looks constructive, tactical conditions show pressure on demand, and the trigger layer provides no confirmation. Three states, three different horizons, one market.
The decision still has to be singular and reproducible. This part is about compression: how to turn twenty signals into three states, then turn those three states into a structured two-field verdict without losing anything important or flattening everything into an average.
Bad analysis looks like a collection of indicators: the analyst lists twenty metrics, half pointing higher and half pointing lower, then concludes that the market is “mixed.” That is not a conclusion. It is a refusal to reach one. Good analysis looks like compression: the same twenty signals are reduced to three states, and those three states are reduced to a verdict.
The key skill in this part is aggregating layers through hierarchy rather than averaging. Averaging starts from the false assumption that all signals are equal and vote with the same weight. They are not. Structure defines the base case. Tactical conditions confirm or challenge participant behavior within that scenario. The trigger deals only with the timing of a new entry.
An analyst opens twenty charts. MVRV is constructive, NUPL is in the fear zone, netflow is negative, Coinbase Premium is deeply negative, Funding is below its baseline, Open Interest is contracting, Puell is in a stress zone, and Fear and Greed shows fear. The analyst lists all of this honestly and counts the results: roughly half the signals look constructive and half look concerning. The conclusion is: “The market is mixed, so we wait for clarity.”
That is not a conclusion. It is averaging disguised as analysis. The analyst has taken signals from different horizons, assigned them equal weight, and produced an average that means nothing.
Because averaging looks objective. It seems fair not to favor any one signal, to weigh all the arguments for and against, and derive a balance. In most fields, averaging reduces noise and is a sensible first step.
But it breaks here because the signals measure different things across different horizons. MVRV describes the market’s position in the cycle over months. Funding shows who is paying for leverage over days. Averaging them is like averaging a patient’s temperature and age: mathematically possible, conceptually meaningless. “Half the signals are bullish” sounds informative, but it answers no decision-making question because it says nothing about which signals are bullish or which horizon they belong to.
Comments
Nothing yet. Say the first thing.
Sign in to join the conversation.