
In the dynamic world of stock trading, investors are constantly seeking tools and indicators to make informed decisions.
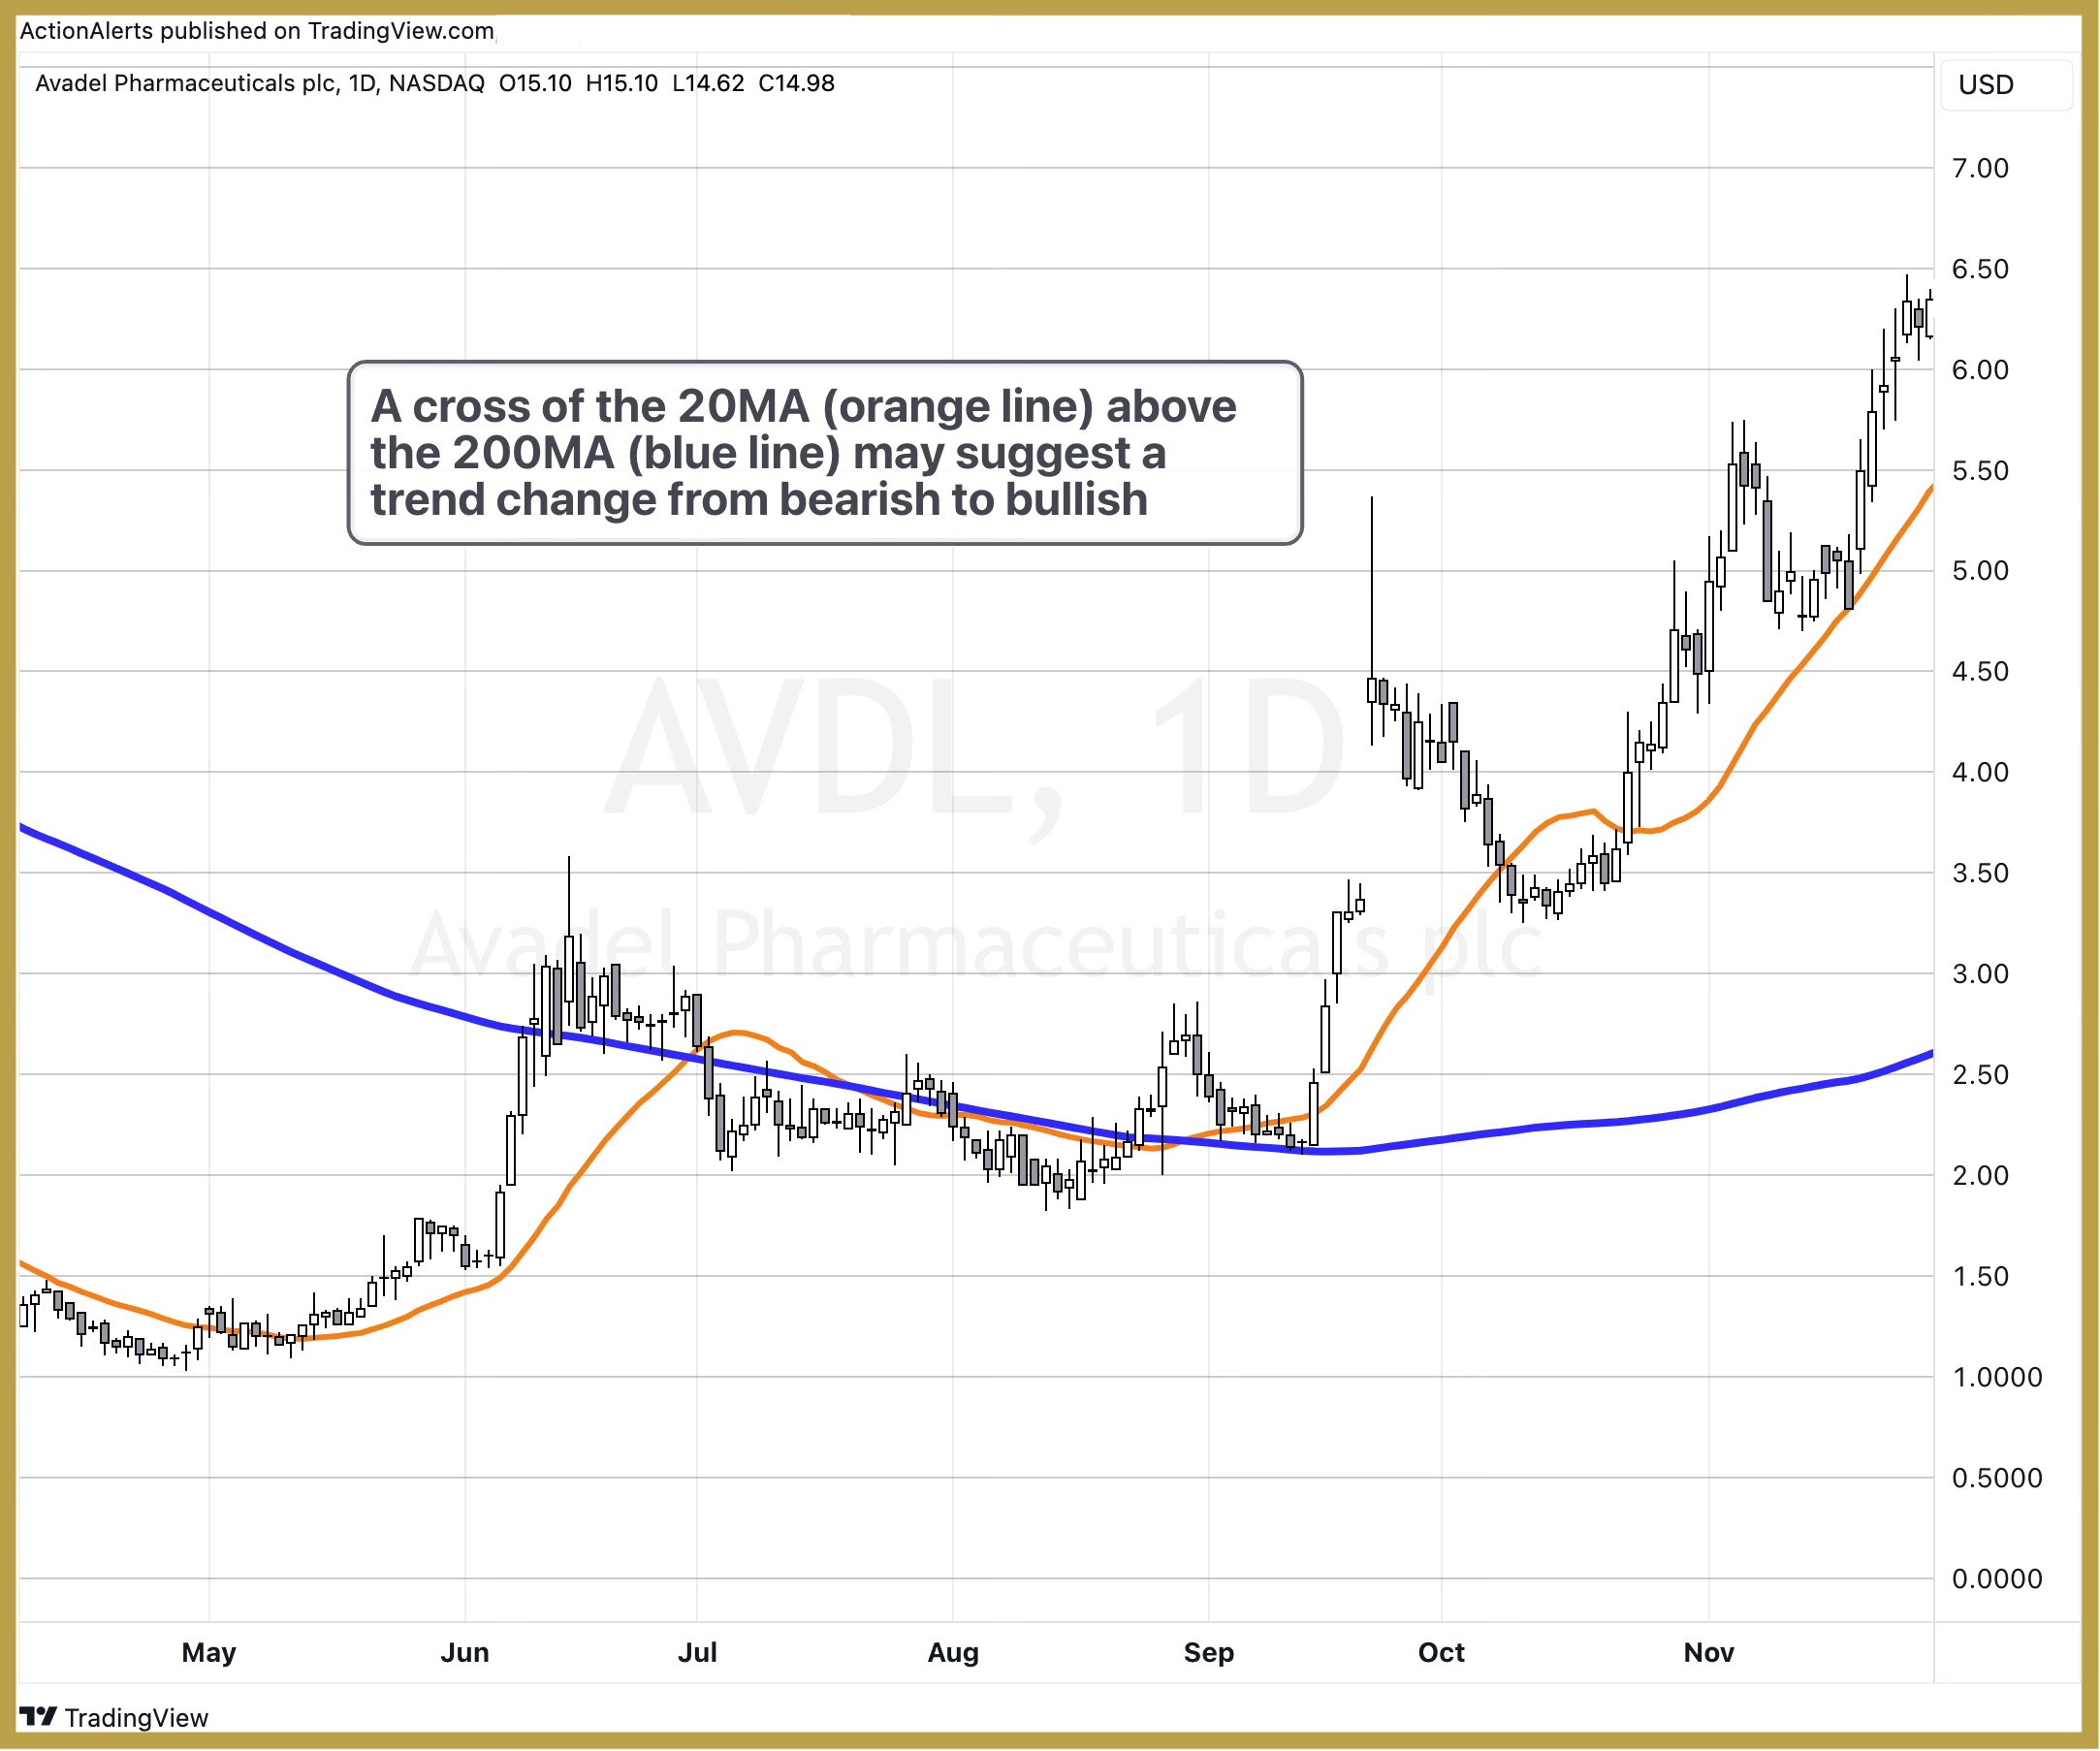
One such technical analysis technique that has gained prominence is the crossover of a stock's 20-day moving average (MA) above its 200-day MA.
This event is not just a mundane data point; it can signal a potential shift in market sentiment and offer a compelling reason to consider a buy order.
In this article, we look at the rationale behind it and see how it can be a valuable tool in your trading arsenal.
Before we plunge into the significance of the 20-day and 200-day moving average crossover, let's grasp the fundamentals of moving averages.
A moving average is a statistical calculation used to analyze data points by creating a series of averages.
In the context of stock trading, it's applied to smooth out price data and identify trends over specific time periods.
The 20-day and 200-day moving averages, as their names suggest, consider the average closing prices of a stock over the preceding 20 and 200 days, respectively.
These moving averages are often represented as lines on a stock chart, providing a visual representation of the stock's historical performance.
The choice of the 20-day and 200-day moving averages is strategic. The 20-day MA is more responsive to short-term price movements, reflecting recent market sentiment.
On the other hand, the 200-day MA is a slower-moving average, offering a broader perspective and smoothing out short-term fluctuations.
When the 20-day MA crosses above the 200-day MA, it generates what is known as a "golden cross."
This event is a bullish signal that indicates a potential shift from a downtrend to an uptrend.
Let's explore the key reasons why this crossover holds significance for investors.
1. Trend Reversal Indication
One of the primary reasons traders pay attention to the golden cross is its ability to signal a potential reversal in the prevailing trend.
The 20-day moving average crossing above the 200-day moving average suggests that recent positive momentum is gaining strength, potentially marking the end of a downtrend.
This reversal indication can be a pivotal moment for investors looking to enter the market at an opportune time.
2. Confirmation of Positive Momentum
The golden cross is not just about signaling a trend reversal; it also confirms the presence of positive momentum in the market.
The 20-day moving average responding faster to price changes reflects the short-term bullish sentiment.
When this short-term momentum aligns with the longer-term trend indicated by the 200-day moving average, it creates a compelling case for sustained upward movement in the stock's price.
3. Increased Confidence Levels
Investors often rely on multiple indicators to strengthen their trading decisions.
The golden cross, being a widely recognized technical analysis pattern, can boost investor confidence.
When the 20-day MA crosses above the 200-day MA and aligns with other bullish indicators, it enhances the conviction of traders considering a buy order.
This increased confidence is vital in the unpredictable world of stock trading.
4. Support from Institutional Investors
Institutional investors, with their substantial market influence, often pay attention to technical patterns like the golden cross.
When such crossovers occur, it can trigger buying activity from institutional players, further fueling the upward momentum.
The support from these large market participants adds weight to the bullish signal generated by the crossover, making it a noteworthy event for individual investors.
5. Entry Point Identification
For traders employing trend-following strategies, the golden cross serves as a valuable tool for identifying potential entry points.
Waiting for the confirmation of the 20-day MA crossing above the 200-day MA allows investors to enter the market with reduced risk.
By entering during a confirmed uptrend, traders position themselves favorably for potential price appreciation.
While the golden cross can be a valuable tool, it's essential to acknowledge that no strategy is foolproof.
Like any technical indicator, the 20-day and 200-day moving average crossover has its limitations and is not immune to false signals.
Investors should exercise caution, conduct thorough research, and consider additional factors before making trading decisions solely based on this pattern.
In the fast-paced world of stock trading, having a reliable strategy is crucial.
The golden cross, signaling the 20-day moving average crossing above the 200-day moving average, is a time-tested and widely recognized pattern.
By understanding the implications of this crossover and incorporating it into your trading toolkit, you can potentially enhance your ability to identify opportune moments for executing buy orders.
As with any investment strategy, diligence, research, and risk management remain paramount.
The golden cross, when used judiciously, can be a valuable ally in navigating the complexities of the stock market.
Get alerted on my private Telegram Channel when stocks are newly qualified:
Comments
Nothing yet. Say the first thing.
Sign in to join the conversation.