

What would it look like if my development workflow, production systems, AI coding agents, deploys, bugs, alerts, and weekly operating feedback all lived inside one observability loop?
That project is called Milhouse.
Milhouse is a local-first observability and operations feedback platform for AI-assisted engineering teams. It watches production apps, deploys, synthetic checks, backend errors, browser errors, development workflows, and AI agent sessions, then turns those signals into feedback that humans and agents can act on.
I originally built Milhouse for my own work: managing live products, shipping with Claude Code and Codex, and keeping a clearer picture of what was really happening across the stack. Now I am migrating it into an open-source project and doing that work in the open.
Public repo: https://github.com/that1guy15/Milhouse-oss
Architecture docs: https://github.com/that1guy15/Milhouse-oss/blob/main/docs/architecture.md
The way I build software has changed.
I am no longer just writing code, running tests, deploying, and checking logs. I am working with AI agents that plan, modify code, run tools, summarize work, miss context, fix bugs, and sometimes confidently declare something complete when the actual product experience says otherwise.
That creates a new operations problem.
Traditional observability tells me what happened in production. It does not tell me why a development loop failed, whether an AI agent missed the original intent, whether a deploy created a product regression, or whether the same workflow mistake has been repeating for three weeks.
Milhouse is my attempt to connect those worlds:
product observability
platform observability
development workflow observability
AI agent observability
team feedback and accountability
The goal is not just dashboards. The goal is a system that helps the team improve every turn.
Milhouse is designed around a few core capabilities.
Milhouse collects signals from live systems:
site canaries
Cloudflare analytics and Worker events
deploy events
GitHub Actions status
backend exceptions
browser exceptions
workflow/job status
uptime and latency checks
The first job is still boring and necessary: tell me whether the product is healthy.
Milhouse is local-first by default.
Events are written to a local JSONL spool before export. That means collection can continue even when ClickHouse, the network, or a provider API is unavailable.
ClickHouse is the default analytical store. I want fast local queries, cheap retention, and enough analytical power to ask useful questions without making a hosted observability bill the center of the architecture.
Hosted ClickHouse can make sense later for team or multi-machine usage, but the default posture is local.
Milhouse is built for AI-assisted engineering. That means observing the development system itself:
Codex sessions
Claude Code sessions
tool failures
repeated validation gaps
missed requirements
stuck loops
postmortem triggers
feedback item status
The point is not to hoard raw transcripts. The point is to extract enough structured signal to answer operational questions:
Did the agent validate the thing it claimed was done?
Did the same class of error happen before?
Did a deploy fix the issue or just move it?
Is the product actually improving?
Is my own prompting contributing to the failure?
Milhouse has two feedback surfaces for agents.
The first is MCP: a read-focused interface agents can query directly. Planned tools include:
`feedback_list`
`feedback_get`
`events_query`
`runs_status`
`health_summary`
`weekly_report_get`
The second is passive repo context. Milhouse can write feedback into a project-local `.milhouse/` directory:
That gives agents useful context even when MCP is unavailable or not configured in a session.
Milhouse also supports the human operating loop:
Telegram alerts for urgent issues
weekly summaries of production and development health
postmortem-style reports
feedback on what the agents can improve
feedback on what I can improve as the operator
This last part matters. AI-assisted development is still a team activity. The human prompt, the planning documents, the task framing, the validation bar, and the agent behavior are all part of the system.
The core Milhouse idea is the feedback loop.
Product teams already have feedback loops. Users encounter issues, support tickets get filed, developers fix bugs, and eventually something ships.
AI-assisted development needs a tighter version of that loop because the development system itself is now partially automated. If an agent repeatedly misses intent, ships unvalidated UI, ignores production errors, or fixes symptoms while missing the root cause, that should become an observable signal.
Milhouse turns those signals into feedback items.
The important part is the final step.
A feedback item is not complete because an agent said “done.” It is complete when Milhouse checks the same class of signal and verifies that the condition improved.
If browser errors created the item, browser errors need to improve.
If stuck builds created the item, build completion needs to improve.
If a `/doh` postmortem created the item because intent was missed, the workflow needs a new test, prompt rule, runbook, or validation step that prevents the same miss from recurring.
That is the difference between a task tracker and an operating system for improvement.
Here is the current high-level architecture from the public repo.
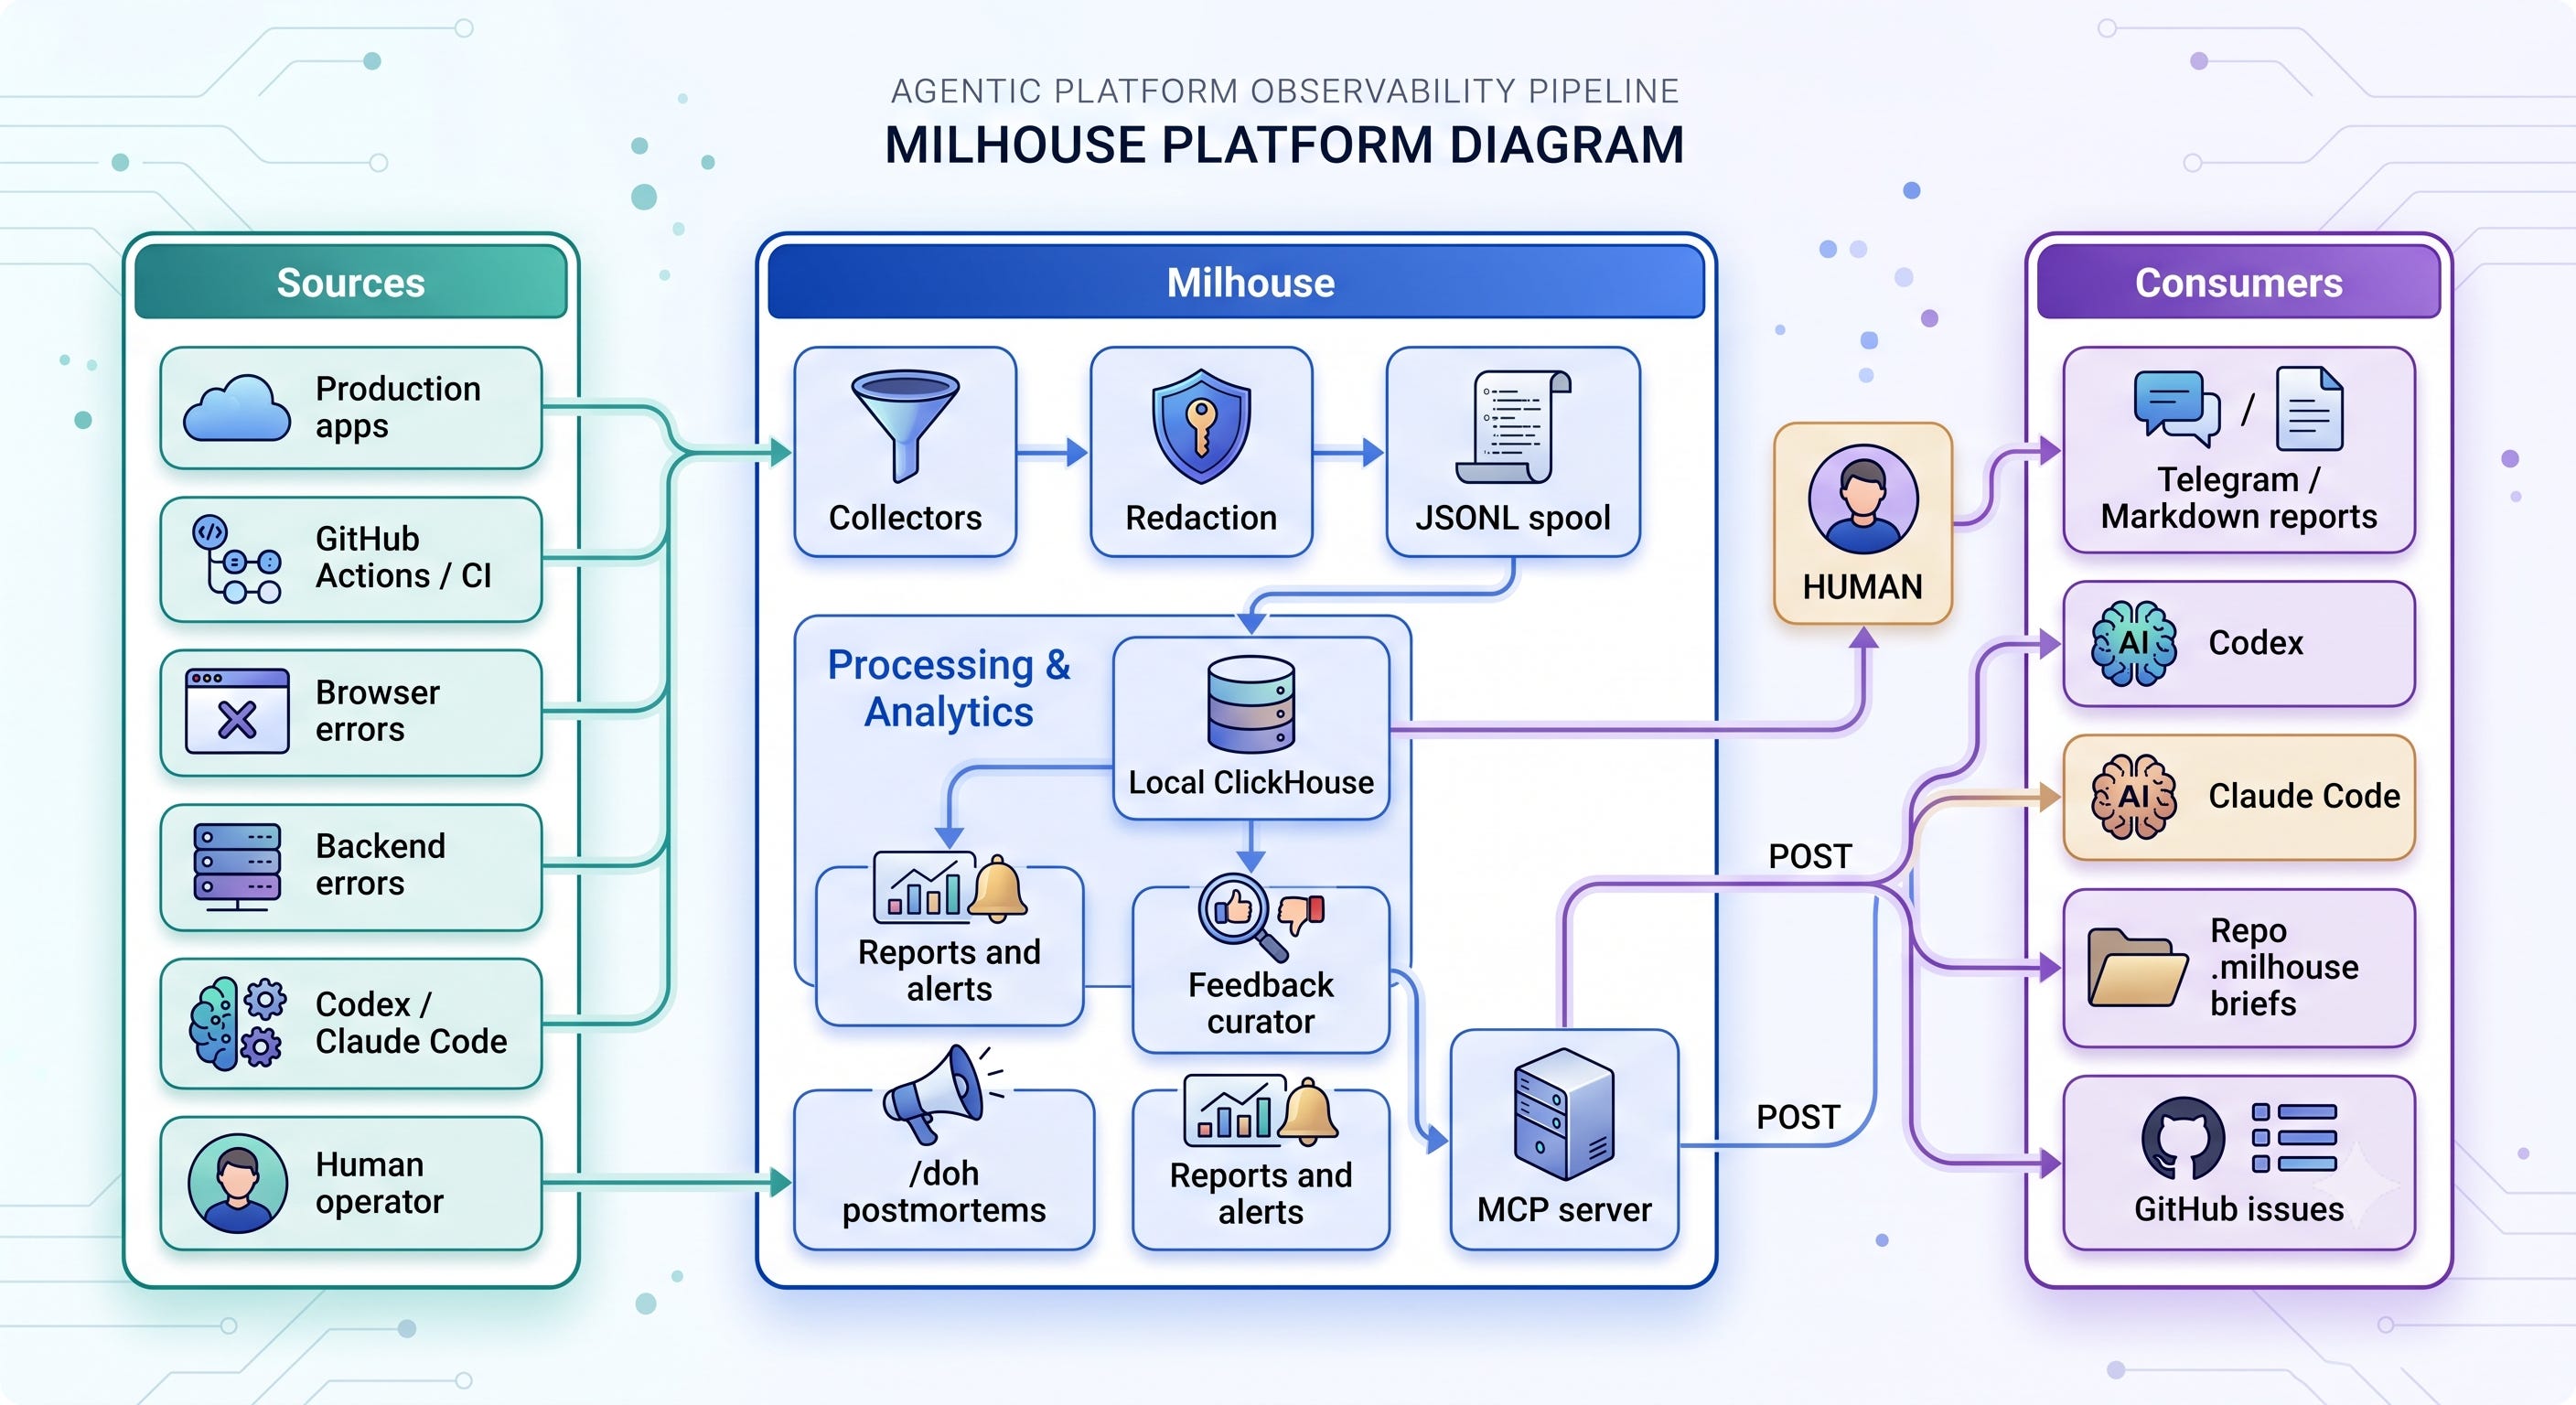
The architecture is intentionally plain.
Collectors ingest events from production systems, developer tools, and AI agents.
The initial collector families are:
site canaries
Cloudflare analytics and Worker events
GitHub Actions deploy events
backend error reports
browser error reports
generic admin/workflow status APIs
Codex session summaries
Claude Code session summaries
feedback outbox files
Each collector should produce normalized events. The long-term goal is provider flexibility: Cloudflare is first-class because that is what I use heavily, but Milhouse should not be a Cloudflare-only project.
Redaction happens before events become useful operational data.
This is especially important for AI workflow observability. Agent sessions can contain prompts, file paths, secrets, user data, customer data, and private implementation details. Milhouse should store structured summaries and bounded evidence by default, not unlimited raw transcripts.
The public project is built around private overlays for exactly this reason:
The open-source repo should be reusable without leaking anyone’s actual operational life.
Every event is written locally before export.
This is one of the design decisions I care about most. Observability systems should not go blind just because the analytical store is down or the network is having a bad day.
The spool gives Milhouse a simple durability layer. Collect first, export when possible, replay later if needed.
ClickHouse is the default local store.
The reason is practical: Milhouse wants analytical queries over time-series-ish event data, and I want it to run locally without turning into a giant platform dependency.
Typical questions Milhouse should answer:
What failed today?
Which deploy introduced errors?
Did browser exceptions increase after the last release?
Which agent sessions ended in tool failure?
Are builds getting stuck?
What feedback items are still unverified?
ClickHouse is a strong fit for that style of work.
The curator turns event patterns into feedback.
That might mean a product feedback item, such as “browser errors increased after checkout deploy.”
It might mean a development workflow item, such as “agents keep marking UI work complete without screenshot validation.”
It might mean an operations item, such as “canary checks pass but backend error reporting is not wired in.”
The curator is where observability turns into action.
MCP is the active interface for agents.
Agents should not need to query ClickHouse directly or reverse-engineer logs. They should be able to ask Milhouse for the current feedback, recent events, run status, and weekly summaries.
The MCP layer is intentionally read-focused first. Write tools should be narrow, explicit, and auditable.
Milhouse sends information back to humans and agents:
Telegram weekly reports
urgent alerts
Markdown reports
repo `.milhouse/` briefs
GitHub issues when configured
MCP query results
The key design decision is that observability should feed the next development session. It should not sit in a dashboard waiting for someone to remember to check it.
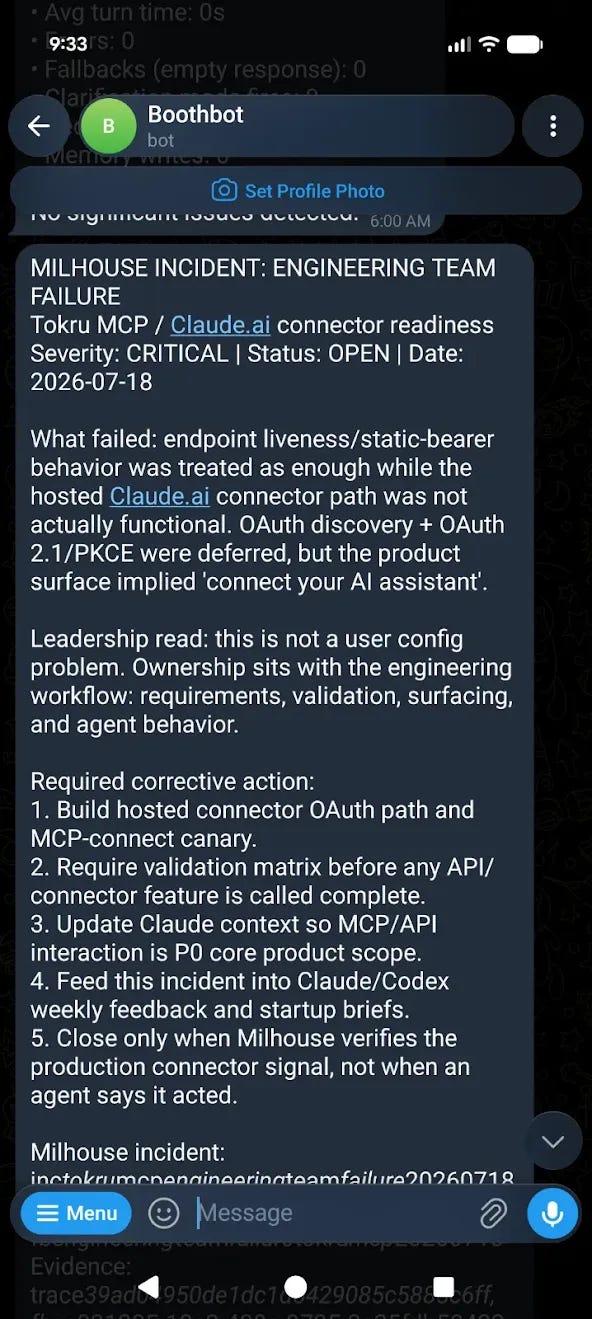
One small but important workflow in Milhouse is `/doh`.
`/doh` means: the previous request or work set missed intent while being treated as complete.
When that happens, Milhouse should create a postmortem across the whole system:
original request
agent actions
project requirements
task status
missing validation
mismatched assumptions
operator ambiguity or scope drift
corrective actions
I like this because it keeps the analysis at the system level.
Sometimes the agent missed something obvious. Sometimes the requirements were unclear. Sometimes I assumed the project context existed when it did not. Sometimes the tests were too weak. Sometimes the workflow rewarded speed over proof.
The point is to learn from the failure instead of just yelling at the tool and moving on. Now I get a report with insights on specific incidents via telegram for review.
The public project is being designed so someone can clone it and get started without inheriting my private config.
The intended flow is:
Then:
The setup script is intentionally conservative. It should:
create a virtual environment
install the package locally
copy example config if missing
prepare ignored local state directories
It should not:
overwrite existing config
install background services automatically
call live provider APIs
require production credentials
write into application repos
That matters because Milhouse is an observability system. The setup experience itself needs to model the privacy and safety posture of the project.
I am open-sourcing Milhouse because I think this pattern is going to matter.
More teams are going to build with AI agents. More teams are going to discover that agent productivity is not just about better prompts or bigger models. It is about the operating loop around the agents.
What did they build?
What did they miss?
What did production say?
What did the deploy say?
What did the user experience say?
What should the next agent session know before it touches the code?
Milhouse is my attempt to make those questions part of the system.
The public repo is still early. It is currently the OSS starter kit and architecture track while the private implementation is being migrated, sanitized, generalized, and tested. I am doing that in the open because I want feedback from people who are thinking about observability, AI-assisted development, operations, and team improvement.
The next work is turning the private implementation into a clean public package:
migrate reusable collectors
generalize private project-specific logic
finish the ClickHouse schema and setup path
harden the MCP interface
expand feedback item workflows
add fixture-based tests
generate agent-friendly docs with OpenWiki or similar tooling
document real-world integration patterns
I want Milhouse to become something a developer can run locally, wire into their projects, and use as the memory and accountability layer for their development system.
Not another dashboard.
Not another place to forget to look.
A feedback loop.
One that watches what happened, remembers what mattered, and helps the next turn go better.
No posts
Comments
Nothing yet. Say the first thing.
Sign in to join the conversation.