
If you have been in the market a while, you’ve perhaps noticed that not every year within a Presidents four-year term performs the same. However, history suggests there are similarities amongst corresponding years within a cycle (i.e…the first year of one President's term versus the first year of another President's term).
While no cycle guarantees future returns, there is a reason why one of the most studied is in fact the U.S. Presidential Cycle.
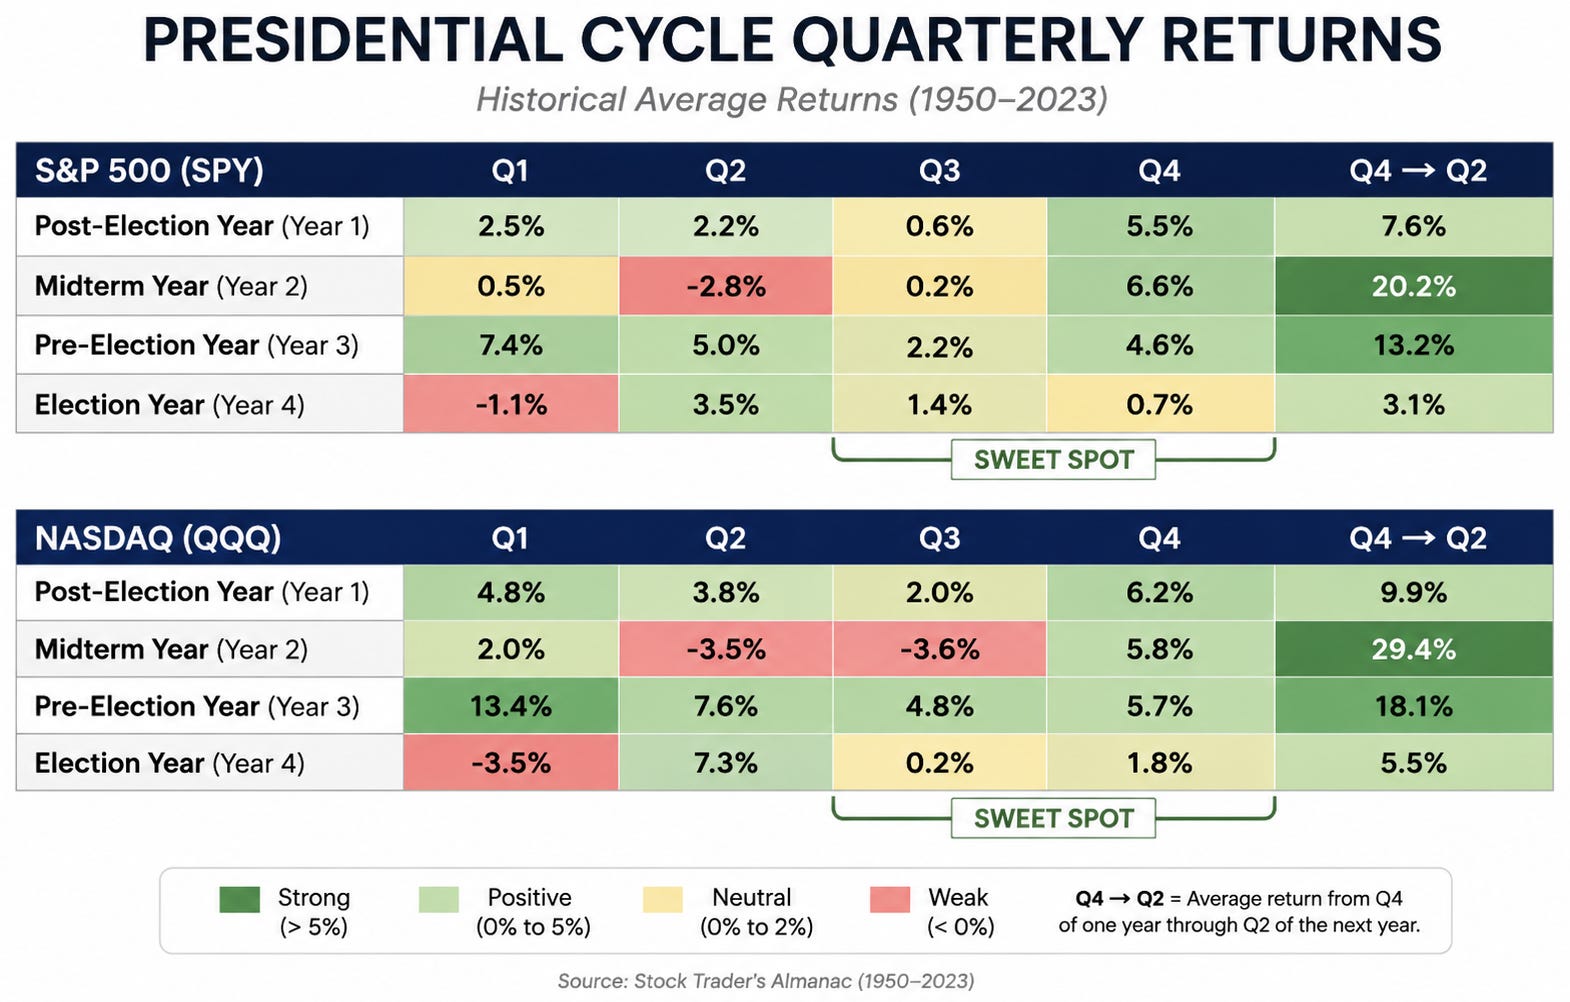
Below is a chart from the Stock Trader’s Almanac that summarizes quarterly performance for the S&P 500 and NASDAQ across each year of the four-year presidential cycle.
Note: The graph below and the majority of information in this article is derived from the 2025 Stock Trader Almanac.
Every presidential term consists of four market years:
Post-Election Year (Year 1)
Midterm Year (Year 2)
Pre-Election Year (Year 3)
Election Year (Year 4)
Historically, each year has displayed different tendencies. The market doesn’t simply move at random from one year to the next, certain periods have consistently produced stronger returns than others.
The most important takeaway from the chart is this:
Historically, the strongest period of the entire four-year cycle has been from Q4 of the Midterm Year through Q1 (and often Q2) of the Pre-Election Year.
In simple terms...
October of the Midterm Year → March (and often June) of the following year.
This has historically been one of the most favorable environments for equities.
Looking specifically at the S&P 500:
Midterm Q4: +6.6%
Pre-Election Q1: +7.4%
That’s nearly 14% across just two quarters.
Even more impressive, the chart shows that the average return from Midterm Q4 through Pre-Election Q2 has been approximately 20.2%.
That explains why this period is often referred to as the market’s “sweet spot.”
Technology stocks have historically shown an even stronger seasonal tendency.
During the same period:
Midterm Q4: +5.8%
Pre-Election Q1: +13.4%
Combined, that’s almost 20% over six months.
According to Stock Traders Almanac, when extending through Pre-Election Q2, the historical average reaches an impressive 29.4%.
This has historically been one of the strongest stretches of the entire four-year cycle.
Interestingly, the strongest rally often follows one of the weakest periods.
Historically:
Midterm Q2: -2.8%
Midterm Q3: +0.2%
Midterm Q2: -3.5%
Midterm Q3: -3.6%
In other words, weakness during the middle of the Midterm Year has frequently been followed by a significant recovery beginning in Q4.
No one knows with certainty, but several theories exist. We often discuss a few within our community. Examples often include that perhaps administrations tend to implement more difficult policies earlier in a presidential term, leaving room for improving economic conditions as the next election approaches.
Some suggest that midterms change the dichotomy of political powers, which influences the policies that are prioritized or investor confidence in an administration.
Others point to increased fiscal spending, supportive monetary policy, or simply investor psychology.
Regardless of the reason, the historical tendency has been remarkably persistent over many decades.
At the time of this writing. The following is true: SPY is at ATHs and QQQ is bouncing nicely off the bottom end of larger TF support and sits 2.5% away from new ATHs. We’ve experienced historical volatility of late. And, we are in in the middle of Q3. Which leads us to the most important lesson of this article….
Regardless of what price is showing us now, or has in the past, the Presidential Cycle does not tell us what the market must do. It simply tells us what the historical odds are. Just because we’re entering a historically strong window doesn’t mean prices can’t decline.
The tape is the truth. We very well could top our right here, right now. We very well could have a good Q4, but a choppy Q1 of next year.
Just like we would use annual seasonality to help us gauge our decisions, we understand that it can be inaccurate. - for example July is typically one the most bullish months, but this July, QQQ declined -6.5% and SPY broke nearly even on the month which was only possible via a bounce on the last two days of July near range lows, saving it from also having a red month.
Stats are not gospel.
As speculators, probabilities and stats are the lifeblood of how we function. So, we must at least be aware of them. But must take them for what they are.
First and foremost; Seasonality should never replace price action.
However, understanding where you are within the Presidential Cycle can provide valuable context.
Historically:
Midterm Q2–Q3 has often been the weakest stretch.
Q4 of the Midterm Year has frequently been a strong quarter
Q1 of the following year has typically been bullish.
With this information, we're simply trying to understand when the historical data shows us, because it does have value. Now, we can then combine that knowledge with what price is telling us today, and what it will tell us in the near future.
For now, midterms loom. Suffice it to say that after midterms in a few weeks, we can get a decent understanding of how we wrap up our year. We can then contrast that with the what the data shows. That is our next benchmark.
Let’s see what we get
GM
No posts
Comments
Nothing yet. Say the first thing.
Sign in to join the conversation.