
We all intuitively understand that supply and demand form the backbone of any market. I mean, we all saw energy prices in Europe explode higher when they sanctioned Russian energy after the Russian attack on Ukraine in 2022. We all knew that would happen, and it wasn’t a surprise to anyone. However, investors often forget this foundational concept when it comes to the stock market.
Today’s article will be the first of a two-part series in which we will explore how supply and demand help identify major tops and bottoms. We will look at examples from the 1970s energy bull market, the 1990s tech bubble, and the recent meme coin mania. We will then try to identify how these factors can help us determine the endgame of the AI bull run.
Source of shares supply and demand
The demand in the stock market is dependent on the investor’s willingness and ability to buy stocks.
The ability factor can be quantified easily by tracking inflows into pension funds, mutual funds, and ETFs, as well as foreign investments, household savings, and corporate cash allocated to buybacks. It’s the willingness factor that is hard to quantify and prone to rapid adjustments in response to market sentiment.
The investor’s willingness to buy is based on the company's earnings expectations as well as expectations about future market conditions. As you can imagine, these expectations can flip on a dime depending on prevailing market fear and greed at the time. We saw a pretty recent example of this back in April, and another, smaller one in July.
In conclusion, the demand side of this equation is quite flexible and prone to short-term swings that lead to market fluctuations.
The supply side, on the other hand, is much more definite. It can increase through IPOs, secondary offerings, stock-financed acquisitions, employee stock issuance, spin-offs, and conversion of convertible securities. It can decrease through share buybacks, going private, bankruptcies, and reverse splits.
Almost every single one of the supply-side factors takes time, especially the main ones, aka IPOs, stock-financed acquisitions, and share buybacks. What that means is that the supply in the stock market is quite fixed and visible for 1-1.5 years in advance.
The long-term market direction is determined by this supply side, and it’s usually the main cause for long-term market tops and bottoms in specific sectors.
1970s Energy Bubble
The 1970s saw huge increases in oil prices due to a combination of factors, namely the oil embargo by Arab nations, the Iranian Revolution, and 70s-era runaway inflation following the US's move off the gold standard.
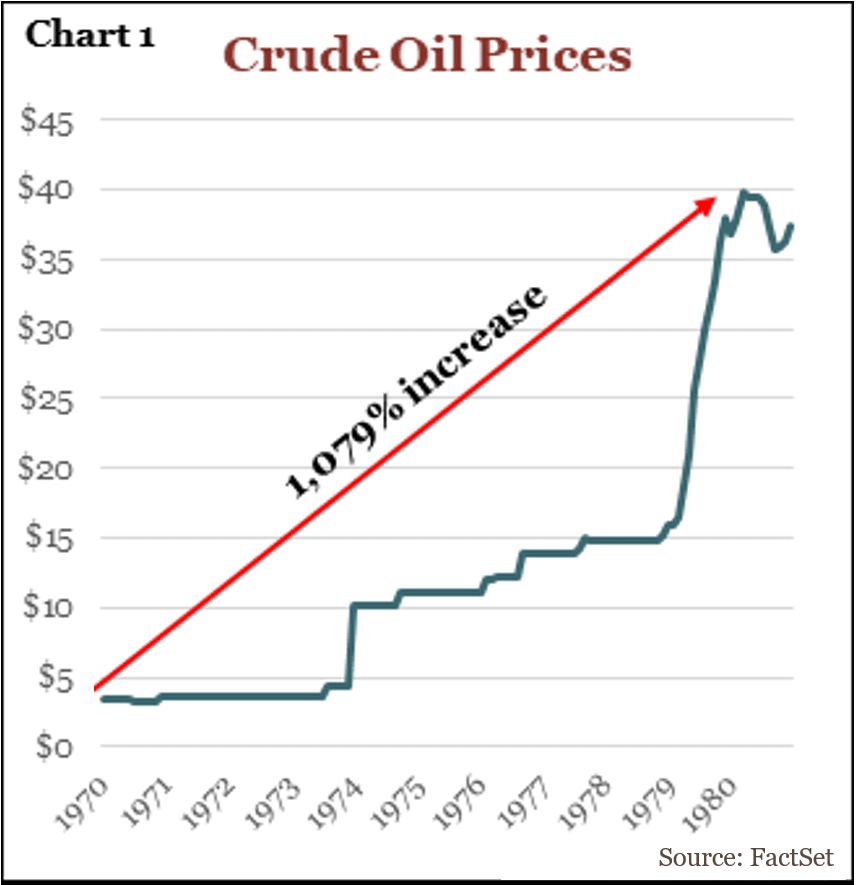
As one can imagine, this led to record profits for oil companies and a general belief that oil shortages were permanent. With an extended trend like that, it’s almost a given that individuals and funds were overweight in energy stocks by the late 1970s. That’s when the energy IPO boom began. The late 1970s saw a wave of independent oil and gas companies go public, such as:
Mesa Petroleum (multiple equity offerings during the boom)
Mitchell Energy
Parker Drilling
Many regional exploration companies in Texas, Oklahoma, Louisiana, and Alberta that had little chance of IPOing just a few years earlier
In this case, it wasn’t even massive IPOs. It was simply that the high oil prices made public equity financing easy for energy companies.
This was happening in conjunction with secondary offerings by major producers such as Occidental Petroleum, Tenneco, and Getty Oil, which used elevated share prices to raise equity for exploration.
As is often the case during such times, many exploration companies bought reserves using stock, with Mesa Petroleum being especially aggressive in such acquisitions and takeover attempts.
Even the established energy conglomerates used this period to reorganize operations. Standard Oil successor companies continued restructuring throughout this era, during which pipeline, refining, and exploration assets were increasingly separated into independent, publicly traded entities.
Each such structuring created additional securities for investors to evaluate and own.
As you can imagine, the supply of energy stocks expanded dramatically during this period.
Then came the shift. Oil prices topped out in 1980 and started a multi-year decline. The supply had increased significantly in previous years, and demand for energy stocks was already quite high. As mentioned before, most individuals and funds were already overweight energy. Even if we assume that demand didn’t decrease initially, there just wasn’t enough new demand coming in to balance the new supply, so energy stock prices started to go down. Then, once oil prices began to decline, sentiment soured too.
The souring sentiment would further reduce demand, which would further depress energy stock prices, creating a negative feedback loop that ultimately culminated in the energy bubble bursting, resulting in a multi-year decline for energy stocks and multiple bankruptcies by the end.
In short, higher oil prices => higher profits for energy stocks => higher demand for energy stocks => higher prices for energy stocks => increased supply to take advantage of the higher prices => demand stops increasing at some point and can’t absorb all the excess supply => energy stock prices start dropping => demand starts to decrease further
How would this downward move end?
It ended with supply reduction, as many energy companies declared bankruptcy, others were bought out at distressed prices, and many others bought back shares when they recognized they were selling at well below a reasonable valuation. With the decreased supply, demand eventually balanced it out, and a bottom was reached.
In the next article, we will see the same pattern during the 1990s tech boom, the more recent crypto meme coin mania, and discuss how we can use the pattern above to identify the end stages of the current AI run.
Something to think about before the next article is: "Are we starting to see increased supply in AI tech-related companies?” and “Have we seen an all-stock acquisition recently?”
Comments
Nothing yet. Say the first thing.
Sign in to join the conversation.