
Hi everyone. Today, I am doing some exciting and useful OSINT (Open Source Intelligence) work for Lead Generation for my business, so I thought it might be useful to give you all a taste of what can be done with even simple OSINT and Spatial Analysis skills.
If you want to learn more about OSINT and how it can benefit you and/or your businesses, you should enroll in my training. I am planning to teach the next OSINT for Everyone / Digital Detective class the week of September 1, 2026. That is only a few weeks away, so you should enroll if you would like to learn these skills. I am not going to teach forever. GrooveSeeker is taking off. :) Here are two options:
Enroll in only “Digital Detective” (pay full price for one class)
Enroll in the “Digital Investigator” bundle, which includes “Digital Detective” and “Knowledge Graphs from Scratch” (save 20% of the total cost of two classes)
If you want to learn programmatic OSINT, enroll here.
This is a really fun class, and I am also looking forward to teaching Knowledge Graphs from Scratch for the first time. It is a new addition to this second wave of classes.
Help me put food on my table while unlocking a valuable skillset. Enroll today.
Alright, let’s get to this article and SHOW how this stuff can be useful. Today, I am using it to support my own business.
Today, I am giving you code that really should be behind a premium article. I am doing it because I am teaching an OSINT class in a couple weeks and I want all of my readers to see the value that OSINT brings business.
So, do something for me, since I am giving you value for free:
Push that button and become a paying subscriber. Help me put food on my table and feed my family.
Push that button and share my work with others so that they can also learn the value that OSINT brings to business.
Push that button to share all of my articles with your network, because I have shown up week after week after week after week and continued to push forward with this blog.
Finally, enroll in a class or bundle. You also might want platform access to my tech.
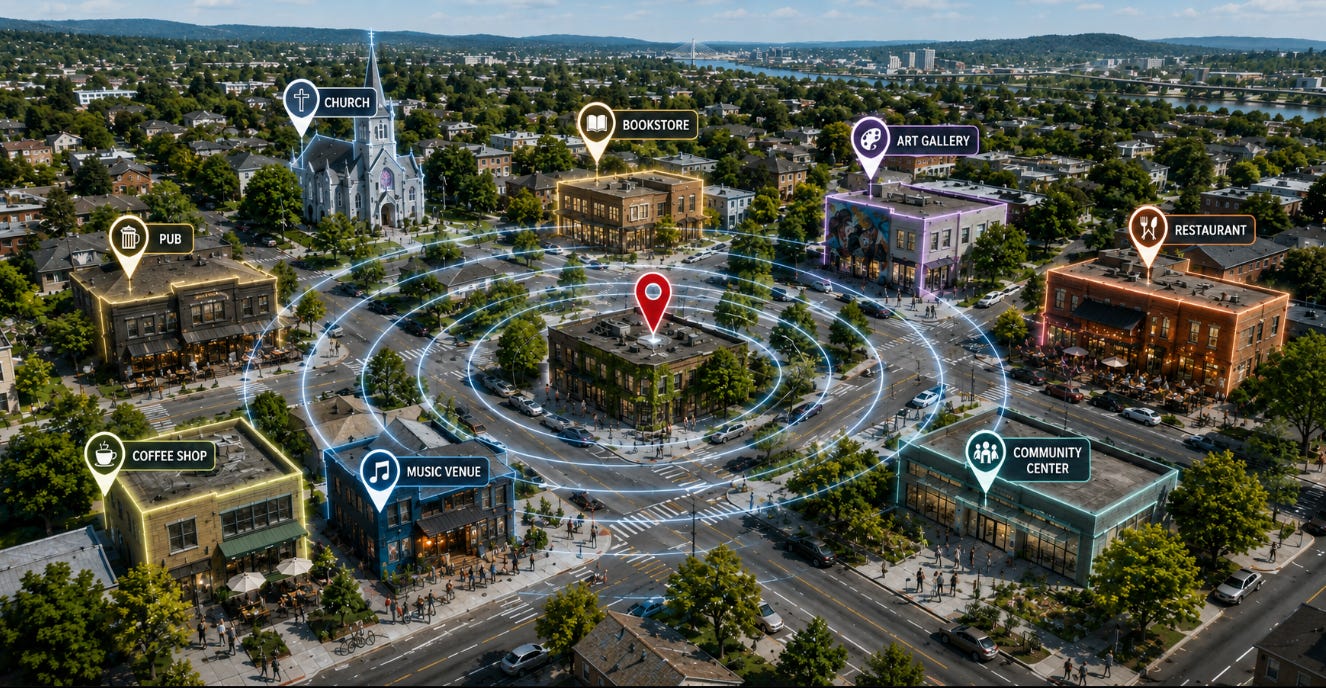
I am so annoyed by all of these “Not AI-First, Data-First” memes that are going around lately. This is Data Science. You start at the start: Problem Definition or Outcome Target. Not sometimes, ALWAYS.
I don’t like the phrase Problem Definition. In Intelligence, we aim for outcomes, so I rephrase Problem Definition to Outcome Target. What is our Outcome Target?
Outcome Target: Identify dozens of nearby businesses to begin my business outreach. Target Hillsboro, Beaverton, Forest Grove, and Downtown Portland. Capture the names, place types, and contact information. Produce a dataset that I will convert into a spreadsheet for use in my work.
Nice. Let’s break this up a little:
Identify dozens of nearby businesses to begin my business outreach. This is an example of OSINT-driven Lead Generation.
Produce a dataset that will help me in my work.
Cool. That is nice and easy. It is clear what we are trying to do. How will I do this? What is my methodology?
Methodology: Place location pindrops for each target area, then use OSMnx to identify relevant businesses and organizations within a 1 km radius of each pindrop.
And our overall goal is to produce a dataset that I will use to drive some of my work this week. Let’s get to it!
For this demonstration, I am showing with a 100 meter radius. It will take a while to run at 1 km, so I wanted to write this article showing the preview.
Those are my imports. The ox.settings stuff at the bottom was helpful. The first four lines are essential. You may not need the bottom three, but they helped me.
These are my pindrops. I wanted to do Lead Generation starting from seven different locations. These are all located near public transportation hubs or places I frequent.
This gets the leads.
It is called like this. This captures the leads and then appends them to my export_data.
This is a helpful function for visualizing the leads that were found.
It is called like that.
Let’s see some screenshots!
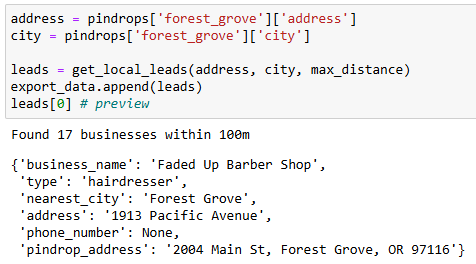
This is how I run my code. I like to see a preview.
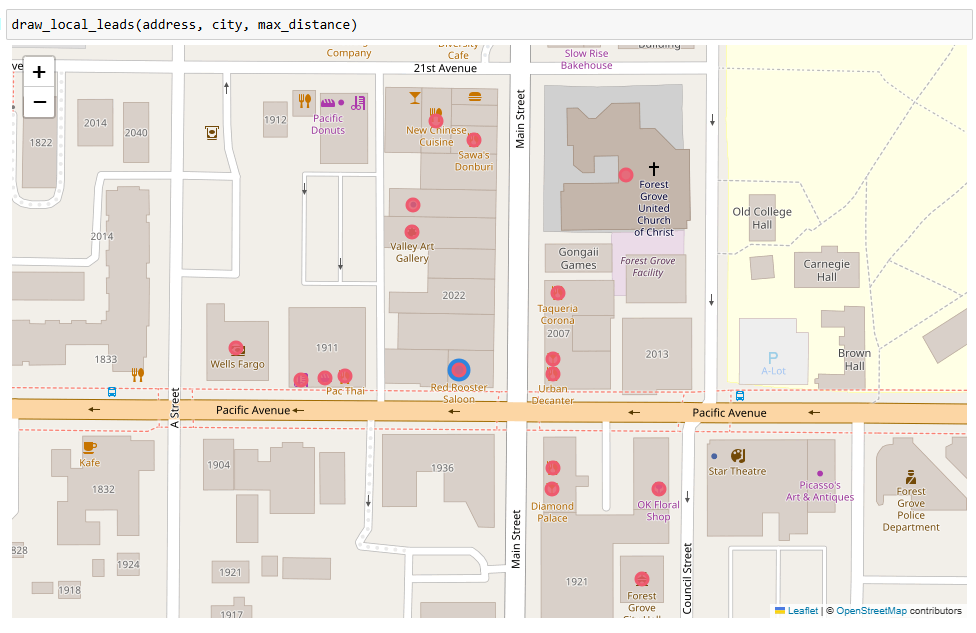
After capturing the data, I visualize it, so that I can explore. This is interactive in my Jupyter Notebook. I can click on the businesses to see what they are. This is a picture from Forest Grove, which is not a big city. Let’s look at Portland. It should have more going on.
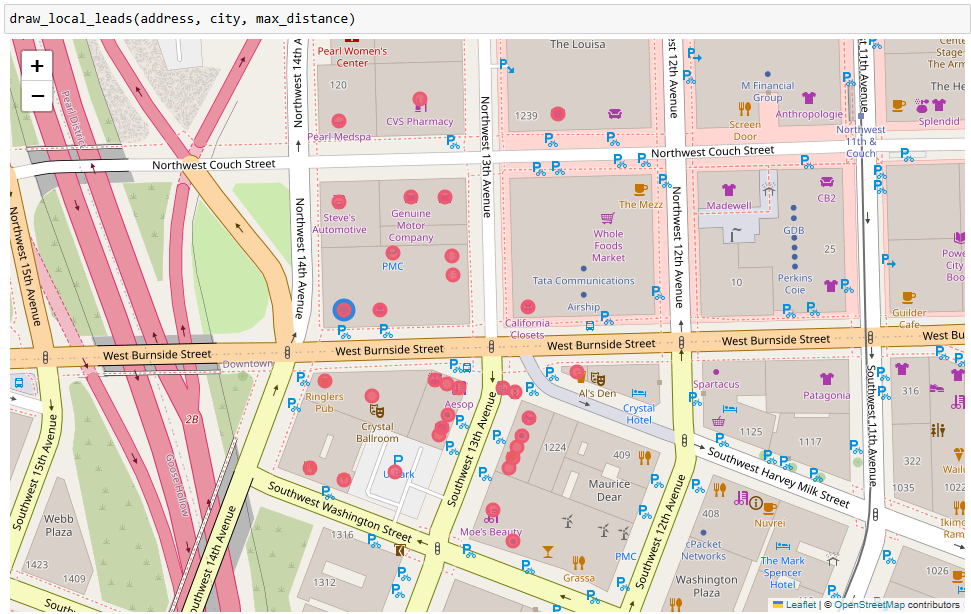
Nice. Each one of those red dots is a business I might want to talk to.
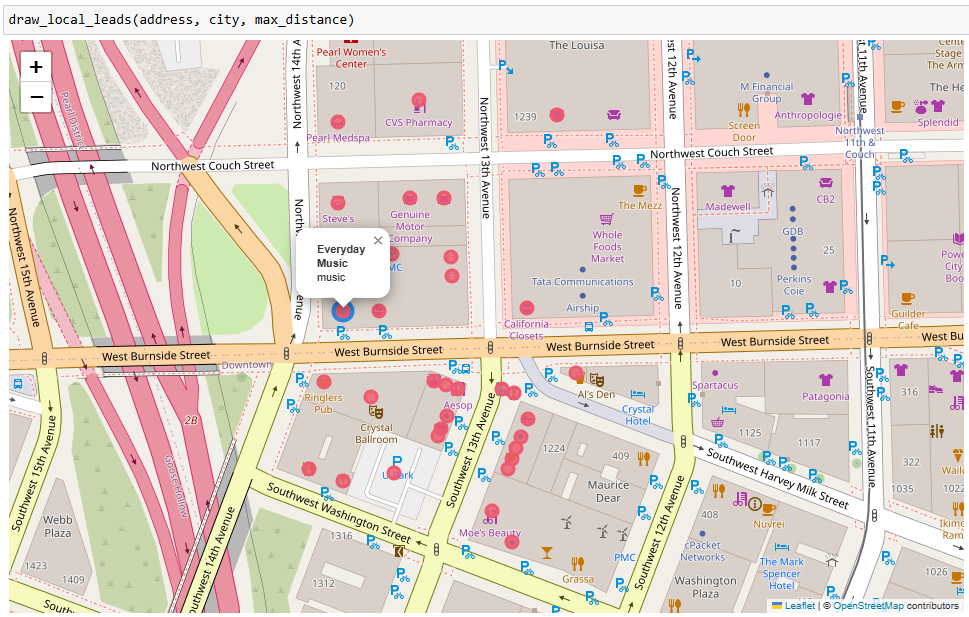
See, that is Everyday Music, one of Portland’s biggest record stores. There are many restaurants, bars, and venues nearby.
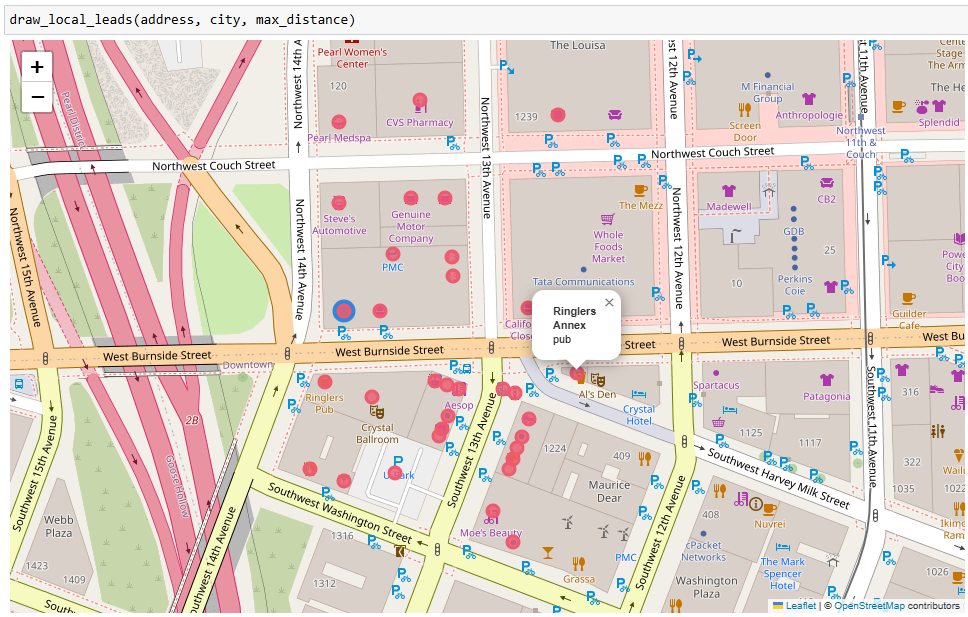
Nice. That is Ringler’s Annex, and Al’s Den is next door! I went to Al’s Den to see a Grateful Dead tribute band on Jerry Garcia’s Birthday this month. They definitely should be on the GrooveSeeker map, and they already are.
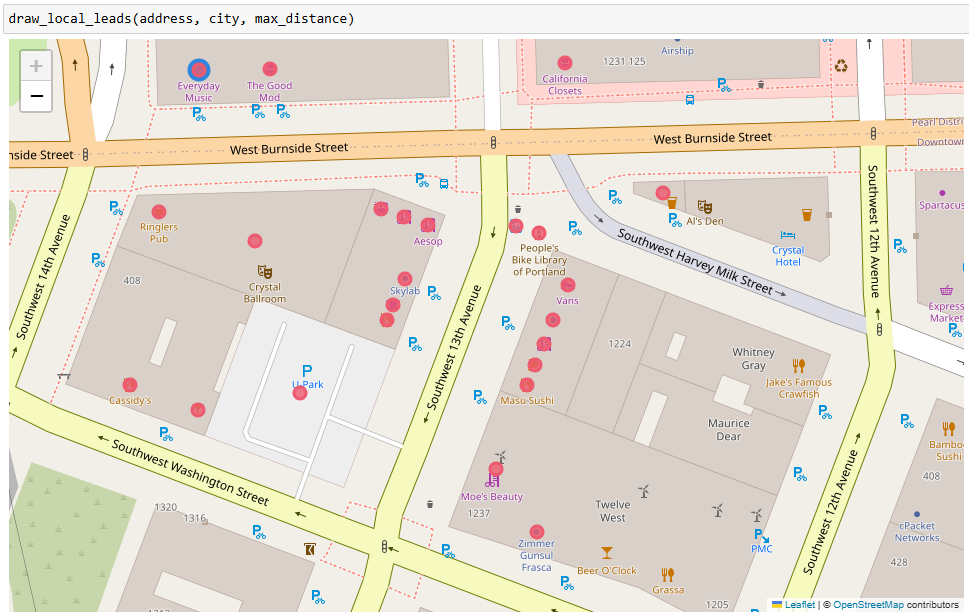
Here is a closer view. Beer O’ Clock. I should say hi to them, too. And Jake’s Famous Crawfish is sooooooooooooooooo good. Folks, these are ALL LEADS. This is what happens when you fuse Open Source Intelligence skills with Spatial Analysis, Data Science, and Software Engineering. If you want to get good at this stuff, learn from me. Enroll in a bundle today.
This looks great. I capture the leads from each pindrop into an export_data Python List, and then I use that list at the end by converting it into a Pandas DataFrame and then saving the data to CSV format.
There were multiple lists in the export_data (one for each pindrop), so this approach flattens the data before creating a DataFrame. Next time, I will just extend the data. Oops, that would have made my life a little easier. Haha.
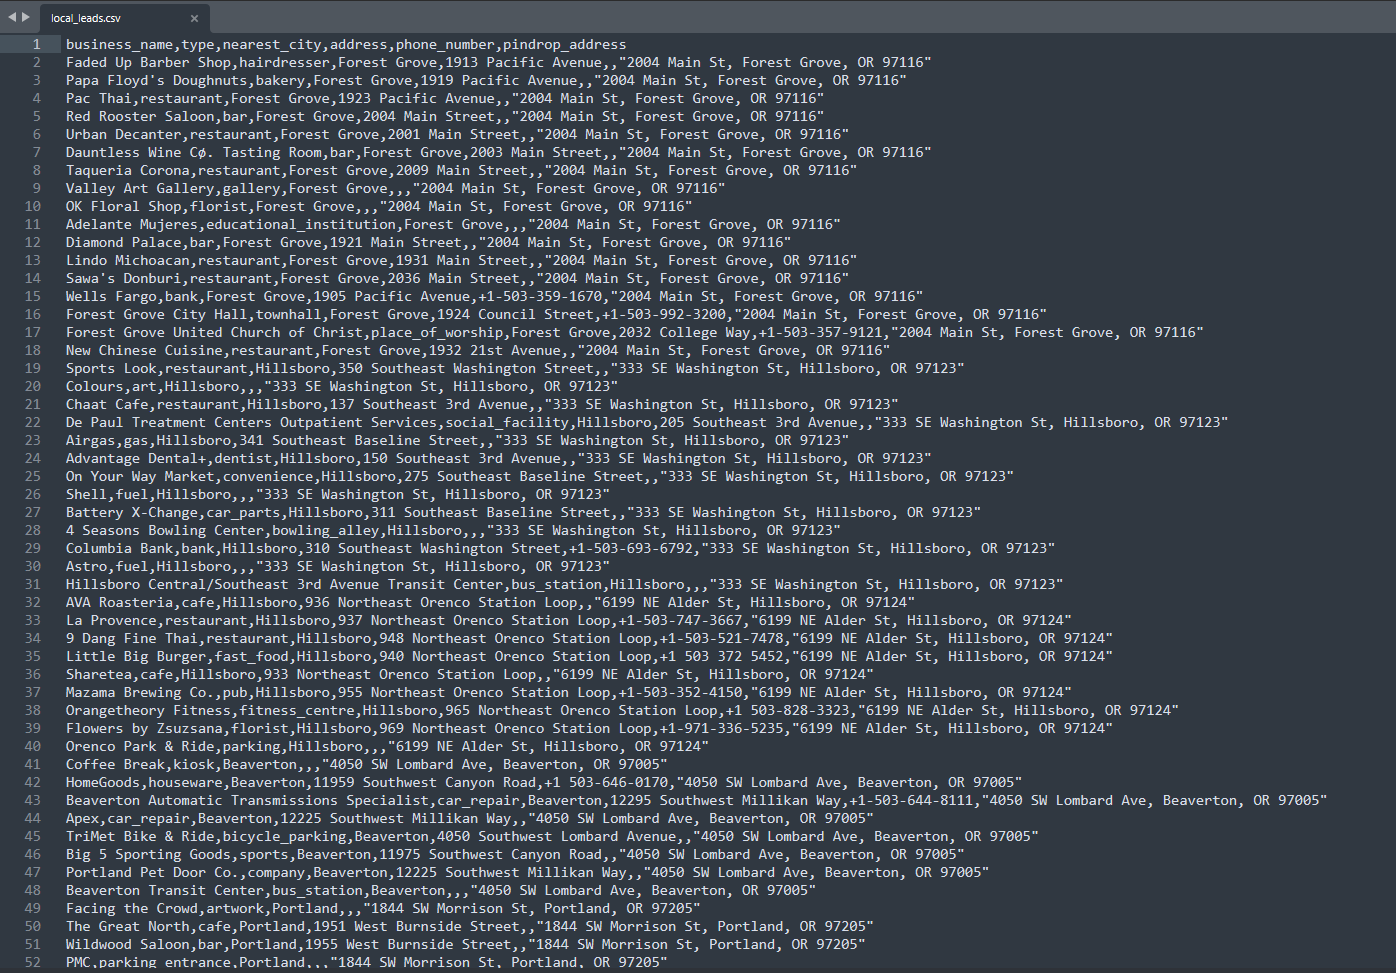
There we go! CSV data.
So, the entire workflow works. I ran it with a 100 meter radius. Now, I’m going to set it to 1000 (one kilometer), pull the trigger, and play video games until the job is done!
Thanks for reading. This was fun to put together. If you are interested in learning more about OSINT (or anything else that I teach) enroll in a class or bundle. You also might want platform access to my tech.
Thanks again. Now smash these buttons. :)
No posts
Comments
Nothing yet. Say the first thing.
Sign in to join the conversation.